


 |
市場調查報告書
商品編碼
1801924
肥料市場機會、成長動力、產業趨勢分析及2025-2034年預測Fertilizer Market Opportunity, Growth Drivers, Industry Trend Analysis, and Forecast 2025 - 2034 |
||||||
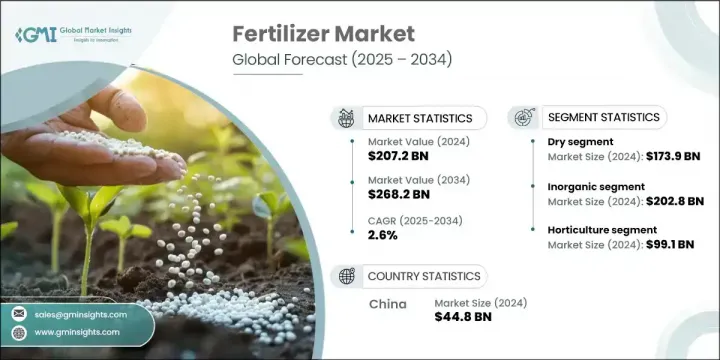
2024年,全球肥料市場規模達2,072億美元,預計到2034年將以2.6%的複合年成長率成長,達到2,682億美元。這一穩步成長反映了全球對更高農業產量的需求不斷成長,這主要源於人口成長和肥沃土地供應的減少。隨著人們更加重視永續農業和資源節約型實踐,無論是私人部門還是公共政策都在加速現代肥料解決方案的採用。技術創新的加強,尤其是在營養高效肥料方面的創新,正在推動農業向精準化轉型。
同時,生物基肥料的興起和精準農業的日益普及,正在重塑傳統的耕作方式,使其兼顧產量和環境影響。全球各國日益重視糧食生產能力,因而增加了穩定化肥供應的力道。政府支持的措施正在促進營養均衡施用,並鼓勵使用更清潔、更環保的肥料,以維護土壤健康和糧食安全。隨著各地區農業需求的持續攀升,生產規模化且有效率的供應鏈管理正變得越來越重要。
| 市場範圍 | |
|---|---|
| 起始年份 | 2024 |
| 預測年份 | 2025-2034 |
| 起始值 | 2072億美元 |
| 預測值 | 2682億美元 |
| 複合年成長率 | 2.6% |
2024年,乾肥市場價值達1,739億美元,彰顯其重要地位。乾肥配方因其更長的保存期限、便捷的物流以及更強的抗潮濕或微生物活動腐敗能力,將繼續佔據主導地位。其穩定性使其成為冷鏈支援有限地區散裝配送和儲存的理想選擇。此外,其輕質成分有助於降低運輸成本,並且在需要時更易於施用或混合,這在許多地區賦予了其明顯的營運優勢。
園藝應用領域引領市場,2024 年估值達 991 億美元。該領域使用各種先進肥料,包括富含微量營養素的混合肥料、緩釋配方和葉面噴施,以支持水果、蔬菜和溫室植物等高價值作物的生長。由於園藝作物對養分平衡的敏感性,精準施肥至關重要。包括水耕系統在內的受控環境農業進一步增加了專用肥料的使用,以保持植物的最佳生長,並在最小空間內實現產量最大化。
2024年,中國化肥市場規模達448億美元,佔全球43%的佔有率,這得益於高強度的耕作方式以及玉米、水稻和小麥等主糧作物需求的不斷成長。持續的耕作方式導致土壤養分枯竭,需要定期施肥補充。該地區龐大的農業基礎和對糧食安全的迫切需求使其成為化肥的主要消費國,其中,中國和印度憑藉其規模和人口動態,成為化肥需求的領頭羊。
全球肥料市場的領先公司包括 Coromandel International Limited、EuroChem Group、Bunge Limited、K+S Group、Nutrien、Sinofert Holdings Limited、Uralkali、IFFCO、Israel Chemicals、Syngenta、Haifa Group、Yara International、The Mosaic Company、OCP Group、Westfarmers 和 CF Industries。在肥料市場營運的公司正在透過提供永續和客製化的營養混合物(包括控釋肥料和生物基肥料)來實現產品組合多樣化,從而提升其市場地位。與農業科技公司的策略合作夥伴關係正在數位化整合,使製造商能夠提供即時土壤分析和精準施用工具等增值服務。許多參與者正在擴大新興市場的製造能力,以滿足不斷成長的當地需求並降低供應鏈風險。企業也正在投資研發,以開發符合生態法規的營養高效產品。此外,正在與政府和農業合作社簽訂長期契約,以確保穩定的採購量。
目錄
第1章:方法論與範圍
第2章:執行摘要
第3章:行業洞察
- 產業生態系統分析
- 供應商格局
- 利潤率
- 每個階段的增值
- 影響價值鏈的因素
- 中斷
- 產業衝擊力
- 成長動力
- 食品需求不斷成長
- 有機肥料需求不斷成長
- 水溶肥料需求不斷成長
- 產業陷阱與挑戰
- 缺乏對肥料最佳使用方法的認知
- 不確定性增加,政策重點轉向環境
- 市場機會
- 精準農業和智慧農業技術的採用日益增多
- 有機和生物肥料的需求不斷增加
- 政府對永續農業實踐的補貼和支持
- 成長動力
- 成長潛力分析
- 監管格局
- 北美洲
- 歐洲
- 亞太地區
- 拉丁美洲
- 中東和非洲
- 波特的分析
- PESTEL分析
- 價格趨勢
- 按地區
- 按產品
- 未來市場趨勢
- 技術和創新格局
- 當前的技術趨勢
- 新興技術
- 專利態勢
- 貿易統計(HS編碼)(註:僅提供重點國家的貿易統計資料)
- 主要進口國
- 主要出口國
- 永續性和環境方面
- 永續實踐
- 減少廢棄物的策略
- 生產中的能源效率
- 環保舉措
- 碳足跡考量
第4章:競爭格局
- 介紹
- 公司市佔率分析
- 按地區
- 北美洲
- 歐洲
- 亞太地區
- 拉丁美洲
- MEA
- 按地區
- 公司矩陣分析
- 主要市場參與者的競爭分析
- 競爭定位矩陣
- 關鍵進展
- 併購
- 夥伴關係與合作
- 新產品發布
- 擴張計劃
第5章:市場估計與預測:依形式,2021 - 2034 年
- 主要趨勢
- 乾燥
- 液體
第6章:市場估計與預測:按產品,2021 - 2034 年
- 主要趨勢
- 有機的
- 植物性
- 動物性
- 礦物質基
- 無機
- 氮
- 尿素
- 無水氨
- 能
- UAN解決方案
- 硫酸銨
- 磷
- 磷酸二銨
- 磷酸一銨
- 重過磷酸鈣
- 普通過磷酸鈣
- 聚磷酸銨
- 其他
- 鉀
- 氯化鉀
- 硫酸鉀
- 硝酸鉀
- 氮
第7章:市場估計與預測:按應用,2021 - 2034 年
- 主要趨勢
- 農業
- 園藝
- 園藝
- 其他
第8章:市場估計與預測:按地區,2021 - 2034 年
- 主要趨勢
- 北美洲
- 美國
- 加拿大
- 歐洲
- 德國
- 英國
- 法國
- 西班牙
- 義大利
- 歐洲其他地區
- 亞太地區
- 中國
- 印度
- 日本
- 澳洲
- 韓國
- 亞太其他地區
- 拉丁美洲
- 巴西
- 墨西哥
- 阿根廷
- 拉丁美洲其他地區
- 中東和非洲
- 沙烏地阿拉伯
- 南非
- 阿拉伯聯合大公國
- 中東和非洲其他地區
第9章:公司簡介
- Bunge Limited
- CF Industries Holdings
- Coromandel International Limited
- EuroChem Group
- Haifa Group
- IFFCO
- Israel Chemicals
- K+S Group
- Nutrien
- OCP Group
- Sinofert Holdings Limited
- Syngenta
- The Mosaic Company
- Uralkali
- Wesfarmers
- Yara International
The Global Fertilizer Market was valued at USD 207.2 billion in 2024 and is estimated to grow at a CAGR of 2.6% to reach USD 268.2 billion by 2034. This steady growth reflects the rising global need for higher agricultural output, largely driven by population growth and shrinking availability of fertile land. With more emphasis being placed on sustainable farming and resource-efficient practices, both private initiatives and public policies are accelerating the adoption of modern fertilizer solutions. Enhanced technological innovation, particularly in nutrient-efficient blends, is supporting the shift toward more precise farming.
At the same time, the emergence of bio-based fertilizers and the growing implementation of precision agriculture are reshaping traditional farming methods by prioritizing both yield and environmental impact. Globally, nations are increasing their focus on food production capacity, leading to a stronger push to stabilize fertilizer supplies. Government-backed initiatives are promoting the balanced application of nutrients and encouraging the adoption of cleaner, eco-conscious fertilizers to maintain soil health and food security. Production scaling and efficient supply chain management are becoming more central as agricultural demand continues to climb across regions.
| Market Scope | |
|---|---|
| Start Year | 2024 |
| Forecast Year | 2025-2034 |
| Start Value | $207.2 Billion |
| Forecast Value | $268.2 Billion |
| CAGR | 2.6% |
In 2024, the dry fertilizer segment accounted for USD 173.9 billion in market value, underscoring its significant presence. Dry formulations continue to dominate due to their extended shelf life, logistical convenience, and greater resistance to spoilage from moisture or microbial activity. Their stability makes them an ideal option for bulk distribution and storage in areas with limited cold chain support. Additionally, their lightweight composition contributes to lower transportation costs, and they are easier to apply or mix when needed, giving them a clear operational advantage in many regions.
The horticulture application segment led the market with a valuation of USD 99.1 billion in 2024. This sector uses a wide range of advanced fertilizers, including micronutrient-rich blends, slow-release formulations, and foliar sprays, to support high-value crops such as fruits, vegetables, and greenhouse plants. Due to the sensitivity of horticultural crops to nutrient balance, precision in application is essential. Controlled-environment agriculture, including hydroponic systems, has further increased the use of specialized fertilizers to maintain optimal plant growth and maximize output in minimal space.
China Fertilizer Market generated USD 44.8 billion holding 43% share in 2024 driven by high-intensity farming practices and a growing demand for staple crops like corn, rice, and wheat. Continuous cultivation practices have resulted in soil nutrient depletion, necessitating regular replenishment through fertilizer use. The region's large agricultural base and the urgency for food security make it a primary consumer of fertilizers, with China and India leading demand due to their scale and population dynamics.
Leading companies in the Global Fertilizer Market include Coromandel International Limited, EuroChem Group, Bunge Limited, K+S Group, Nutrien, Sinofert Holdings Limited, Uralkali, IFFCO, Israel Chemicals, Syngenta, Haifa Group, Yara International, The Mosaic Company, OCP Group, Westfarmers, and CF Industries Holdings. Companies operating in the fertilizer market are enhancing their market position by diversifying product portfolios with sustainable and customized nutrient blends, including controlled-release and bio-based fertilizers. Strategic partnerships with agri-tech firms are enabling digital integration, allowing manufacturers to offer value-added services like real-time soil analysis and precision application tools. Many players are expanding manufacturing capacity in emerging markets to meet rising local demand and reduce supply chain risks. Firms are also investing in R&D to develop nutrient-efficient products aligned with eco-regulations. Additionally, long-term contracts with governments and agricultural cooperatives are being pursued to ensure steady offtake.
Table of Contents
Chapter 1 Methodology & Scope
- 1.1 Market scope and definition
- 1.2 Research design
- 1.2.1 Research approach
- 1.2.2 Data collection methods
- 1.3 Data mining sources
- 1.3.1 Global
- 1.3.2 Regional/Country
- 1.4 Base estimates and calculations
- 1.4.1 Base year calculation
- 1.4.2 Key trends for market estimation
- 1.5 Primary research and validation
- 1.5.1 Primary sources
- 1.6 Forecast model
- 1.7 Research assumptions and limitations
Chapter 2 Executive Summary
- 2.1 Industry 3600 synopsis
- 2.2 Key market trends
- 2.2.1 Regional
- 2.2.2 Form
- 2.2.3 Product
- 2.2.4 Application
- 2.3 TAM Analysis, 2025-2034
- 2.4 CXO perspectives: Strategic imperatives
- 2.4.1 Executive decision points
- 2.4.2 Critical success factors
- 2.5 Future outlook and strategic recommendations
Chapter 3 Industry Insights
- 3.1 Industry ecosystem analysis
- 3.1.1 Supplier landscape
- 3.1.2 Profit margin
- 3.1.3 Value addition at each stage
- 3.1.4 Factor affecting the value chain
- 3.1.5 Disruptions
- 3.2 Industry impact forces
- 3.2.1 Growth drivers
- 3.2.1.1 Rising demand for food
- 3.2.1.2 Growing demand for organic fertilizers
- 3.2.1.3 Emerging demand for water soluble fertilizers
- 3.2.2 Industry pitfalls and challenges
- 3.2.2.1 Lack of awareness about the optimum usage of fertilizers
- 3.2.2.2 Increasing uncertainties and significant policy focus towards the environment
- 3.2.3 Market opportunities
- 3.2.3.1 Rising adoption of precision agriculture and smart farming technologies
- 3.2.3.2 Increasing demand for organic and bio-based fertilizers
- 3.2.3.3 Government subsidies and support for sustainable agricultural practices
- 3.2.1 Growth drivers
- 3.3 Growth potential analysis
- 3.4 Regulatory landscape
- 3.4.1 North America
- 3.4.2 Europe
- 3.4.3 Asia Pacific
- 3.4.4 Latin America
- 3.4.5 Middle East & Africa
- 3.5 Porter's analysis
- 3.6 PESTEL analysis
- 3.6.1 Technology and innovation landscape
- 3.6.2 Current technological trends
- 3.6.3 Emerging technologies
- 3.7 Price trends
- 3.7.1 By region
- 3.7.2 By product
- 3.8 Future market trends
- 3.9 Technology and innovation landscape
- 3.9.1 Current technological trends
- 3.9.2 Emerging technologies
- 3.10 Patent Landscape
- 3.11 Trade statistics (HS code) (Note: the trade statistics will be provided for key countries only)
- 3.11.1 Major importing countries
- 3.11.2 Major exporting countries
- 3.12 Sustainability and environmental aspects
- 3.12.1 Sustainable practices
- 3.12.2 Waste reduction strategies
- 3.12.3 Energy efficiency in production
- 3.12.4 Eco-friendly initiatives
- 3.13 Carbon footprint considerations
Chapter 4 Competitive Landscape, 2024
- 4.1 Introduction
- 4.2 Company market share analysis
- 4.2.1 By region
- 4.2.1.1 North America
- 4.2.1.2 Europe
- 4.2.1.3 Asia Pacific
- 4.2.1.4 LATAM
- 4.2.1.5 MEA
- 4.2.1 By region
- 4.3 Company matrix analysis
- 4.4 Competitive analysis of major market players
- 4.5 Competitive positioning matrix
- 4.6 Key developments
- 4.6.1 Mergers & acquisitions
- 4.6.2 Partnerships & collaborations
- 4.6.3 New product launches
- 4.6.4 Expansion plans
Chapter 5 Market Estimates and Forecast, By Form, 2021 - 2034 (USD Billion) (Kilo Tons)
- 5.1 Key trends
- 5.2 Dry
- 5.3 Liquid
Chapter 6 Market Estimates and Forecast, By Product, 2021 - 2034 (USD Billion) (Kilo Tons)
- 6.1 Key trends
- 6.2 Organic
- 6.2.1 Plant based
- 6.2.2 Animal based
- 6.2.3 Mineral based
- 6.3 Inorganic
- 6.3.1 Nitrogen
- 6.3.1.1 Urea
- 6.3.1.2 Anhydrous ammonia
- 6.3.1.3 CAN
- 6.3.1.4 UAN solution
- 6.3.1.5 Ammonium sulfate
- 6.3.2 Phosphorus
- 6.3.2.1 Diammonium phosphate
- 6.3.2.2 Monoammonium phosphate
- 6.3.2.3 Triple superphosphate
- 6.3.2.4 Ordinary superphosphate
- 6.3.2.5 Ammonium polyphosphate
- 6.3.2.6 Others
- 6.3.3 Potassium
- 6.3.3.1 Potassium chloride
- 6.3.3.2 Potassium sulfate
- 6.3.3.3 Potassium nitrate
- 6.3.1 Nitrogen
Chapter 7 Market Estimates and Forecast, By Application, 2021 - 2034 (USD Billion) (Kilo Tons)
- 7.1 Key trends
- 7.2 Agriculture
- 7.3 Horticulture
- 7.4 Gardening
- 7.5 Others
Chapter 8 Market Estimates and Forecast, By Region, 2021 - 2034 (USD Billion) (Kilo Tons)
- 8.1 Key trends
- 8.2 North America
- 8.2.1 U.S.
- 8.2.2 Canada
- 8.3 Europe
- 8.3.1 Germany
- 8.3.2 UK
- 8.3.3 France
- 8.3.4 Spain
- 8.3.5 Italy
- 8.3.6 Rest of Europe
- 8.4 Asia Pacific
- 8.4.1 China
- 8.4.2 India
- 8.4.3 Japan
- 8.4.4 Australia
- 8.4.5 South Korea
- 8.4.6 Rest of Asia Pacific
- 8.5 Latin America
- 8.5.1 Brazil
- 8.5.2 Mexico
- 8.5.3 Argentina
- 8.5.4 Rest of Latin America
- 8.6 Middle East and Africa
- 8.6.1 Saudi Arabia
- 8.6.2 South Africa
- 8.6.3 UAE
- 8.6.4 Rest of Middle East and Africa
Chapter 9 Company Profiles
- 9.1 Bunge Limited
- 9.2 CF Industries Holdings
- 9.3 Coromandel International Limited
- 9.4 EuroChem Group
- 9.5 Haifa Group
- 9.6 IFFCO
- 9.7 Israel Chemicals
- 9.8 K+S Group
- 9.9 Nutrien
- 9.10 OCP Group
- 9.11 Sinofert Holdings Limited
- 9.12 Syngenta
- 9.13 The Mosaic Company
- 9.14 Uralkali
- 9.15 Wesfarmers
- 9.16 Yara International
 緩釋肥料市場:2026-2032年全球市場預測(以包膜類型、作物類型、釋放週期、養分類型、施用方法、最終用途和銷售管道)
 2026年全球生物炭肥料市場報告幾丁質肥料市場:2026-2032年全球市場預測(按應用、類型、原料、配方和分銷管道分類)肥料包膜市場:2026-2032年全球市場預測(以包膜化學、釋放機制、包膜養分類型、外形規格、製造流程、最終用途及通路分類)化肥市場:2026-2032年全球市場預測(依產品類型、作物類型、包裝、施用方法、最終用戶和分銷管道分類)
 海藻土壤改良劑市場預測至 2034 年—按產品類型、海藻種類、形態、應用、養殖方法、通路和地區進行全球分析。藻類肥料市場:2026-2032年全球市場預測(依原料、產品類型、通路及應用分類)複合肥料市場:按產品類型、作物類型、物理形態和應用分類的全球市場預測,2026-2032年顆粒肥料市場:依產品類型、作物類型、配方類型、施用方法、包裝類型、使用時間、最終用戶和銷售管道分類-2026-2032年全球預測
 矽肥市場報告:按類型、形態、應用和地區分類(2026-2034年)