


 |
市場調查報告書
商品編碼
1693544
非洲肥料:市場佔有率分析、產業趨勢與統計、成長預測(2025-2030)Africa Fertilizers - Market Share Analysis, Industry Trends & Statistics, Growth Forecasts (2025 - 2030) |
||||||
價格
※ 本網頁內容可能與最新版本有所差異。詳細情況請與我們聯繫。
簡介目錄
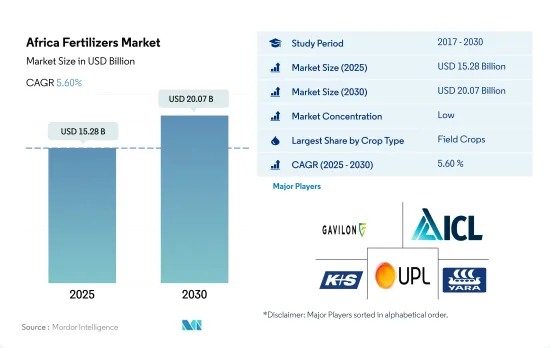
預計 2025 年非洲肥料市場規模將達到 152.8 億美元,預計到 2030 年將達到 200.7 億美元,預測期內(2025-2030 年)的複合年成長率為 5.60%。
由於人口不斷成長,糧食需求不斷增加,預計 2023 年至 2030 年間,各類作物的化肥使用量將會增加。
- 2022年,非洲化肥消費量以田間作物為主,佔總量的71.1%。這相當於消費量1550萬噸,價值118億美元。
- 緊隨其後的是園藝作物,佔非洲化肥消費量的 28.7%,2022 年價值 47.7 億美元。消費量仍維持在 9,000 噸的適度水平,而園藝作物的種植面積從 2017 年的 3,650 萬公頃擴大到 2022 年的 3,770 萬公頃。這一成長是由對隱性飢餓和營養不良的擔憂導致對水果和蔬菜等高價值作物的需求增加所推動的。耕地面積的快速增加凸顯了提高生產力和增加園藝作物施肥的必要性。
- 受非洲國際市場對花卉的需求所推動,草坪和觀賞作物佔2021年非洲化肥消費量的8.9%。這相當於市場規模為7.706億美元,消費量150萬噸。
- 然而,到2022年,草皮和觀賞作物僅佔非洲化肥消費量的0.02%。該領域的市場規模為 350 萬美元,消費量為 4,500 噸。常規肥料佔了57.0%的市場佔有率,專用肥料佔據了剩餘的43.0%。
- 預計所有作物類型的化肥使用量都將增加。這種成長的動力來自於滿足快速成長的人口的糧食需求、實現更高的產量以及提高作物生產率。
南非是非洲大陸主要農業生產國之一,依賴進口。
- 非洲蘊藏量豐富的氮、磷酸鹽和鉀礦藏,有潛力成為全球化肥市場的主要企業。該地區人口快速成長,加上食品消費模式的不斷變化和收入的不斷提高,推動了農業產量的提高。因此,預計肥料需求將會增加。
- 2022年,奈及利亞佔據非洲化肥市場的36.7%的佔有率。奈及利亞是世界主要米消費量國之一,每年生產700萬噸米。該國的經濟成長主要由農業部門推動,預計未來幾年將維持 5.5% 的複合年成長率。
- 儘管奈及利亞是農業大國,但其化肥使用量相對較低,每公頃不到20公斤。這表明增加施肥率具有巨大潛力,這可能會推動市場進一步成長。相較之下,埃及和南非等國家的用水量已經大大超過奈及利亞,這意味著奈及利亞需要成長約 500% 才能趕上。
- 南非是非洲農業大國,嚴重依賴化肥進口。鉀肥全部在國內消費,但60%至70%的氮肥依賴進口。與其他市場不同,南非的化肥產業在放鬆管制的環境中營運,沒有進口關稅或政府計劃。隨著作物種植面積的激增,南非化肥市場預計將大幅成長,從 2022 年的 17.7 億美元擴大到 2030 年的 56 億美元。
非洲肥料市場趨勢
該地區有潛力使農業產量加倍,而不斷成長的消費需求預計將導致田間作物種植面積的擴大。
- 非洲的農業生態學區從每年降雨兩次的茂密熱帶雨林到降雨稀少的乾旱沙漠。該地區的主要田間作物包括玉米、高粱、小麥和水稻。 2022年,這些作物的種植面積達到2.248億公頃,佔農業用地總面積的95%以上。
- 2018-19年度,因供應過剩導致價格受壓,南非玉米種植面積減少10%,至210萬公頃。結果,國內玉米產量下降了11%,從1,300萬噸下降到1,200萬噸,而出口量也從250萬噸暴跌到100萬噸。因此,生產商可能會從玉米轉向作物,尤其是大豆。預計此轉變將導致2018-2019年非洲玉米種植面積整體下降。
- 非洲最大的高粱生產國是奈及利亞,緊隨其後的是衣索比亞。高粱佔奈及利亞穀物產量的50%,佔其穀物種植面積的45%,是一種耐旱作物,可適應多種土壤條件。這些特性使得高粱成為一種首選的主要作物,尤其是在非洲的乾旱地區,確保了糧食和收入安全。
- 肯亞、索馬利亞和衣索比亞大部分地區面臨嚴重糧食不安全的迫在眉睫的威脅。過去十年,儘管非洲的農業和耕地面積不斷擴大,但其糧食進口支出卻增加了近兩倍。
氮是多種田間作物必需的關鍵營養素,而油菜籽是該地區的主要營養消耗作物。
- 油菜作物鉀、磷施用量最高,2022年分別為162.4公斤/公頃、281.7公斤/公頃。同時,2022年非洲田間作物平均氮肥施用量將達364.9公斤/公頃。
- 2022年,非洲田間作物佔一次養分總消費量的87.1%,達55.61萬噸。這項優勢得益於用於田間作物的土地面積廣闊。具體而言,2022年這些作物的平均氮、磷、鉀養分施用量分別為223.2公斤/公頃、125.3公斤/公頃、155.3公斤/公頃。
- 奈及利亞的幾內亞大草原為玉米生產提供了適當的環境條件。然而,儘管具有這樣的潛力,該地區的農民仍然在為低產量而苦苦掙扎。主要原因是由於土地集約利用導致土壤劣化和養分耗盡(主要是氮)。田間作物優先施用氮肥,因為氮肥具有多種益處,包括犁地、增加葉面積、形成籽粒、灌漿和促進蛋白質合成。氮在提高作物產量和品質方面也發揮著重要作用。基本營養物質對於作物生長至關重要,由於對土壤貧化和氮淋失的擔憂,預計未來幾年基本營養物質的施用率將大幅增加。
非洲肥料產業概況
非洲肥料市場細分化,前五大公司佔7.43%。該市場的主要企業包括 Gavilon South Africa(MacroSource, LLC)、ICL Group Ltd、K+S Aktiengesellschaft、UPL Limited、Yara International ASA 等。
其他福利
- Excel 格式的市場預測 (ME) 表
- 3個月的分析師支持
目錄
第1章執行摘要和主要發現
第2章 報告要約
第3章 引言
- 研究假設和市場定義
- 研究範圍
- 調查方法
第4章 產業主要趨勢
- 主要作物種植面積
- 田間作物
- 園藝作物
- 平均養分施用量
- 微量營養素
- 田間作物
- 園藝作物
- 主要營養素
- 田間作物
- 園藝作物
- 次要宏量營養素
- 田間作物
- 園藝作物
- 微量營養素
- 灌溉農田
- 法律規範
- 價值鍊和通路分析
第5章市場區隔
- 類型
- 複合型
- 直的
- 微量營養素
- 硼
- 銅
- 鐵
- 錳
- 鉬
- 鋅
- 其他
- 氮
- 硝酸銨
- 尿素
- 其他
- 磷酸
- DAP
- MAP
- SSP
- TSP
- 鉀
- MoP
- SoP
- 次要營養物質
- 鈣
- 鎂
- 硫
- 形式
- 傳統的
- 特別的
- CRF
- 液體肥料
- SRF
- 水溶性
- 施肥方式
- 受精
- 葉面噴布
- 土壤
- 作物類型
- 田間作物
- 園藝作物
- 草坪和觀賞植物
- 原產地
- 奈及利亞
- 南非
- 其他非洲國家
第6章競爭格局
- 關鍵策略趨勢
- 市場佔有率分析
- 商業狀況
- 公司簡介
- Foskor
- Gavilon South Africa(MacroSource, LLC)
- Haifa Group
- ICL Group Ltd
- K+S Aktiengesellschaft
- Kynoch Fertilizer
- UPL Limited
- Yara International ASA
第7章:CEO面臨的關鍵策略問題
第 8 章 附錄
- 世界概況
- 概述
- 五力分析框架
- 全球價值鏈分析
- 市場動態(DRO)
- 資訊來源及延伸閱讀
- 圖片列表
- 關鍵見解
- 數據包
- 詞彙表
簡介目錄
Product Code: 92609
The Africa Fertilizers Market size is estimated at 15.28 billion USD in 2025, and is expected to reach 20.07 billion USD by 2030, growing at a CAGR of 5.60% during the forecast period (2025-2030).
The application of fertilizers in the respective crop types is anticipated to grow during 2023-2030, owing to the increasing need for food to feed the growing populations
- In 2022, field crops dominated fertilizer consumption in Africa, representing 71.1% of the total. This translated to a volume consumption of 15.5 million metric tons, valued at USD 11.80 billion.
- Horticultural crops followed, accounting for 28.7% of Africa's fertilizer consumption, valued at USD 4.77 billion in 2022. Despite a modest volume consumption of 9.0 thousand metric tons, the cultivation area for horticultural crops expanded from 36.5 million hectares in 2017 to 37.7 million hectares in 2022. This growth was driven by rising demand for high-value crops, such as fruits and vegetables, amidst concerns of hidden hunger and malnutrition. This surge in cultivation areas underscores the need for enhanced productivity, driving up fertilizer application in horticultural crops.
- Turf & ornamental crops, primarily driven by the demand for African flowers in international markets, accounted for 8.9% of Africa's fertilizer consumption in 2021. This translated to a market value of USD 770.6 million and a volume consumption of 1.5 million metric tons.
- However, in 2022, the share of turf and ornamental crops in Africa's fertilizer consumption dropped to a mere 0.02%. The market value for this segment was USD 3.5 million, with a volume consumption of 4.5 thousand metric tons. Conventional fertilizers dominated the market, capturing a 57.0% share, while specialty fertilizers accounted for the remaining 43.0%.
- The application of fertilizers across crop types is expected to rise. This growth is driven by the need to meet the food demands of a burgeoning population, achieve higher yields, and enhance crop productivity.
South Africa is one of the major agriculture-producing countries in the continent and is import-dependent
- Africa's vast mineral reserves of nitrogen, phosphate, and potash position it as a potential major player in the global fertilizer market. The region's rapid population growth, coupled with evolving food consumption patterns and rising incomes, is driving a need for increased agricultural production. This, in turn, is expected to lead to an increase in fertilizer demand.
- In 2022, Nigeria dominated the African fertilizer market, accounting for 36.7% of the total. Nigeria boasts one of the world's highest rice consumption rates, with an annual production of 7 million metric tons. The country's economic growth, primarily propelled by the agricultural sector, is projected to sustain a CAGR of 5.5% in the coming years.
- Despite being a major player, Nigeria's fertilizer usage remains relatively low, at under 20kg/hectare. This indicates a significant untapped potential for increased fertilizer application, potentially driving further market growth. In comparison, countries like Egypt and South Africa have already surpassed Nigeria's usage by a significant margin, suggesting a potential leap of around 500% for Nigeria to catch up.
- South Africa, a key agricultural nation in Africa, heavily relies on fertilizer imports. While all potassic fertilizers are domestically consumed, a substantial 60%-70% of nitrogenous fertilizers are imported. Unlike some other markets, South Africa's fertilizer sector operates in a deregulated landscape, devoid of import tariffs or government schemes. With a surge in crop cultivation, the South African fertilizer market is projected to witness substantial growth, expanding from USD 1.77 billion in 2022 to USD 5.60 billion by 2030.
Africa Fertilizers Market Trends
The region has the potential to double its agricultural production, and the area under field crops is expected to expand due to the rising consumption demand
- The agroecological zones in Africa span from dense rainforests with bi-annual rainfall to arid deserts with minimal precipitation. Dominant field crops in the region include corn, sorghum, wheat, and rice. In 2022, the cultivation area for these crops reached 224.8 million hectares, accounting for over 95% of the total agricultural land.
- In the 2018-19 season, South African corn farmers reduced their planted area by 10% to 2.1 million hectares, responding to an oversupply that suppressed prices. Consequently, corn production in the country dipped by 11%, from 13 million to 12 million tonnes, and exports plummeted from 2.5 million to 1 million tonnes. In light of this, producers were likely to pivot from corn to oilseed crops, with soybeans being a favored choice. This shift was anticipated to lead to an overall decline in corn cultivation across Africa from 2018 to 2019.
- Nigeria takes the lead as the largest sorghum producer in Africa, closely followed by Ethiopia. Sorghum, accounting for 50% of Nigeria's cereal output and occupying 45% of its cereal cultivation land, is a drought-tolerant crop with adaptability to diverse soil conditions. These qualities make sorghum a preferred staple crop, particularly in Africa's drier regions, ensuring food and income security.
- Kenya, Somalia, and significant parts of Ethiopia face an imminent threat of severe food shortages. Over the past decade, Africa's spending on food imports nearly tripled despite a consistent expansion in its agricultural industry and cultivated land.
Nitrogen stands out as a crucial nutrient essential for various field crops, with rapeseed being the primary nutrient consumer in this region
- Rapeseed crops have the highest potassium and phosphorous application rates, accounting for 162.4 kg/hectare and 281.7 kg/hectare, respectively, in 2022. Meanwhile, the average nitrogen application rate for field crops in Africa stood at 364.9 kg/hectare in 2022.
- In 2022, field crops in Africa accounted for 87.1% of the total primary nutrient consumption, which amounted to 556.1 thousand metric tons. This dominance can be attributed to the extensive land area dedicated to field crops. Specifically, the average nutrient application rates for nitrogen, phosphorous, and potassium in these crops were 223.2 kg/ha, 125.3 kg/ha, and 155.3 kg/ha, respectively, in 2022.
- The Guinea savannas in Nigeria offer favorable environmental conditions for maize production. However, despite this potential, farmers in the region struggle with low yields. The primary culprits are soil degradation and nutrient depletion, primarily nitrogen, resulting from intensified land use. Field crops prioritize nitrogen application due to its multiple benefits, including promoting tillering, leaf area development, grain formation, filling, and protein synthesis. Nitrogen also plays a crucial role in enhancing both grain yield and quality. Given that primary nutrients are vital for crop growth and with concerns over soil depletion and nitrogen leaching, the application rates for primary nutrients are expected to witness significant growth in the coming years.
Africa Fertilizers Industry Overview
The Africa Fertilizers Market is fragmented, with the top five companies occupying 7.43%. The major players in this market are Gavilon South Africa (MacroSource, LLC), ICL Group Ltd, K+S Aktiengesellschaft, UPL Limited and Yara International ASA (sorted alphabetically).
Additional Benefits:
- The market estimate (ME) sheet in Excel format
- 3 months of analyst support
TABLE OF CONTENTS
1 EXECUTIVE SUMMARY & KEY FINDINGS
2 REPORT OFFERS
3 INTRODUCTION
- 3.1 Study Assumptions & Market Definition
- 3.2 Scope of the Study
- 3.3 Research Methodology
4 KEY INDUSTRY TRENDS
- 4.1 Acreage Of Major Crop Types
- 4.1.1 Field Crops
- 4.1.2 Horticultural Crops
- 4.2 Average Nutrient Application Rates
- 4.2.1 Micronutrients
- 4.2.1.1 Field Crops
- 4.2.1.2 Horticultural Crops
- 4.2.2 Primary Nutrients
- 4.2.2.1 Field Crops
- 4.2.2.2 Horticultural Crops
- 4.2.3 Secondary Macronutrients
- 4.2.3.1 Field Crops
- 4.2.3.2 Horticultural Crops
- 4.2.1 Micronutrients
- 4.3 Agricultural Land Equipped For Irrigation
- 4.4 Regulatory Framework
- 4.5 Value Chain & Distribution Channel Analysis
5 MARKET SEGMENTATION (includes market size in Value in USD and Volume, Forecasts up to 2030 and analysis of growth prospects)
- 5.1 Type
- 5.1.1 Complex
- 5.1.2 Straight
- 5.1.2.1 Micronutrients
- 5.1.2.1.1 Boron
- 5.1.2.1.2 Copper
- 5.1.2.1.3 Iron
- 5.1.2.1.4 Manganese
- 5.1.2.1.5 Molybdenum
- 5.1.2.1.6 Zinc
- 5.1.2.1.7 Others
- 5.1.2.2 Nitrogenous
- 5.1.2.2.1 Ammonium Nitrate
- 5.1.2.2.2 Urea
- 5.1.2.2.3 Others
- 5.1.2.3 Phosphatic
- 5.1.2.3.1 DAP
- 5.1.2.3.2 MAP
- 5.1.2.3.3 SSP
- 5.1.2.3.4 TSP
- 5.1.2.4 Potassic
- 5.1.2.4.1 MoP
- 5.1.2.4.2 SoP
- 5.1.2.5 Secondary Macronutrients
- 5.1.2.5.1 Calcium
- 5.1.2.5.2 Magnesium
- 5.1.2.5.3 Sulfur
- 5.2 Form
- 5.2.1 Conventional
- 5.2.2 Speciality
- 5.2.2.1 CRF
- 5.2.2.2 Liquid Fertilizer
- 5.2.2.3 SRF
- 5.2.2.4 Water Soluble
- 5.3 Application Mode
- 5.3.1 Fertigation
- 5.3.2 Foliar
- 5.3.3 Soil
- 5.4 Crop Type
- 5.4.1 Field Crops
- 5.4.2 Horticultural Crops
- 5.4.3 Turf & Ornamental
- 5.5 Country
- 5.5.1 Nigeria
- 5.5.2 South Africa
- 5.5.3 Rest of Africa
6 COMPETITIVE LANDSCAPE
- 6.1 Key Strategic Moves
- 6.2 Market Share Analysis
- 6.3 Company Landscape
- 6.4 Company Profiles
- 6.4.1 Foskor
- 6.4.2 Gavilon South Africa (MacroSource, LLC)
- 6.4.3 Haifa Group
- 6.4.4 ICL Group Ltd
- 6.4.5 K+S Aktiengesellschaft
- 6.4.6 Kynoch Fertilizer
- 6.4.7 UPL Limited
- 6.4.8 Yara International ASA
7 KEY STRATEGIC QUESTIONS FOR FERTILIZER CEOS
8 APPENDIX
- 8.1 Global Overview
- 8.1.1 Overview
- 8.1.2 Porter's Five Forces Framework
- 8.1.3 Global Value Chain Analysis
- 8.1.4 Market Dynamics (DROs)
- 8.2 Sources & References
- 8.3 List of Tables & Figures
- 8.4 Primary Insights
- 8.5 Data Pack
- 8.6 Glossary of Terms
02-2729-4219
+886-2-2729-4219
 硼肥市場-全球產業規模、佔有率、趨勢、機會和預測,依來源、應用、區域和競爭格局分類,2020-2030年預測全球糞肥市場-產業規模、佔有率、趨勢、機會及預測,依類型、形態、應用、區域及競爭格局分類,2020-2030年預測昆蟲肥料市場-全球產業規模、佔有率、趨勢、機會和預測,按類型、形態、應用、地區和競爭格局分類,2020-2030年預測海藻肥料市場-全球產業規模、佔有率、趨勢、機會和預測,按形態(液體和粉末)、應用(農場、花園及其他)、地區和競爭格局分類,2020-2030年預測聚合物包膜肥料市場-全球產業規模、佔有率、趨勢、機會和預測,按類型、作物類型、地區和競爭格局分類,2020-2030年預測
 按營養類型、形態、施用方法、作物類型、品種和地區分類的啟動肥市場規模、佔有率和成長分析 - 2025-2032 年行業預測
 矽肥市場:預測(2025-2030 年)
 膠囊肥料市場依營養成分、釋放機制、作物用途及地區分類
 化肥市場按產品類型、作物類型、包裝、施用方法、最終用戶和分銷管道分類-2025-2032年全球預測化肥市場:2025-2032年全球預測(依類型、形態、用途及通路分類)
▼