


 |
市場調查報告書
商品編碼
1693527
北美控制釋放肥料:市場佔有率分析、產業趨勢與成長預測(2025-2030 年)North America Controlled Release Fertilizer - Market Share Analysis, Industry Trends & Statistics, Growth Forecasts (2025 - 2030) |
||||||
※ 本網頁內容可能與最新版本有所差異。詳細情況請與我們聯繫。
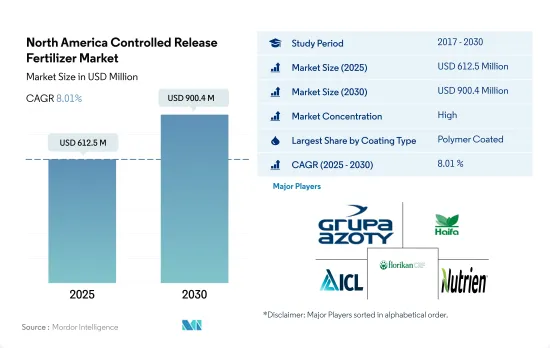
北美控制釋放肥料市場規模預計在 2025 年為 6.125 億美元,預計到 2030 年將達到 9.004 億美元,預測期內(2025-2030 年)的複合年成長率為 8.01%。
確保人們在正確的時間獲得適量的營養的努力正在推動該地區擴大採用 CRF。
- 2017 年至 2022 年,北美控制釋放肥料市場以 15.0% 的複合年成長率成長。精密農業是該地區廣泛接受的方法,優先考慮及時且準確地為作物提供營養。其中,控制釋放肥料發揮至關重要的作用,確保作物獲得最佳養分,成為精密農業的重要組成部分。
- 2022年,田間作物佔據北美控制釋放肥市場的主導地位,佔據88.4%的市場佔有率。園藝作物佔3.7%。控制釋放肥料廣泛應用於穀物、穀類、蔬菜、果園和苗圃等高價值作物。專用化學肥料在連續作物中的使用尚未普及,但由於糧食價格上漲、人們對環境問題的日益關注以及對營養施用的監管越來越嚴格,其使用正在逐漸增加。
- 2022年,美國在控制釋放肥料消費量方面處於領先地位,佔比達69.9%。這項優點源自於國家對養分施用和防止肥料污染的規定。
- 美國環保署 (EPA) 和美國農業部 (USDA) 正在與肥料實驗室 (TFI)、國際肥料開發中心 (IFDC)、大自然保護協會 (TNC) 和全國玉米種植者協會 (NCGA) 等主要相關人員合作,以認知肥料行業的技術發展。他們的目標是提高農民對控制釋放肥料的認知,並對該國的大田作物生產產生積極的溢出效應。
對過度使用化學肥料和主要作物減少氮肥使用的環境擔憂可能會推動 CRF 市場的發展。
- 2022年,美國佔了CRF市場的69.9%。研究期間的複合年成長率為14.0%。聚合物塗料佔據領先地位,到 2022 年將佔據 76.4% 的佔有率。美國約 69% 的土地種植田間作物,包括大麥、玉米、棉花、燕麥、花生、高粱、大豆和小麥。由於這些作物對氮的需求量大,以氮效率高而聞名的聚合物包膜尿素的使用正在增加,進一步提高了聚合物包膜肥料的市場佔有率。
- 在加拿大,小麥、菜籽和玉米等田間作物的種植面積正在迅速增加。為了支持這一趨勢,加拿大政府透過加拿大農業信貸等舉措,增加農民的信貸機會,特別是為控制釋放肥料等投入提供融資。這種有利的環境將在未來幾年推動加拿大控制釋放肥料市場的發展。
- 2021年,墨西哥國會在2022年聯邦預算中核准了農業和農村發展部(SADER)27億美元的預算。其中約70%的撥款用於化肥補貼。預計這將成為墨西哥控制釋放肥料市場的主要推手。
- 在北美其他地區,精密農業的推動和應對氣候變遷的努力正在推動控制釋放肥料的採用激增。這些措施解決了環境問題並促進了永續的農業實踐。
- 全部區域都迫切需要提高田間作物的產量,再加上政府的強力舉措和農民意識的不斷提高,為未來幾年光明的市場前景奠定了基礎。
北美控制釋放肥料市場趨勢
補貼和其他政府財政支持有助於擴大田間作物
- 北美的農場種植多種作物,以田間作物為主。玉米、棉花、水稻、大豆和小麥是該地區的主要田間作物。美國、加拿大和墨西哥對該地區的農業生產貢獻巨大。 2022 年,田間作物約佔北美總種植面積的 97.6%,其中穀物和油籽佔據市場主導地位。
- 從國家來看,美國佔據市場主導地位,研究期間的作物總種植面積為 1.357 億公頃。其中,大田作物和園藝佔了大部分面積,2022年分別佔97.2%和2.8%。然而,2018年至2019年間,該國作物面積大幅下降,主要原因是不利的環境條件導致德克薩斯和休士頓等地區發生嚴重洪澇災害。
- 最大的栽培作物是玉米,大部分種植在美國中西部傳統上被稱為「玉米帶」的地區,該地區涵蓋印第安納州西部、伊利諾伊州、愛荷華州、密蘇裡州、內布拉斯加州東部和堪薩斯州東部的大部分地區,玉米和大豆是主要作物。該地區也是米的主要出口區,水稻種植主要集中在四個地區:因此,隨著該地區田間作物市場潛力的增加以及政府資金投入和保護的增加,該地區田間作物種植面積預計會增加。
在主要營養元素中,氮肥在田間作物中的應用更為頻繁。
- 水稻、玉米、小麥和油菜籽等田間作物是該地區主要的作物消耗作物。 2022 年,水稻將消耗約 140.85 公斤/公頃的主要養分,其次是油菜籽/油菜籽,消耗 118.40 公斤/公頃的主要養分。預計穀物將消耗最多的氮肥。由於該地區的集約化耕作,土壤養分耗盡,需要大量肥料來補充生長。
- 主要養分中,氮肥施用量最大,2022年約佔74.0%,相當於田間作物229.8公斤/公頃。然而,氮缺乏是該地區最常見的作物營養問題之一。因此,大部分的氮供應是透過土壤施用提供。當施入土壤時,氮會轉化為礦物質硝酸鹽,以便植物輕鬆吸收。油菜籽是一種主要的氮消耗作物,在美國廣泛種植。
- 油菜籽可用於提取潤滑油、液壓油和塑膠等工業用油。施肥率取決於土壤品質和降雨量,但氮需求量為每英畝 100 至 150 磅。磷肥和鉀肥的施用量也因土壤而異。然而,根據 AgMRC 的建議施用量為每英畝 0-80 磅和每英畝 0-140 磅。
- 由於初級養分是各種作物養分的主要來源,由於土壤貧化和淋溶,其施用量預計將逐年大幅增加。
北美控制釋放肥料產業概況
北美控制釋放肥料市場相當集中,前五大公司佔據了88.15%的市場。市場的主要企業包括 Grupa Azoty SA (Compo Expert)、Haifa Group、ICL Group Ltd、New Mountain Capital (Florikan) 和 Nutrien Ltd。
其他福利
- Excel 格式的市場預測 (ME) 表
- 3個月的分析師支持
目錄
第1章執行摘要和主要發現
第2章 報告要約
第3章 引言
- 研究假設和市場定義
- 研究範圍
- 調查方法
第4章 產業主要趨勢
- 主要作物種植面積
- 田間作物
- 園藝作物
- 平均養分施用量
- 主要營養素
- 田間作物
- 園藝作物
- 主要營養素
- 法律規範
- 價值鍊和通路分析
第5章市場區隔
- 塗層類型
- 聚合物塗層
- 聚合物硫塗層
- 其他
- 作物類型
- 田間作物
- 園藝作物
- 草坪和觀賞植物
- 原產地
- 加拿大
- 墨西哥
- 美國
- 北美其他地區
第6章競爭格局
- 關鍵策略趨勢
- 市場佔有率分析
- 商業狀況
- 公司簡介
- AgroLiquid
- Grupa Azoty SA(Compo Expert)
- Haifa Group
- ICL Group Ltd
- New Mountain Capital(Florikan)
- Nutrien Ltd.
第7章 CEO 的關鍵策略問題
第 8 章 附錄
- 世界概況
- 概述
- 五力分析框架
- 全球價值鏈分析
- 市場動態(DRO)
- 資訊來源及延伸閱讀
- 圖片列表
- 關鍵見解
- 數據包
- 詞彙表
The North America Controlled Release Fertilizer Market size is estimated at 612.5 million USD in 2025, and is expected to reach 900.4 million USD by 2030, growing at a CAGR of 8.01% during the forecast period (2025-2030).
Initiatives toward achieving right amount of nutrients at the right time will increase the CRFs adoption in the region
- Between 2017 and 2022, the North American controlled-release fertilizers market witnessed a CAGR of 15.0%. Precision farming, a widely embraced approach in the region, prioritizes timely and precise nutrient delivery to crops. Controlled-release fertilizers, in this context, assume a pivotal role, ensuring crops receive optimal nutrient dosages, thus becoming integral to precision farming.
- In 2022, field crops dominated the North American controlled-release fertilizers market, capturing 88.4% of the market share. Horticultural crops accounted for 3.7%. Controlled-release fertilizers found extensive usage in high-value crops like cereals, grains, vegetables, orchards, and nurseries. While specialty chemical adoption in row crops is not yet widespread, it is gradually rising due to surging grain prices, heightened environmental concerns, and stricter nutrient application regulations.
- In 2022, the United States led the consumption of controlled-release fertilizers, accounting for 69.9%. This dominance can be attributed to the nation's regulations governing nutrient application rates and fertilizer pollution control.
- Recognizing the technological strides in the fertilizer industry, the Environmental Protection Agency (EPA) and the US Department of Agriculture (USDA) have collaborated with key stakeholders like The Fertilizer Institute (TFI), the International Fertilizer Development Center (IFDC), The Nature Conservancy (TNC), and the National Corn Growers Association (NCGA). Their collective aim is to raise awareness about controlled-release fertilizers among farmers, with a positive ripple effect anticipated on the country's field crop production.
Environmental concerns about excessive use of fertilizers and reduced nitrogen use by major crops may drive the CRF market
- In 2022, the United States recorded a 69.9% share of the CRF market. The market grew by a CAGR of 14.0% during the study period. Polymer coating emerged as the leader, commanding a 76.4% share in 2022. Around 69% of the US cropland is dedicated to field crops, including barley, corn, cotton, oats, peanuts, sorghum, soybeans, and wheat. Given the high nitrogen requirements of these crops, the adoption of polymer-coated urea, known for its nitrogen efficiency, is on the rise, further bolstering the market share of polymer-coated fertilizers.
- Canada is witnessing a surge in the cultivation of field crops like wheat, canola, and maize. To support this trend, the Canadian government, through initiatives like Farm Credit Canada, is facilitating increased credit accessibility for farmers, specifically for inputs like controlled-release fertilizers. This favorable environment is poised to propel the controlled-release fertilizer market in Canada in the coming years.
- In 2021, the Mexican legislature approved a USD 2.70 billion budget for the Secretariat of Agriculture and Rural Development (SADER) in its 2022 Federal Government Budget. Around 70% of this allocation was earmarked for fertilizer subsidies. This is expected to be a key driver for the controlled-release fertilizer market in Mexico.
- The Rest of North America is witnessing a surge in the adoption of controlled-release fertilizers driven by the push for precision agriculture practices and climate-smart initiatives. These measures address environmental concerns and promote sustainable farming practices.
- Across the region, the imperative to boost field crop production, coupled with robust government initiatives and growing farmer awareness, sets the stage for a promising market outlook in the coming years.
North America Controlled Release Fertilizer Market Trends
The financial support by the government such as subsidies has contributed to the expansion of field crops
- A wide array of crops are grown on North American farms, mainly covering field crops. Corn, Cotton, Rice, Soybean, and Wheat are some of the dominating field crops across the region. The United States, Canada, and Mexico are major contributors to the region's agricultural output. In 2022, field crops covered around 97.6% of the overall cultivation in North America, with cereals and oilseeds dominating the market.
- By country, the United States dominates the market, covering 135.7 million hectares of the overall area under crop cultivation during the study period. Among them, field crops and horticulture are covering the majority of the area and accounted for 97.2% and 2.8% in 2022. However, between 2018-2019, the country witnessed a significant dip in crop acreages which is majorly due to unfavorable environmental conditions resulting in heavy floods in areas like Texas and Houston.
- The largest crop cultivated is corn, the majority of which is grown in a region known as the 'Corn Belt' traditional area in the midwestern United States, roughly covering western Indiana, Illinois, Iowa, Missouri, eastern Nebraska, and eastern Kansas, in which corn (maize) and soybeans are the dominant crops. Also, It is the major rice exporter, and the rice cultivation in the region is mainly concentrated within 4 regions with three in the South and one in California. Therefore, the increased market potential for the region's field crop, coupled with the increased government funding and protection is anticipated to positively drive the area under field crop cultivation in the region.
Among all the primary nutrients, nitrogen is applied in a higher quantity for field crops
- Field crops, such as rice, corn/maize, wheat, and rapeseed/canola, are some of the major primary nutrient-consuming crops in the region. In 2022, about 140.85 kg/hectare of primary nutrients were consumed by rice, followed by 118.40 kg/hectare consumed by rapeseed/canola. Cereals are anticipated to consume the maximum amount of nitrogen fertilizer. As they are grown intensively in the region, they deplete the nutrients in the soil and require more fertilizers to supplement growth.
- Among all the primary nutrients, nitrogen is applied in a higher quantity, accounting for about 74.0% in 2022, equivalent to 229.8 kg/hectare for field crops. Nitrogen deficiency, however, is one of the most prevalent crop nutrient problems in the region. Hence, most of the nitrogen supplement is provided through soil application. When applied to the soil, nitrogen is converted to mineral nitrate for the plants to absorb easily. Rapeseed, the major nitrogen-consuming crop, is widely grown in the United States.
- Rapeseed is used for extracting oil for industrial applications, like lubricants, hydraulic fluids, and plastics. While fertilizer usage is based on soil quality and rainfall potential, its nitrogen requirements range from 100 to 150 lbs/acre. Phosphorus and potassium fertility rates also vary from soil to soil. However, the recommended rates range from 0 to 80 lbs/acre and 0 to 140 lbs/acre, as per the AgMRC.
- Since primary nutrients are the major sources of nutrients for various crops, their application rates are anticipated to grow significantly over the years due to soil depletion, leaching, etc.
North America Controlled Release Fertilizer Industry Overview
The North America Controlled Release Fertilizer Market is fairly consolidated, with the top five companies occupying 88.15%. The major players in this market are Grupa Azoty S.A. (Compo Expert), Haifa Group, ICL Group Ltd, New Mountain Capital (Florikan) and Nutrien Ltd. (sorted alphabetically).
Additional Benefits:
- The market estimate (ME) sheet in Excel format
- 3 months of analyst support
TABLE OF CONTENTS
1 EXECUTIVE SUMMARY & KEY FINDINGS
2 REPORT OFFERS
3 INTRODUCTION
- 3.1 Study Assumptions & Market Definition
- 3.2 Scope of the Study
- 3.3 Research Methodology
4 KEY INDUSTRY TRENDS
- 4.1 Acreage Of Major Crop Types
- 4.1.1 Field Crops
- 4.1.2 Horticultural Crops
- 4.2 Average Nutrient Application Rates
- 4.2.1 Primary Nutrients
- 4.2.1.1 Field Crops
- 4.2.1.2 Horticultural Crops
- 4.2.1 Primary Nutrients
- 4.3 Regulatory Framework
- 4.4 Value Chain & Distribution Channel Analysis
5 MARKET SEGMENTATION (includes market size in Value in USD and Volume, Forecasts up to 2030 and analysis of growth prospects)
- 5.1 Coating Type
- 5.1.1 Polymer Coated
- 5.1.2 Polymer-Sulfur Coated
- 5.1.3 Others
- 5.2 Crop Type
- 5.2.1 Field Crops
- 5.2.2 Horticultural Crops
- 5.2.3 Turf & Ornamental
- 5.3 Country
- 5.3.1 Canada
- 5.3.2 Mexico
- 5.3.3 United States
- 5.3.4 Rest of North America
6 COMPETITIVE LANDSCAPE
- 6.1 Key Strategic Moves
- 6.2 Market Share Analysis
- 6.3 Company Landscape
- 6.4 Company Profiles
- 6.4.1 AgroLiquid
- 6.4.2 Grupa Azoty S.A. (Compo Expert)
- 6.4.3 Haifa Group
- 6.4.4 ICL Group Ltd
- 6.4.5 New Mountain Capital (Florikan)
- 6.4.6 Nutrien Ltd.
7 KEY STRATEGIC QUESTIONS FOR FERTILIZER CEOS
8 APPENDIX
- 8.1 Global Overview
- 8.1.1 Overview
- 8.1.2 Porter's Five Forces Framework
- 8.1.3 Global Value Chain Analysis
- 8.1.4 Market Dynamics (DROs)
- 8.2 Sources & References
- 8.3 List of Tables & Figures
- 8.4 Primary Insights
- 8.5 Data Pack
- 8.6 Glossary of Terms
 控釋肥料市場-全球產業規模、佔有率、趨勢、機會和預測,按類型、最終用途、應用方式、地區和競爭格局分類,2020-2030年預測
 全球控釋肥料(CRF)市場按類型、功能、產品等級、應用方法、最終用途和地區分類-預測至2030年
 緩釋性肥市場按包覆類型、作物類型、釋放期、養分類型、應用、最終用途和銷售管道分類-2025-2032 年全球預測包衣肥料市場-全球產業規模、佔有率、趨勢、機會和預測(按類型、作物類型、地區和競爭情況分類,2020-2030 年)控制釋放液態氮市場按產品類型、包衣類型、形態、釋放機制、施用方法、作物類型、最終用戶和分銷管道分類 - 全球預測 2025-2030
 全球硝化抑制劑及尿素酶抑制劑市場分析及預測(至2032年):依產品類型、營養類型、作物類型、施用方法、通路、最終用戶及地區分類
 2025年全球控制釋放肥市場報告
 2025-2033年控釋肥料市場(按類型、形式、應用和地區)報告
 硝化抑制劑及脲酶抑制劑市場機會、成長動力、產業趨勢分析及 2025 - 2034 年預測2032 年控制釋放和緩釋性肥市場預測:按類型、作物類型、應用類型和地區分類的全球分析