


 |
市場調查報告書
商品編碼
1693502
美國控制釋放肥料:市場佔有率分析、產業趨勢與統計、成長預測(2025-2030)United States Controlled Release Fertilizer - Market Share Analysis, Industry Trends & Statistics, Growth Forecasts (2025 - 2030) |
||||||
※ 本網頁內容可能與最新版本有所差異。詳細情況請與我們聯繫。
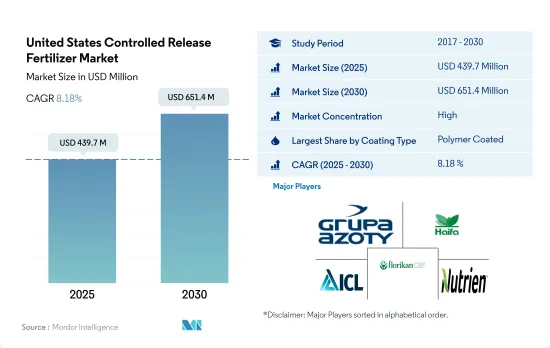
美國控制釋放肥料市場規模預計在 2025 年為 4.397 億美元,預計到 2030 年將達到 6.514 億美元,預測期內(2025-2030 年)的複合年成長率為 8.18%。
CRF 在減少氮和磷浸出方面的效率推動了市場成長
- 預計 2022 年美國控制釋放肥料市場規模將達 4.287 億美元。農業部門減少環境影響的壓力越來越大,再加上養分效率提高和精準施肥的好處,預計將推動市場價值在 2023 年至 2030 年期間以 8.0% 的複合年成長率強勁成長。
- 控制釋放肥料可逐漸延長釋放養分,確保作物在整個生長週期中穩定供應關鍵元素。透過減少養分的淋失和流失,這些肥料在減少田間農業對環境的影響方面發揮著至關重要的作用,特別是在解決水質和污染問題方面。
- 田間試驗顯示,包膜控制釋放肥料的效果優於未包膜肥料,氮基肥料的淋溶減少 69.0%,磷基肥料的淋溶減少 82.0%。相較之下,未包覆的傳統尿素會因揮發而損失高達 40% 的氨含量。經過多年的廣泛測試,一致證明包膜尿素可以減少至少 95.0% 的氨損失。
- 2022年,聚合物塗層將主導美國控制釋放肥料市場,佔76.4%的市場。環境和成本考量正在推動對聚合物包膜控制釋放肥料的需求。預計 2023 年至 2030 年期間聚合物塗料領域將以 7.7% 的健康速度成長。
- 在美國,由於政府推出了旨在控制肥料過度累積對環境影響的法規,控制釋放肥料的需求激增。
美國控制釋放肥料市場趨勢
大豆和玉米是美國種植面積最大的兩種作物。
- 在美國,人口將從2020年的3.359億增加到2022年的3.382億。自2000年以來,耕地總面積減少了近5,000萬英畝,到2022年達到8.934億英畝。有限的農業用地表明需要透過使用農業投入來提高農業生產力。人們長期以來一直使用肥料來提高作物的產量。美國四大主要作物為玉米、棉花、大豆和小麥,2022年這四大農作物種植面積將佔主要作物面積的65.7%以上。
- 大豆和玉米是美國種植面積最大的兩種作物。 2022年,大豆種植面積最大,占美國耕地總面積的25.8%,其次是玉米,佔25.7%,小麥佔11.1%。這些作物大部分生長在被稱為「玉米帶」的地區,該地區涵蓋印第安納州西部、伊利諾伊州、愛荷華州、密蘇裡州、內布拉斯加州東部和堪薩斯州東部。該地區主要產玉米和大豆。根據美國農業部的數據,美國是主要的米出口國,其主要種植區有四個地區:
- 農業供應製造商正在開發創新產品,幫助農民精準施肥。這使得農民能夠降低種植成本,同時提高效率。該國的大田作物產業擁有巨大的市場潛力,隨著政府資金和支持的增加,預計該作物種植領域將實現積極成長。
氮缺乏是美國作物最普遍的營養問題之一。
- 2022年美國田間作物主要養分(氮、鉀、磷)平均施用量約為每公頃166.61公斤,其中氮佔45.93%,其次是鉀佔28.11%,磷佔25.96%。
- 在田間作物中,油菜籽/油菜籽表現突出,2022 年平均主要養分施用量為每公頃 284.92 公斤,為該領域最高。在主要養分中,氮肥施用量最高,平均施用量為每公頃 229.60 公斤。這一優勢是由於氮在植物代謝中發揮的重要作用,因為它是葉綠素和氨基酸的關鍵成分。
- 在美國,玉米是第二田間作物,緊隨其後的是油菜籽。 2022年,農民平均每公頃施用245.40公斤主要養分。光是玉米就佔全國田間作物總產量的約31.44%。在主要養分施用方面,2022年玉米氮需求量為50.06%,磷需求量為23.77%,鉀需求量為26.17%。
- 主要營養素在增強植物的酵素功能、細胞生長和生化過程方面發揮著至關重要的作用。這些營養物質的缺乏會對植物健康產生重大影響,阻礙其生長並降低作物產量。由於提高生產力的需求不斷增加,田間作物主要營養物質的施用量預計將大幅增加。
美國控制釋放肥料產業概況
美國控制釋放肥料市場相當集中,前五大公司佔了89.58%的市佔率。市場的主要企業有:Grupa Azoty SA (Compo Expert)、Haifa Group、ICL Group Ltd、New Mountain Capital (Florikan) 和 Nutrien Ltd.(按字母順序排列)
其他福利
- Excel 格式的市場預測 (ME) 表
- 3個月的分析師支持
目錄
第1章執行摘要和主要發現
第2章 報告要約
第3章 引言
- 研究假設和市場定義
- 研究範圍
- 調查方法
第4章 產業主要趨勢
- 主要作物種植面積
- 田間作物
- 園藝作物
- 平均養分施用量
- 主要營養素
- 田間作物
- 園藝作物
- 主要營養素
- 法律規範
- 價值鍊和通路分析
第5章市場區隔
- 塗層類型
- 聚合物塗層
- 聚合物硫塗層
- 其他
- 作物類型
- 田間作物
- 園藝作物
- 草坪和觀賞植物
第6章競爭格局
- 關鍵策略趨勢
- 市場佔有率分析
- 商業狀況
- 公司簡介
- AgroLiquid
- Grupa Azoty SA(Compo Expert)
- Haifa Group
- ICL Group Ltd
- New Mountain Capital(Florikan)
- Nutrien Ltd.
第7章:CEO面臨的關鍵策略問題
第 8 章 附錄
- 世界概況
- 概述
- 五力分析框架
- 全球價值鏈分析
- 市場動態(DRO)
- 資訊來源及延伸閱讀
- 圖片列表
- 關鍵見解
- 資料包
- 詞彙表
The United States Controlled Release Fertilizer Market size is estimated at 439.7 million USD in 2025, and is expected to reach 651.4 million USD by 2030, growing at a CAGR of 8.18% during the forecast period (2025-2030).
The efficiency of CRFs in reducing nitrogen and phosphorus leaching propels market growth
- The market for controlled-release fertilizers in the United States was valued at USD 428.7 million in 2022. With mounting pressure on the agriculture sector to mitigate environmental repercussions, coupled with the benefits of enhanced nutrient efficiency and precise application, the market value is projected to witness a robust CAGR of 8.0% from 2023 to 2030.
- Controlled-release fertilizers offer a gradual and prolonged nutrient release, ensuring crops receive a consistent supply of vital elements throughout their growth cycle. By curbing nutrient leaching and runoff, these fertilizers play a pivotal role in reducing the environmental impact of field crop agriculture, particularly in addressing concerns about water quality and pollution.
- Field trials have shown that coated controlled-release fertilizers outperform their uncoated counterparts, reducing leaching by 69.0% for nitrogen-based fertilizers and 82.0% for phosphate-based ones. In contrast, uncoated conventional urea can lose up to 40% of its ammonia content through volatilization. Extensive testing over multiple years has consistently demonstrated that coated urea can slash ammonia losses by a minimum of 95.0%.
- In 2022, polymer coating dominated the United States controlled-release fertilizer market, accounting for 76.4% of the industry. Environmental and cost considerations are driving the demand for polymer-coated controlled-release fertilizers, thanks to the nation's focus on field crop cultivation. The polymer-coated segment is expected to witness a healthy growth rate of 7.7% from 2023 to 2030.
- The United States is witnessing a surge in demand for controlled-release fertilizers, propelled by government regulations aimed at curbing the environmental impact stemming from excessive fertilizer accumulation.
United States Controlled Release Fertilizer Market Trends
Soybean and corn are the two prominent crops grown in the United States
- In the United States, the population increased from 335.9 million in 2020 to 338.2 million in 2022. From 2000 onwards, the total farmland area decreased by almost 50 million acres, reaching a total of 893.4 million acres in 2022. The limited farmland indicates the need to increase agricultural productivity with the use of agri inputs. Fertilizers have been used for a long time to increase the productivity of crops. The four major crops in the United States are corn, cotton, soybean, and wheat, which account for more than 65.7% of the principal crop acreage in 2022.
- Soybean and corn are the two prominent crops grown in the United States. In 2022, soybean had the highest area under cultivation, accounting for 25.8% of the total arable land in the United States, followed by corn at 25.7% and wheat at 11.1%. The majority of these crops are grown in a region known as the "Corn Belt," which covers Western Indiana, Illinois, Iowa, Missouri, Eastern Nebraska, and Eastern Kansas. The production of corn (maize) and soybeans dominates this area. Additionally, the United States is a major exporter of rice, with most of the cultivation happening in four regions, three of which are in the South and one in California, according to the USDA.
- Manufacturers of farm inputs are developing innovative products to assist farmers with the precise application of fertilizers. This is helping farmers in reducing the cost of cultivation while increasing efficiency. The field crop industry of the country has immense market potential, and with increased government funding and support, it is expected to drive positive growth in crop cultivation in this area.
Nitrogen deficiency is one of the most prevalent crop nutrient problems across cropping areas in the United States
- The average application rate of primary nutrients (nitrogen, potassium, and phosphorus) in field crops in the United States stood at approximately 166.61 kg per hectare in the year 2022. Nitrogen represented 45.93% of this application, followed by potassium at 28.11% and phosphorus at 25.96% in the same year.
- Rapeseed/canola stands out among field crops, with an average primary nutrient application rate of 284.92 kg per hectare, the highest in this sector in 2022. Among the primary nutrients, nitrogen takes the lead, with an average application rate of 229.60 kg per hectare. This dominance can be attributed to nitrogen's pivotal role in plant metabolism, as it is a key component of both chlorophyll and amino acids.
- In the United States, corn/maize stands as the second-largest field crop, with rapeseed/canola following closely behind. On average, farmers applied 245.40 kg of primary nutrients per hectare in 2022. Corn alone contributes to around 31.44% of the nation's total field crop production. When it came to primary nutrient application, corn's nitrogen requirement accounted for 50.06%, phosphorus stood at 23.77%, and potash at 26.17% in 2022.
- Primary nutrients play a pivotal role in enhancing plant enzyme function, cellular growth, and biochemical processes. A deficiency in these nutrients can significantly impact plant health, stifle growth, and hamper crop yields. Given the rising need for increased productivity, the application of primary nutrients in field crops is expected to witness a notable uptick.
United States Controlled Release Fertilizer Industry Overview
The United States Controlled Release Fertilizer Market is fairly consolidated, with the top five companies occupying 89.58%. The major players in this market are Grupa Azoty S.A. (Compo Expert), Haifa Group, ICL Group Ltd, New Mountain Capital (Florikan) and Nutrien Ltd. (sorted alphabetically).
Additional Benefits:
- The market estimate (ME) sheet in Excel format
- 3 months of analyst support
TABLE OF CONTENTS
1 EXECUTIVE SUMMARY & KEY FINDINGS
2 REPORT OFFERS
3 INTRODUCTION
- 3.1 Study Assumptions & Market Definition
- 3.2 Scope of the Study
- 3.3 Research Methodology
4 KEY INDUSTRY TRENDS
- 4.1 Acreage Of Major Crop Types
- 4.1.1 Field Crops
- 4.1.2 Horticultural Crops
- 4.2 Average Nutrient Application Rates
- 4.2.1 Primary Nutrients
- 4.2.1.1 Field Crops
- 4.2.1.2 Horticultural Crops
- 4.2.1 Primary Nutrients
- 4.3 Regulatory Framework
- 4.4 Value Chain & Distribution Channel Analysis
5 MARKET SEGMENTATION (includes market size in Value in USD and Volume, Forecasts up to 2030 and analysis of growth prospects)
- 5.1 Coating Type
- 5.1.1 Polymer Coated
- 5.1.2 Polymer-Sulfur Coated
- 5.1.3 Others
- 5.2 Crop Type
- 5.2.1 Field Crops
- 5.2.2 Horticultural Crops
- 5.2.3 Turf & Ornamental
6 COMPETITIVE LANDSCAPE
- 6.1 Key Strategic Moves
- 6.2 Market Share Analysis
- 6.3 Company Landscape
- 6.4 Company Profiles
- 6.4.1 AgroLiquid
- 6.4.2 Grupa Azoty S.A. (Compo Expert)
- 6.4.3 Haifa Group
- 6.4.4 ICL Group Ltd
- 6.4.5 New Mountain Capital (Florikan)
- 6.4.6 Nutrien Ltd.
7 KEY STRATEGIC QUESTIONS FOR FERTILIZER CEOS
8 APPENDIX
- 8.1 Global Overview
- 8.1.1 Overview
- 8.1.2 Porter's Five Forces Framework
- 8.1.3 Global Value Chain Analysis
- 8.1.4 Market Dynamics (DROs)
- 8.2 Sources & References
- 8.3 List of Tables & Figures
- 8.4 Primary Insights
- 8.5 Data Pack
- 8.6 Glossary of Terms
 控釋肥料市場-全球產業規模、佔有率、趨勢、機會和預測,按類型、最終用途、應用方式、地區和競爭格局分類,2020-2030年預測
 全球控釋肥料(CRF)市場按類型、功能、產品等級、應用方法、最終用途和地區分類-預測至2030年
 緩釋性肥市場按包覆類型、作物類型、釋放期、養分類型、應用、最終用途和銷售管道分類-2025-2032 年全球預測包衣肥料市場-全球產業規模、佔有率、趨勢、機會和預測(按類型、作物類型、地區和競爭情況分類,2020-2030 年)控制釋放液態氮市場按產品類型、包衣類型、形態、釋放機制、施用方法、作物類型、最終用戶和分銷管道分類 - 全球預測 2025-2030
 全球硝化抑制劑及尿素酶抑制劑市場分析及預測(至2032年):依產品類型、營養類型、作物類型、施用方法、通路、最終用戶及地區分類
 2025年全球控制釋放肥市場報告
 2025-2033年控釋肥料市場(按類型、形式、應用和地區)報告
 硝化抑制劑及脲酶抑制劑市場機會、成長動力、產業趨勢分析及 2025 - 2034 年預測2032 年控制釋放和緩釋性肥市場預測:按類型、作物類型、應用類型和地區分類的全球分析