


 |
市場調查報告書
商品編碼
1692575
EVA 黏合劑:市場佔有率分析、產業趨勢和統計數據、成長預測(2025-2030 年)EVA Adhesives - Market Share Analysis, Industry Trends & Statistics, Growth Forecasts (2025 - 2030) |
||||||
價格
※ 本網頁內容可能與最新版本有所差異。詳細情況請與我們聯繫。
簡介目錄
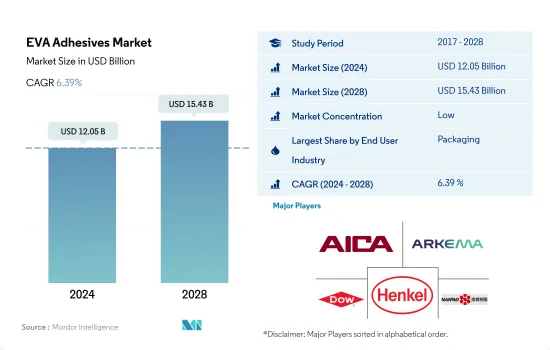
EVA 黏合劑市場規模預計在 2024 年為 120.5 億美元,預計到 2028 年將達到 154.3 億美元,預測期內(2024-2028 年)的複合年成長率為 6.39%。
雖然醫療保健是成長最快的終端用戶,但包裝仍處於領先地位
- EVA 黏合劑在全球範圍內應用於各種終端用戶行業,包括包裝、汽車、木工和細木工、建築和施工等。這些黏合劑可以黏合紙張、木材、塑膠、橡膠、金屬和皮革等基材。這些黏合劑的主要應用包括紙/紙板盒、包裝標籤、紙箱密封、組裝、汽車內裝和紙張加工。
- 2017 年至 2019 年,全球對 EVA 黏合劑的需求大幅成長。北美的木工和細木工行業在所有終端用戶行業中需求成長最高(複合年成長率為 9.00%)。家具產品進口關稅的提高帶動了國內木工產業的成長。
- 2020年,由於營運和貿易限制、供應鏈限制和勞動力短缺等各種因素,所有終端用戶產業對 EVA 黏合劑的需求均下降。汽車產業需求受創最嚴重,與前一年同期比較14.72%。旅行活動減少、原料短缺以及其他各種因素導致了這一下降。隨著限制措施的放寬,全球 EVA 黏合劑需求預計將在 2021 年迅速上升至疫情前的水平。
- 預計這一成長趨勢將在預測期內持續下去。從數量上看,預測期內所有終端用戶行業對 EVA 黏合劑的需求預計將以 4.32% 的複合年成長率成長。包裝行業佔據了最大的需求佔有率,因為該行業更喜歡具有快速固化特性的 EVA 黏合劑。預計在預測期內該產業仍將是最大的終端用戶。
全球建築和汽車行業的成長推動了對 EVA 黏合劑的需求
- 由於擁有眾多建築和包裝活動、汽車、醫療設備、航太生產能力和其他成熟的終端用戶產業,亞太地區在整個研究期間佔據了 EVA 樹脂基黏合劑需求的最大佔有率。中國是全球最大的建築和汽車市場,滿足了亞太地區高達58%的需求。
- 2017年至2019年,由於歐洲和亞太地區成長放緩,EVA樹脂基黏合劑的需求停滯不前。由於全球主要終端用戶產業、建築業和汽車業的需求下降,2018 年和 2019 年 EVA 黏合劑的整體成長率與前一年相比僅限於約 3%(基於銷售)。
- 2020年,新冠疫情導致所有終端用戶產業對EVA膠合劑的需求下降。在德國、俄羅斯、南非和巴西等一些國家,建設活動被視為必不可少的活動,並允許在疫情期間進行。這些因素減輕了全球影響,限制了 2020 年 EVA 黏合劑的降幅與 2019 年相比約為 6.75%(以體積為基礎)。
- 由於美國、澳洲、歐盟國家和其他地方的紓困措施和支持計劃,需求將在 2021 年開始復甦,預計這一成長趨勢將在整個預測期內持續下去。預計歐洲、南美和亞太國家增加的投資和預算分配將推動這一成長。
全球EVA膠黏劑市場趨勢
開發中國家電子商務的快速成長將推動產業擴張
- 2020 年伊始,包裝產業出現了幾個長期趨勢,推動需求成長。隨著經濟活動轉向應對 COVID-19 疫情帶來的挑戰,包裝產業成長加速。該行業的強勁表現得益於食品飲料和醫療保健等主要終端市場的收益成長和擴張,同時也顯示了該行業在更廣泛的經濟不確定時期的整體穩定性。
- 2021 年,由於買家和賣家在疫情導致交易幾乎停滯之後急切地重返市場,包裝行業的併購活動激增。疫情期間包裝公司的強勁表現強化了這樣一種觀念:包裝產業在整體市場動盪期間提供了穩定性。疫情也增強了現有的順風因素,例如電子商務的快速擴張以及品牌所有者採用包裝來在超級市場貨架上區分其產品,為該行業更強勁的長期成長奠定了基礎。
- 截至目前,可溶解包裝、節省空間包裝和智慧包裝是包裝產業出現的一些創新。採用可食用包裝是一種有趣且創新的替代方案,它有可能減少對石化燃料的依賴並顯著減少碳足跡,並且由於其永續性而在整個食品行業中變得越來越普遍。這些因素為食品和飲料領域的包裝產業創造了成長機會,並有望在預測期內推動包裝產業的成長。
政府推行的電動車優惠政策將推動汽車產業
- 預計2021年後全球汽車產業將穩定成長,但隨著消費者對個人汽車所有權的偏好下降並越來越偏好共用出行方式,成長速度正在放緩。預計預測期內全球汽車產業將以每年 2% 的速度成長,總收益增加價值將達到 1.5 兆美元。
- 2020年,受新冠疫情影響,汽車銷量下滑,但2021年卻迅速回升。汽車市場通常對GDP貢獻巨大,因此世界各國政府紛紛推出措施支持經濟。汽車銷量從2019年的9000萬輛下降到2020年的7800萬輛。
- 由於電動車能源成本低廉、環境友善且移動性高效,其在全球範圍內的普及對全球汽車市場的總收益做出了重大貢獻。各種政府政策和標準也在推動電動車產量的成長。例如,歐盟二氧化碳排放標準在2021年增加了對電動車的需求。根據國際能源總署的永續情景,到2030年將需要2.3億輛電動車取代燃油汽車。 2021年,最大的電動車製造商特斯拉的電動車產量增加了157%。預計預測期內(2022-2028 年),消費者對電動車的偏好將進一步成長。
EVA膠黏劑產業概況
EVA膠黏劑市場分散,前五大公司佔9.33%的市佔率。該市場的主要企業有:愛克工業、阿科瑪集團、陶氏化學、漢高股份公司和南寶樹脂化學集團(按字母順序排列)
其他福利
- Excel 格式的市場預測 (ME) 表
- 3個月的分析師支持
目錄
第1章執行摘要和主要發現
第2章 報告要約
第3章 引言
- 研究假設和市場定義
- 研究範圍
- 調查方法
第4章 產業主要趨勢
- 最終用戶趨勢
- 航太
- 車
- 建築與施工
- 鞋類和皮革
- 包裝
- 木製品和配件
- 法律規範
- 阿根廷
- 澳洲
- 巴西
- 加拿大
- 中國
- EU
- 印度
- 印尼
- 日本
- 馬來西亞
- 墨西哥
- 俄羅斯
- 沙烏地阿拉伯
- 新加坡
- 南非
- 韓國
- 泰國
- 美國
- 價值鍊和通路分析
第5章市場區隔
- 最終用戶產業
- 航太
- 車
- 建築與施工
- 鞋類和皮革
- 衛生保健
- 包裝
- 木製品和配件
- 其他最終用戶產業
- 科技
- 熱熔膠
- 溶劑型
- 水性
- 地區
- 亞太地區
- 澳洲
- 中國
- 印度
- 印尼
- 日本
- 馬來西亞
- 新加坡
- 韓國
- 泰國
- 其他亞太地區
- 歐洲
- 法國
- 德國
- 義大利
- 俄羅斯
- 西班牙
- 英國
- 其他歐洲國家
- 中東和非洲
- 沙烏地阿拉伯
- 南非
- 其他中東和非洲地區
- 北美洲
- 加拿大
- 墨西哥
- 美國
- 北美其他地區
- 南美洲
- 阿根廷
- 巴西
- 南美洲其他地區
- 亞太地區
第6章 競爭格局
- 關鍵策略趨勢
- 市場佔有率分析
- 商業狀況
- 公司簡介
- Aica Kogyo Co..Ltd.
- Arkema Group
- Beardow Adams
- CEMEDINE Co.,Ltd.
- Dow
- Follmann Chemie GmbH
- HB Fuller Company
- Henkel AG & Co. KGaA
- Jowat SE
- KLEBCHEMIE MG Becker GmbH & Co. KG
- NANPAO RESINS CHEMICAL GROUP
- OKONG Corp.
- Paramelt BV
- Selic Corp Public Company Limited.
- Soudal Holding NV
第7章:CEO面臨的關鍵策略問題
第 8 章 附錄
- 全球黏合劑和密封劑產業概況
- 概述
- 五力分析框架(產業吸引力分析)
- 全球價值鏈分析
- 促進因素、限制因素和機會
- 資訊來源及延伸閱讀
- 圖片列表
- 關鍵見解
- 資料包
- 詞彙表
簡介目錄
Product Code: 92412
The EVA Adhesives Market size is estimated at 12.05 billion USD in 2024, and is expected to reach 15.43 billion USD by 2028, growing at a CAGR of 6.39% during the forecast period (2024-2028).
Healthcare is the fastest-growing end-user while packaging remains as pole position
- Globally, EVA adhesives find applications in a range of end-user industries, including packaging, automotive, woodworking and joinery, and building and construction. These adhesives can bond with substrates like paper, wood, plastics, rubbers, metals, and leather. Some major applications of these adhesives are paper/card stock boxes, package labeling, carton sealing, assembly, vehicle interiors, and paper conversion.
- The global demand for EVA adhesives grew significantly from 2017 to 2019. The woodworking and joinery industry in the North American region has witnessed the highest growth (CAGR of 9.00%) in demand among all end-user industries from all regions. Increased import duties on furniture products resulted in growth in the domestic woodworking industry.
- In 2020, the demand for EVA adhesives declined from all end-user industries because of various factors such as operational and trade restrictions, supply chain constraints, labor shortages, and other factors. The demand from the automotive industry suffered the most, declining by 14.72% Y-o-Y. Reduced travel activity, shortage of raw materials, and various other factors have caused this decline. As the restrictions eased, the global EVA adhesives demand quickly rose to pre-pandemic levels in 2021.
- This growth trend is expected to continue during the forecast period. In volume terms, the demand for EVA adhesives from all end-user industries combined is expected to grow, recording a CAGR of 4.32% during the forecast period. The packaging industry favors EVA adhesives because of their fast-curing properties and thus occupies the largest share of the demand. The industry is expected to remain the largest end-user during the forecast period.
Growing construction and automotive activities across the globe to boost the demand for EVA adhesives
- Asia-Pacific occupied the largest share of the demand for EVA resin-based adhesives throughout the study period because of the large number of construction and packaging activities, automotive, medical devices, and aerospace production capacities, and other well-established end-user industries in the region. China is the largest construction and automotive market globally and generates up to 58% of the demand from the Asia-Pacific region.
- During 2017-2019, the demand for EVA resin-based adhesives was sluggish due to the slow growth in the European and Asia-Pacific regions. The global decline in the demand from construction and automotive end-user industries, which are among the major end-user industries, has restricted the overall growth of EVA adhesives to around 3% (in terms of volume) in 2018 and 2019 compared to previous years.
- In 2020, the demand for EVA adhesives from all end-user industries declined because of the COVID-19 pandemic. In some countries like Germany, Russia, South Africa, and Brazil, construction activities were deemed essential and were allowed to operate during the pandemic. Factors like these have cushioned the global impact restricting the decline of EVA adhesives by around -6.75% in 2020 compared to 2019 (in terms of volume).
- In 2021, due to the relief packages and support schemes in countries like the United States, Australia, and countries in the European Union, the demand started to recover, and this growth trend is expected to continue throughout the forecast period. Increased investments and budget allotments witnessed in European, South American, and Asia-Pacific countries are expected to drive this growth.
Global EVA Adhesives Market Trends
Fast paced growth of e-commerce industry in developing nations to augment the industry
- In 2020, the packaging industry started with multiple long-term trends driving higher demand, and growth accelerated as economic activity switched to address the challenges posed by the COVID-19 pandemic. The industry's robust performance supported rising revenues and the expansion of important end markets such as food and beverage and healthcare and also demonstrated the industry's general stability during a period of overall economic uncertainty.
- Packaging M&A activities soared in 2021, as buyers and sellers enthusiastically returned to the market after deal-making almost ceased during the pandemic in 2020. During the pandemic, the strong performance of packaging companies reinforced the idea that the industry offers stability during moments of general market turbulence. The pandemic also strengthened previously existing tailwinds, including rapid e-commerce expansion and brand owners employing packaging to differentiate their products on supermarket shelves, positioning the sector for stronger long-term growth.
- As of now, dissolvable packaging, space-saving packaging, and smart packaging are a few innovations that have come up in the packaging industry. The adoption of edible packaging, an interesting and innovative alternative that alleviates the reliance on fossil fuels and has the potential to significantly decrease the carbon footprint, is now becoming popular across the food industry owing to its sustainability. These factors have created a growth opportunity for the packaging industry in the food and beverage sector, which is expected to boost the packaging industry's growth during the forecast period.
Favorable government policies to promote electric vehicles will propel automotive industry
- Since 2021, the global automotive industry has been expected to grow steadily but at a slower pace because of the decline in consumers' preferences for individual ownership of passenger vehicles and their increased preference for shared mobility in transportation. The global automotive industry is expected to experience a growth rate of 2% annually, with an expected value addition of USD 1.5 trillion in total revenue during the forecast period.
- In 2020, due to the impact of the COVID-19 pandemic, vehicle sales declined but recovered rapidly in 2021 because the governments of various countries took measures to support their economies, as automotive markets usually contribute majorly to their GDP. Vehicle sales declined from 90 million units of passenger vehicles in 2019 to 78 million units in 2020.
- The introduction of electric vehicles worldwide has contributed significantly to the overall revenue of the global automotive market because of their cheaper energy costs, environmentally benign nature, and efficient mobility features. Various government policies and standards also work as driving factors to increase EV production. For instance, the EU standards for CO2 emissions increased the demand for electric vehicles in 2021. As per the IEA's Sustainable Scenario, 230 million electric vehicles are required to replace combustion fuel-based vehicles by 2030. In 2021, Tesla, the largest EV manufacturer, recorded a rise of 157% in the number of electric vehicles manufactured. This growing trend of consumers preferring electric vehicles is expected to rise further during the forecast period (2022-2028).
EVA Adhesives Industry Overview
The EVA Adhesives Market is fragmented, with the top five companies occupying 9.33%. The major players in this market are Aica Kogyo Co..Ltd., Arkema Group, Dow, Henkel AG & Co. KGaA and NANPAO RESINS CHEMICAL GROUP (sorted alphabetically).
Additional Benefits:
- The market estimate (ME) sheet in Excel format
- 3 months of analyst support
TABLE OF CONTENTS
1 EXECUTIVE SUMMARY & KEY FINDINGS
2 REPORT OFFERS
3 INTRODUCTION
- 3.1 Study Assumptions & Market Definition
- 3.2 Scope of the Study
- 3.3 Research Methodology
4 KEY INDUSTRY TRENDS
- 4.1 End User Trends
- 4.1.1 Aerospace
- 4.1.2 Automotive
- 4.1.3 Building and Construction
- 4.1.4 Footwear and Leather
- 4.1.5 Packaging
- 4.1.6 Woodworking and Joinery
- 4.2 Regulatory Framework
- 4.2.1 Argentina
- 4.2.2 Australia
- 4.2.3 Brazil
- 4.2.4 Canada
- 4.2.5 China
- 4.2.6 EU
- 4.2.7 India
- 4.2.8 Indonesia
- 4.2.9 Japan
- 4.2.10 Malaysia
- 4.2.11 Mexico
- 4.2.12 Russia
- 4.2.13 Saudi Arabia
- 4.2.14 Singapore
- 4.2.15 South Africa
- 4.2.16 South Korea
- 4.2.17 Thailand
- 4.2.18 United States
- 4.3 Value Chain & Distribution Channel Analysis
5 MARKET SEGMENTATION (includes market size in Value in USD and Volume, Forecasts up to 2028 and analysis of growth prospects)
- 5.1 End User Industry
- 5.1.1 Aerospace
- 5.1.2 Automotive
- 5.1.3 Building and Construction
- 5.1.4 Footwear and Leather
- 5.1.5 Healthcare
- 5.1.6 Packaging
- 5.1.7 Woodworking and Joinery
- 5.1.8 Other End-user Industries
- 5.2 Technology
- 5.2.1 Hot Melt
- 5.2.2 Solvent-borne
- 5.2.3 Water-borne
- 5.3 Region
- 5.3.1 Asia-Pacific
- 5.3.1.1 Australia
- 5.3.1.2 China
- 5.3.1.3 India
- 5.3.1.4 Indonesia
- 5.3.1.5 Japan
- 5.3.1.6 Malaysia
- 5.3.1.7 Singapore
- 5.3.1.8 South Korea
- 5.3.1.9 Thailand
- 5.3.1.10 Rest of Asia-Pacific
- 5.3.2 Europe
- 5.3.2.1 France
- 5.3.2.2 Germany
- 5.3.2.3 Italy
- 5.3.2.4 Russia
- 5.3.2.5 Spain
- 5.3.2.6 United Kingdom
- 5.3.2.7 Rest of Europe
- 5.3.3 Middle East & Africa
- 5.3.3.1 Saudi Arabia
- 5.3.3.2 South Africa
- 5.3.3.3 Rest of Middle East & Africa
- 5.3.4 North America
- 5.3.4.1 Canada
- 5.3.4.2 Mexico
- 5.3.4.3 United States
- 5.3.4.4 Rest of North America
- 5.3.5 South America
- 5.3.5.1 Argentina
- 5.3.5.2 Brazil
- 5.3.5.3 Rest of South America
- 5.3.1 Asia-Pacific
6 COMPETITIVE LANDSCAPE
- 6.1 Key Strategic Moves
- 6.2 Market Share Analysis
- 6.3 Company Landscape
- 6.4 Company Profiles (includes Global Level Overview, Market Level Overview, Core Business Segments, Financials, Headcount, Key Information, Market Rank, Market Share, Products and Services, and Analysis of Recent Developments).
- 6.4.1 Aica Kogyo Co..Ltd.
- 6.4.2 Arkema Group
- 6.4.3 Beardow Adams
- 6.4.4 CEMEDINE Co.,Ltd.
- 6.4.5 Dow
- 6.4.6 Follmann Chemie GmbH
- 6.4.7 H.B. Fuller Company
- 6.4.8 Henkel AG & Co. KGaA
- 6.4.9 Jowat SE
- 6.4.10 KLEBCHEMIE M. G. Becker GmbH & Co. KG
- 6.4.11 NANPAO RESINS CHEMICAL GROUP
- 6.4.12 OKONG Corp.
- 6.4.13 Paramelt B.V.
- 6.4.14 Selic Corp Public Company Limited.
- 6.4.15 Soudal Holding N.V.
7 KEY STRATEGIC QUESTIONS FOR ADHESIVES AND SEALANTS CEOS
8 APPENDIX
- 8.1 Global Adhesives and Sealants Industry Overview
- 8.1.1 Overview
- 8.1.2 Porter's Five Forces Framework (Industry Attractiveness Analysis)
- 8.1.3 Global Value Chain Analysis
- 8.1.4 Drivers, Restraints, and Opportunities
- 8.2 Sources & References
- 8.3 List of Tables & Figures
- 8.4 Primary Insights
- 8.5 Data Pack
- 8.6 Glossary of Terms
02-2729-4219
+886-2-2729-4219
 混凝土黏合劑市場:按產品類型、形式、應用和最終用途產業分類-2026-2032年全球市場預測黏合劑市場:2026-2032年全球市場預測(黏合劑產品形態、化學性質、黏合技術和最終用途產業分類)紡織黏合劑市場:黏合劑類型、形態、功能、織物類型、最終用戶和分銷管道分類-全球預測,2026-2032年黏合劑機器類型、聚合物類型、速度、黏度、應用、最終用途產業和銷售管道,全球預測,2026-2032年有機熱連接件市場:依產品類型、應用、終端用戶產業及通路分類,全球預測(2026-2032年)橡皮筋黏合劑市場按類型、形式、分銷管道、應用和最終用戶分類,全球預測(2026-2032年)橡膠基材黏合劑市場按配方技術、樹脂類型、基材類型、最終用途產業和應用分類-全球預測,2026-2032年
 2025-2032年全球塗料、黏合劑和密封劑添加劑(CAS)市場
 全球黏合劑市場:機會與策略展望(至2034年)
 整體包裝解決方案市場分析及預測(至2035年):依類型、產品類型、服務、技術、材料類型、應用、製程、最終用戶、功能、解決方案分類
▼