


 |
市場調查報告書
商品編碼
1687424
船用燃料:市場佔有率分析、產業趨勢與統計、成長預測(2025-2030 年)Bunker Fuel - Market Share Analysis, Industry Trends & Statistics, Growth Forecasts (2025 - 2030) |
||||||
價格
※ 本網頁內容可能與最新版本有所差異。詳細情況請與我們聯繫。
簡介目錄
預計 2025 年船用燃料市場規模為 1,536.5 億美元,到 2030 年將達到 1,772.6 億美元,預測期內(2025-2030 年)的複合年成長率為 2.9%。
主要亮點
- 從中期來看,液化天然氣貿易的成長預計將推動船用燃料油的需求。 LNG 交易主要用於工業、商業和住宅電力領域。中國和印度等依賴煤炭的國家正在透過從中東和俄羅斯、澳洲和奈及利亞等其他一些國家進口更多天然氣,逐步轉型為清潔能源。
- 另一方面,預計在預測期內,環境問題和對航運業排放氣體的嚴格規定將限制重質船用燃料的使用,尤其是高硫燃料油。
- 然而,隨著亞太、中東和非洲等地區新興國家經濟表現的改善,海上運輸需求和營運船舶數量預計將增加,為未來幾年船用燃料油市場參與者提供巨大的成長機會。
- 預計預測期內亞太地區將佔據市場主導地位,大部分需求預計來自中國和印度等國家。
船用燃料油市場趨勢
液化天然氣作為船用燃料的市場預計將大幅成長
- 過去十年,全球液化天然氣燃料庫市場不斷發展,推動力是全球液化天然氣使用量不斷增加,以及清潔能源具有減少溫室氣體排放的潛力,導致清潔能源需求不斷成長。
- 將目前營運的船舶改裝成基於液化天然氣的船舶的成本非常高。因此,從經濟上來說這是不可行的。然而,一旦新的排放法規實施,預計液化天然氣船舶的營運成本將成為所有替代燃料中最低的。此外,逐步過渡到液化天然氣推進系統比使用重質燃料油、船用燃氣油和船用柴油的傳統船舶燃料方法具有優勢。基於液化天然氣的推進系統將顯著減少二氧化碳排放並提高船舶運作效率。
- 預計到 2030 年,液化天然氣燃料需求將成長到 3,000 萬噸,歐洲、亞洲和北美正在建造更多的液化天然氣加油船,以滿足不斷成長的燃氣引擎船隊的需求。這些從船廠訂購的大容量液化天然氣加註船(LNGBV)旨在在主要LNG接收站加註貨物並為燃氣引擎遠洋船舶加註燃料。
- 截至 2024 年 2 月,將有 48 艘 LNG 活躍加油船,比 2022 年增加 11 艘。其中近一半在歐洲營運,其餘在亞洲和北美營運。到 2024年終,LNG燃料庫船隊預計將達到 55 艘,僅 2024 年就將增加總合容量 67,900 立方公尺。
- 船東,尤其是在歐洲和美國水域營運的船東,現在更傾向於使用液化天然氣的船舶,而不是傳統船舶。此外,液化天然氣燃料船舶尚未大規模滲透散裝貨船市場。散裝船用於運載重物,而 LNG 技術在該類船舶上的應用相對較新。散裝船佔運作中船隊的最大佔有率。
- 此外,使用液化天然氣作為燃料是一種經過驗證且具有商業性可行性的解決方案。 LNG 具有巨大的優勢,特別是對於面臨日益嚴格的排放氣體法規的船舶而言。雖然預計傳統石油燃料在中期內仍將是大多數船舶的主要燃料選擇,但從長期來看,液化天然氣可能會成為主流選擇。
- 2024 年 4 月,科技集團瓦錫蘭 (Wärtsilä) 旗下的瓦錫蘭天然氣解決方案公司 (Wärtsilä Gas Solutions) 宣布將為西班牙船東 Scale Gas(Enagas 的子公司,擁有並營運西班牙天然氣管網)建造的 12,500 立方米液化天然氣燃料庫新船提供裝卸系統。該船由永續交通支援計畫共同資助,該計畫是西班牙交通、流動和城市規劃部復甦、轉型和復原力計畫的一部分。
- LNG較傳統燃料相對便宜,與石油基航運燃料相比可減少23%的溫室氣體排放,有助於實現全球脫碳目標。由於這些因素,預計 LNG 將成為未來最受歡迎的船用燃料。
亞太地區可望主導市場
- 由於印度、中國、新加坡和日本等國家擁有巨大的海運貿易潛力,亞太地區預計將主導船用燃料油市場。
- 截至2023年,中國出口量位居第一,進口量位居第二。 2023年,中國進口商品約2.5兆美元,出口約3.3兆美元。中國主要出口產品包括機械及電氣設備、汽車零件、化學品及塑膠、鋼鐵產品、家具等。
- 澳洲是世界上最大的液化天然氣出口國之一。液化天然氣出口的增加支持了澳洲日益成長的國際貿易。全球對液化天然氣的需求正在大幅成長,因此未來幾年出口量可能會增加。
- 為了增加海運業在國際和國內貿易中的佔有率,印度政府宣布計劃在 2035 年投資 220 億美元對現有港口進行現代化改造並建造新港口。預計預測期內,港口基礎建設將提振亞太地區海運業和船用燃料供應商的需求。
- 2024年2月,LNG加註船承租人Pavilion Energy宣布,LNG加註船Brassavola號已完成首次船對船(STS) LNG加註作業。 Brassavola 將液化天然氣運送至力拓租賃的雙燃料散裝貨船 Mount Api 號。
- 因此,由於上述因素,預計亞太地區將在預測期內主導船用燃料油市場。
船用燃料油產業概況
全球船用燃料油市場較為分散。市場的主要企業(不分先後順序)包括 Gazpromneft Marine Bunker LLC、埃克森美孚公司、殼牌公司、道達爾能源公司和英國石油公司。
其他福利:
- Excel 格式的市場預測 (ME) 表
- 3 個月的分析師支持
目錄
第 1 章 簡介
- 研究範圍
- 市場定義
- 調查前提
第 2 章執行摘要
第3章調查方法
第4章 市場概況
- 介紹
- 2029 年市場規模與需求預測(美元)
- 最新趨勢和發展
- 政府法規和政策
- 市場動態
- 驅動程式
- 全球液化天然氣貿易不斷成長
- 越來越依賴天然氣發電
- 限制因素
- 環境問題和嚴格的船舶排放規定
- 驅動程式
- 供應鏈分析
- 波特五力分析
- 供應商的議價能力
- 消費者議價能力
- 新進入者的威脅
- 替代品的威脅
- 競爭對手之間的競爭強度
- 投資分析
第5章 市場區隔
- 燃料類型
- 高硫燃料油 (HSFO)
- 極低硫燃料油 (VLSFO)
- 船用瓦斯油 (MGO)
- 液化天然氣(LNG)
- 其他燃料
- 船舶類型
- 容器
- 油船
- 雜貨船
- 散貨船
- 其他船型
- 地區
- 北美洲
- 美國
- 加拿大
- 北美其他地區
- 歐洲
- 德國
- 法國
- 英國
- 西班牙
- 北歐的
- 土耳其
- 俄羅斯
- 其他歐洲國家
- 亞太地區
- 中國
- 印度
- 日本
- 韓國
- 馬來西亞
- 泰國
- 印尼
- 越南
- 其他亞太地區
- 南美洲
- 巴西
- 阿根廷
- 哥倫比亞
- 南美洲其他地區
- 中東和非洲
- 沙烏地阿拉伯
- 阿拉伯聯合大公國
- 南非
- 奈及利亞
- 卡達
- 埃及
- 其他中東和非洲地區
- 北美洲
第6章 競爭格局
- 併購、合資、合作、協議
- 主要企業策略
- 公司簡介
- 燃料供應商
- ExxonMobil Corporation
- Shell PLC
- Gazpromneft Marine Bunker LLC
- BP PLC
- PJSC Lukoil Oil Company
- TotalEnergies SE
- Chevron Corporation
- Clipper Oil
- Gulf Agency Company Ltd
- Bomin Bunker Holding GmbH & Co. KG
- 船東
- AP Moeller Maersk AS
- Mediterranean Shipping Company SA
- China COSCO Shipping Corporation Limited
- CMA CGM Group
- Hapag-Lloyd AG
- Ocean Network Express
- Evergreen Marine Corp Taiwan Ltd
- Yang Ming Marine Transport Corporation
- HMM Co. Ltd
- Pacific International Lines Pte Ltd
- 其他主要企業名單
- 市場排名分析
- 燃料供應商
第7章 市場機會與未來趨勢
- 海上運輸需求不斷成長,營運船舶數量不斷增加
簡介目錄
Product Code: 62667
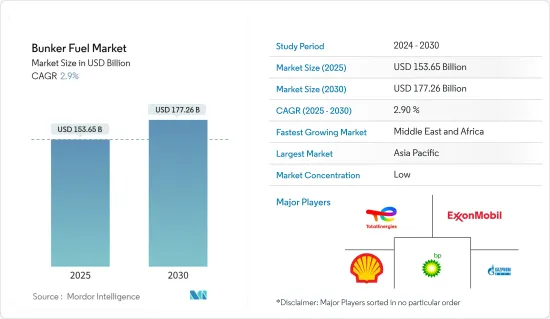
The Bunker Fuel Market size is estimated at USD 153.65 billion in 2025, and is expected to reach USD 177.26 billion by 2030, at a CAGR of 2.9% during the forecast period (2025-2030).
Key Highlights
- Over the medium term, increasing LNG trade is expected to boost the demand for bunker fuel. LNG is majorly traded for the power sector in industrial, commercial, and residential segments. Countries with high coal dependencies, such as China and India, are gradually moving toward cleaner energy by increasing the import volume of natural gas from the Middle East and a few other nations, like Russia, Australia, and Nigeria.
- On the other hand, environmental concerns and the strict regulations related to emissions from the maritime industry are anticipated to limit the usage of heavy bunker fuels, especially high sulfur fuel oil, during the forecast period.
- Nevertheless, with the improved economic performance of developing countries across regions such as Asia-Pacific and Middle East and Africa, the demand for marine transportation and the number of ships in operation are expected to increase, offering significant growth opportunities for players in the bunker fuels market over the coming years.
- Asia-Pacific is expected to dominate the market during the forecast period, with the majority of the demand being generated from countries like China and India.
Bunker Fuel Market Trends
LNG Likely to Witness Significant Market Growth as a Bunker Fuel
- The global LNG bunkering market has evolved over the past decade, driven by the increase in global LNG usage amid growing demand for clean energy due to its ability to reduce greenhouse gas emissions.
- The conversion of the current operating vessels into LNG-based vessels is highly expensive. Hence, it is not economically viable. However, the operational cost of LNG-based vessels is expected to be the lowest among all the fuel alternatives once the new emission regulations become applicable. Further, a gradual shift to LNG for propulsion is more advantageous than the traditional methods of fueling ships with heavy fuel oil, marine gas oil, marine diesel oil, etc. LNG-based propulsion reduces the carbon footprint significantly and increases a ship's operational efficiency.
- With demand for LNG as a fuel expected to rise to 30 million tonnes by 2030, Europe, Asia, and North America are adding LNG bunkering vessels to keep pace with the swelling gas-powered fleet. These larger capacity LNG bunker vessels (LNGBVs) on order at shipyards are designed to load at major LNG terminals and refuel gas-powered ocean-going tonnage.
- As of February 2024, there were 48 LNG active bunkering vessels, 11 more than in 2022. Out of the total fleet, nearly half operate in Europe, while the rest operate in Asia and North America. By the end of 2024, the number of LNG bunkering vessel fleets is likely to reach 55 units, with a total added capacity of 67,900 cm in 2024 alone.
- Shipowners, particularly those operating in the European or American Sea, now prefer LNG-based vessels over conventional vessels. Furthermore, LNG-fueled ships have not penetrated the market for bulk carriers to a significant extent, as these ships are designed to carry heavy loads, and LNG technology is relatively new to apply for this type of vessel. The bulk carriers amount to the largest share of the in-operation ships.
- Moreover, the use of LNG as a fuel is both a proven and commercially available solution. LNG offers enormous advantages, especially for ships in the light of ever-tightening emission regulations. Conventional oil-based fuels are expected to remain the primary fuel option for most ships in the mid-term, while LNG is likely to become a popular choice in the long-term scenario.
- In April 2024, Wartsila Gas Solutions, part of the technology group Wartsila, announced that it would supply the cargo handling system for a new 12,500 m3 LNG bunkering vessel being built for Spanish shipowner Scale Gas, a subsidiary of Enagas, the owner and operator of Spain's gas grid. The vessel is co-financed by the Support for Sustainable and Digital Transport Programme, part of the Recovery, Transformation and Resilience Plan from the Spanish Ministry of Transport, Mobility and Urban Agenda.
- LNG demand is likely to increase significantly in the forecast period as the order book for LNG vessels continues to increase due to it being relatively cheaper than conventional fuels and offering a 23% reduction in greenhouse gas emissions over oil-based marine fuel, which will aid in meeting global decarbonization goals. These factors project LNG to be the most popular marine fuel in the future.
Asia-Pacific Expected to Dominate the Market
- Asia-Pacific is expected to dominate the bunker fuels market due to the immense maritime trade potential of countries like India, China, Singapore, and Japan.
- As of 2023, China ranked first in terms of exported goods and second for imported goods by value. In 2023, China imported goods worth around USD 2.5 trillion and exported USD 3.3 trillion. China's major exports are mechanical and electric machinery and equipment and automotive products, including vehicle parts, chemicals and plastics, iron and steel articles, and furniture.
- Australia is among the biggest exporters of LNG globally. Rising LNG exports have supported the growth in international trade in Australia. The export volume is likely to rise in the coming years as the demand for LNG is increasing significantly worldwide.
- To increase the share of the marine sector in international and domestic trade, the Indian government announced an investment of USD 22 billion by 2035 to modernize its existing ports and build new ports. The port infrastructure development is expected to increase the demand from the maritime industry and marine fuel suppliers in Asia-Pacific during the forecast period.
- In February 2024, Pavilion Energy, charterer of LNG bunker vessels, announced that LNG bunker vessel Brassavola had completed its first ship-to-ship (STS) LNG bunkering operation. In its maiden STS LNG bunkering operation, Brassavola delivered LNG to Rio Tinto chartered dual-fueled bulk carrier Mount Api.
- Therefore, in line with the aforementioned factors, Asia-Pacific is expected to dominate the bunker fuels market during the forecast period.
Bunker Fuel Industry Overview
The global bunker fuels market is fragmented. Some of the major players in the market (in no particular order) include Gazpromneft Marine Bunker LLC, ExxonMobil Corporation, Shell PLC, TotalEnergies SE, and BP PLC.
Additional Benefits:
- The market estimate (ME) sheet in Excel format
- 3 months of analyst support
TABLE OF CONTENTS
1 INTRODUCTION
- 1.1 Scope of the Study
- 1.2 Market Definition
- 1.3 Study Assumptions
2 EXECUTIVE SUMMARY
3 RESEARCH METHODOLOGY
4 MARKET OVERVIEW
- 4.1 Introduction
- 4.2 Market Size and Demand Forecast in USD, till 2029
- 4.3 Recent Trends and Developments
- 4.4 Government Policies and Regulations
- 4.5 Market Dynamics
- 4.5.1 Drivers
- 4.5.1.1 Increased LNG Trade Worldwide
- 4.5.1.2 Increasing Dependencies over Natural Gas for Power Generation
- 4.5.2 Restraints
- 4.5.2.1 Environmental Concerns and the Strict Regulations Related to Emissions from the Maritime Industry
- 4.5.1 Drivers
- 4.6 Supply Chain Analysis
- 4.7 Porter's Five Forces Analysis
- 4.7.1 Bargaining Power of Suppliers
- 4.7.2 Bargaining Power of Consumers
- 4.7.3 Threat of New Entrants
- 4.7.4 Threat of Substitute Products and Services
- 4.7.5 Intensity of Competitive Rivalry
- 4.8 Investment Analysis
5 MARKET SEGMENTATION
- 5.1 Fuel Type
- 5.1.1 High Sulfur Fuel Oil (HSFO)
- 5.1.2 Very Low Sulfur Fuel Oil (VLSFO)
- 5.1.3 Marine Gas Oil (MGO)
- 5.1.4 Liquefied Natural Gas (LNG)
- 5.1.5 Other Fuel Types
- 5.2 Vessel Type
- 5.2.1 Containers
- 5.2.2 Tankers
- 5.2.3 General Cargo
- 5.2.4 Bulk Carriers
- 5.2.5 Other Vessel Types
- 5.3 Geography
- 5.3.1 North America
- 5.3.1.1 United States
- 5.3.1.2 Canada
- 5.3.1.3 Rest of North America
- 5.3.2 Europe
- 5.3.2.1 Germany
- 5.3.2.2 France
- 5.3.2.3 United Kingdom
- 5.3.2.4 Spain
- 5.3.2.5 NORDIC
- 5.3.2.6 Turkey
- 5.3.2.7 Russia
- 5.3.2.8 Rest of Europe
- 5.3.3 Asia-Pacific
- 5.3.3.1 China
- 5.3.3.2 India
- 5.3.3.3 Japan
- 5.3.3.4 South Korea
- 5.3.3.5 Malaysia
- 5.3.3.6 Thailand
- 5.3.3.7 Indonesia
- 5.3.3.8 Vietnam
- 5.3.3.9 Rest of Asia-Pacific
- 5.3.4 South America
- 5.3.4.1 Brazil
- 5.3.4.2 Argentina
- 5.3.4.3 Colombia
- 5.3.4.4 Rest of South America
- 5.3.5 Middle-East and Africa
- 5.3.5.1 Saudi Arabia
- 5.3.5.2 United Arab Emirates
- 5.3.5.3 South Africa
- 5.3.5.4 Nigeria
- 5.3.5.5 Qatar
- 5.3.5.6 Egypt
- 5.3.5.7 Rest of Middle-East and Africa
- 5.3.1 North America
6 COMPETITIVE LANDSCAPE
- 6.1 Mergers and Acquisitions, Joint Ventures, Collaborations, and Agreements
- 6.2 Strategies Adopted by Leading Players
- 6.3 Company Profiles
- 6.3.1 Fuel Suppliers
- 6.3.1.1 ExxonMobil Corporation
- 6.3.1.2 Shell PLC
- 6.3.1.3 Gazpromneft Marine Bunker LLC
- 6.3.1.4 BP PLC
- 6.3.1.5 PJSC Lukoil Oil Company
- 6.3.1.6 TotalEnergies SE
- 6.3.1.7 Chevron Corporation
- 6.3.1.8 Clipper Oil
- 6.3.1.9 Gulf Agency Company Ltd
- 6.3.1.10 Bomin Bunker Holding GmbH & Co. KG
- 6.3.2 Ship Owners
- 6.3.2.1 AP Moeller Maersk AS
- 6.3.2.2 Mediterranean Shipping Company SA
- 6.3.2.3 China COSCO Shipping Corporation Limited
- 6.3.2.4 CMA CGM Group
- 6.3.2.5 Hapag-Lloyd AG
- 6.3.2.6 Ocean Network Express
- 6.3.2.7 Evergreen Marine Corp Taiwan Ltd
- 6.3.2.8 Yang Ming Marine Transport Corporation
- 6.3.2.9 HMM Co. Ltd
- 6.3.2.10 Pacific International Lines Pte Ltd
- 6.3.3 List of Other Prominent Companies
- 6.3.4 Market Ranking Analysis
- 6.3.1 Fuel Suppliers
7 MARKET OPPORTUNITIES AND FUTURE TRENDS
- 7.1 Risisng Demand for Marine Transportation and Increasing Number of Ships in Operation
02-2729-4219
+886-2-2729-4219
 船用燃料市場:依燃料類型、船舶類型、運作模式、船用引擎類型、最終用戶和通路分類-2026-2032年全球市場預測
 全球船用燃料油市場規模、佔有率、趨勢和成長分析報告(2026-2034年)
 船用燃料市場規模、佔有率、趨勢及預測(按燃料類型、船舶類型、銷售商及地區分類),2026-2034年
 2026年全球船用燃料市場報告
 2026-2030年全球船用燃料油市場
 全球船用燃料市場-產業規模、佔有率、趨勢、機會和預測,按類型、商業分銷商、應用、地區和競爭格局分類,2021-2031年預測
 按類型、應用和地區分類的爐用燃料油市場規模、佔有率和成長分析 - 2026-2033 年產業預測
 按等級、經銷商、應用和地區分類的船用燃料市場規模、佔有率和成長分析 - 產業預測(2026-2033 年)
 船用燃料市場機會、成長促進因素、產業趨勢分析及預測(2025-2034年)
 美國船用燃料市場:市場規模、佔有率、趨勢分析(按類型和應用)、細分市場預測(2025-2030 年)
▼