


 |
市場調查報告書
商品編碼
1687053
北美店內分析:市場佔有率分析、產業趨勢與成長預測(2025-2030 年)NA In-Store Analytics - Market Share Analysis, Industry Trends & Statistics, Growth Forecasts (2025 - 2030) |
||||||
※ 本網頁內容可能與最新版本有所差異。詳細情況請與我們聯繫。
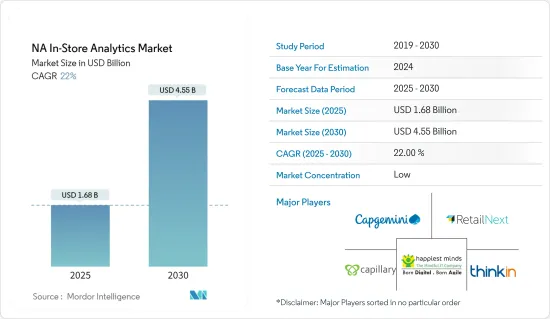
北美店內分析市場規模預計在 2025 年為 16.8 億美元,預計到 2030 年將達到 45.5 億美元,預測期內(2025-2030 年)的複合年成長率為 22%。
預計店內業務資料量的增加以及對更好的客戶服務和改善購物體驗的需求等因素將推動市場的發展。
主要亮點
- 在競爭激烈的零售市場中,店內分析越來越受到重視。店內分析有可能改變商店佈局並改善各個業務部門的客戶體驗。在北美,零售商正在使用配備定位信標的智慧購物車、安裝在貨架附近的針狀攝影機或店內 Wi-Fi 網路來了解有多少消費者進入商店、他們如何走動以及他們訪問哪些關鍵區域。這個過程使資料能夠獲得性別和年齡層等基本人口統計。
- 北美擁有最大的零售市場之一。沃爾瑪、好市多、克羅格、家得寶和塔吉特均起源於該地區。店內業務資料量的快速成長正在推動市場成長。隨著銷售額的增加,資料量也會增加。隨著資料量的成長,如果不實施分析,就很難追蹤所有客戶記錄、行為、商店存取等。
- 當零售商使用多種技術為消費者提供客製化體驗時,就實現了商店的數位化,包括評估客戶偏好、識別他們在商店中的數位化、有針對性的促銷和購買習慣。業務監控技術可以分析這些趨勢並提供有價值的見解,有助於增加銷售額、收益和客流量。例如,亞馬遜於 2022 年 6 月宣布推出新的 Store Analytics 服務。電子商務巨頭希望透過向負責人提供有關客戶購買情況的資料來充分利用其實體店。
- 美國勞工統計局估計,到 2026 年,對熟練資料科學家的需求將會很高,就業人數將增加 27.9%。然而,這種巨大的需求也可能導致合格專業人員的嚴重短缺。此外,市場成長面臨的另一個挑戰是,負責人可能需要找到新的方法來執行2022年及以後的策略,以滿足消費者對便利性的渴望。 《加州消費者隱私法案》和《維吉尼亞消費者資料隱私法案》等新的資料隱私法規對零售負責人產生了一系列重大影響。曾經支援特定用戶定位的第三方資料將不再提供給Google和 Facebook 等廣告平台。零售商正在尋找新方法在其數位行銷策略中使用第一方資料。
- COVID-19 疫情促使零售業大力採用技術,以提高商店運轉率、螢幕溫度控制、保持社交距離並簡化設施使用。其中一些措施是法律要求的,而另一些措施則是為了確保顧客安全和限制商店關閉。許多此類技術為零售商提供了店內分析的顯著優勢,並被視為長期策略投資而非臨時保護措施,從而帶來更好的投資收益。
北美店內分析市場趨勢
預測期內門市營運管理將呈現良好成長
- 商店營運管理涉及運行和監控商店內所有業務的一系列活動。管理商店營運的關鍵職責包括與員工密切合作、制定工作計劃、與供應商溝通以確保產品有庫存以及處理客戶申訴。
- 在北美,特別是美國,有幾家公司在全國各地擁有多家商店。例如,根據美國零售聯合會的數據,沃爾瑪在 2022 年實現了擴張。根據其最新財務數據,這美國最大零售商2022年第一季的銷售額為1,416億美元,較去年同期成長2.4%。大部分成長來自美國市場,2022 年第一季淨銷售額成長 4%,達到 969 億美元。
- 隨著市場情勢的改善,一些本地和國際軟體供應商已經推出了分析軟體來滿足日益成長的需求。例如,IBM 的 Sterling Store Engagement 解決方案透過直覺的使用者介面顯示即時商店庫存、客戶和訂單資料。
- 同樣,SCOPIX Store Operations Analytics 使用基於網路的 IP 視訊監控技術,為持續監控商店營運提供了經濟高效的基礎。該解決方案根據特定基準捕獲並分析店內即時活動。此外,它還將視訊影像轉換為可操作的商業智慧,使商店管理、行銷團隊、營運經理和銷售人員受益。
- 此外,根據美國勞工部的數據,美國各地的雜貨零售商都面臨勞動力短缺的問題。預計人手不足不會很快消失,這就是零售業轉向數位技術和自動化的原因。
預計美國將佔很大市場佔有率
- 美國是全球最大的零售市場之一,受到新冠疫情的嚴重打擊。但要使這些成長的數字保持正常,鞏固成長並保持成長勢頭,需要先進的技術來分析如此大規模的資料。根據美國零售聯合會(NRF)的數據,零售業是美國最大的私人雇主,每年為 GDP 貢獻 3.9 兆美元,並支持美國四分之一的就業(5,200 萬美國工人)。
- 根據美國人口普查局的數據,2022 年 3 月零售額經季節性已調整的後較 2 月成長 0.5%,較去年同期成長 6.9%。 2月季增0.8%,年增18.2%。
- 後疫情時代的美國零售市場正在尋求利用資料分析技術來克服障礙,而這項解決方案將受到對零售商運作有重大影響的幾個因素的影響。我們針對美國零售業提供的零售分析解決方案專注於解決日益複雜的挑戰,以幫助您獲得市場佔有率。它能夠透過分析多個資料集提供可操作的見解,幫助零售客戶確定正確的策略,以恢復損失的銷售額並透過滿足客戶的動態需求來增加市場佔有率。
- 隨著市場重新開放並走出關閉狀態,消費者正在轉向混合購物結構。智慧全通路資料和追蹤策略對於了解客戶行為至關重要。擁有強大全通路業務的品牌依靠分析來了解如何利用市場中客戶行為帶來的機會。
- 此外,國內電子商務零售和實體零售可能會推動該產業的發展。根據美國商務部和美國人口普查局的數據,由電子商務推動的美國零售總額從 2021 年第四季的 14.5% 上升至 2022 年第三季的 14.8%。
北美店內分析產業概況
北美店內分析市場競爭激烈,零售業的軟體系統供應商和技術創新眾多。市場上的一些主要企業包括 Capgemini、RetailNext、Happiest Minds Technologies Limited、Capillary Technologies 和 ThinkIN。市場上的公司經常改變其定價方案,這給其他公司帶來了價格壓力並加劇了市場競爭。
- 2023 年 10 月,店內客流量分析供應商 RetailNext 與著名的實體零售 A/B 測試解決方案供應商 MarketDial 合作。兩家公司攜手合作,旨在為零售商提供前所未有的 360° 客戶旅程視圖。 RetailNext 使用人工智慧熱圖技術來了解店內客流量趨勢,並提供有關停留時間、參與度和購物者曝光度的可行見解。
- 2023年5月,Capgemini SA與Google雲端宣布拓展雙方在資料分析與人工智慧領域的長期策略夥伴關係關係,創建全球生成式人工智慧Google雲端卓越中心,協助企業充分發揮人工智慧技術的潛力。Capgemini SA將開發一個包含 500 多個企業級行業用例的庫,包括金融服務、零售和汽車行業,主要利用 Google Cloud 的生成式 AI 技術。
- 2023 年 1 月,微軟發布了與 AiFi 合作的雲端儲存服務預覽版,名為 Smart Store Analytics。智慧商店資訊是微軟零售雲端產品套件的一部分,它為採用 AiFi 技術的零售商提供其智慧商店的營運分析和消費者。
其他福利:
- Excel 格式的市場預測 (ME) 表
- 3個月的分析師支持
目錄
第1章 引言
- 研究假設和市場定義
- 研究範圍
第2章調查方法
第3章執行摘要
第4章 市場洞察
- 市場概覽
- 產業吸引力-波特五力分析
- 新進入者的威脅
- 買家的議價能力
- 供應商的議價能力
- 替代品的威脅
- 競爭對手之間的競爭
- 產業價值鏈分析
- COVID-19 產業影響評估
第5章市場動態
- 市場促進因素
- 商店業務資料量不斷增加
- 需要更好的客戶服務和改善的購物體驗
- 市場挑戰
- 熟練勞動力短缺
- 使用案例
- 客流量分析
- 客戶行為分析
- 版稅管理
- 影片分析
- 智慧收銀機
第6章市場區隔
- 按組件
- 軟體
- 按服務
- 按部署
- 雲
- 本地
- 按組織規模
- 大型企業
- 中小型企業
- 按應用
- 客戶管理
- 風險與合規管理
- 店鋪營運管理
- 行銷和商品行銷
- 其他用途
- 按國家
- 美國
- 加拿大
第7章競爭格局
- 公司簡介
- Capgemini Se
- Retailnext Inc.
- Happiest Minds Technologies
- Capillary Technologies
- Thinkin Srl
- Trax Image Recognition
- Cloud4wi Inc.
- Amoobi
- SAP SE
- Shoppertrak(sensormatic Solutions)
- Analytiks AI
- Cisco Meraki(Cisco Systems Inc.)
- C2ro
第8章投資分析
第9章 市場機會與未來趨勢
The NA In-Store Analytics Market size is estimated at USD 1.68 billion in 2025, and is expected to reach USD 4.55 billion by 2030, at a CAGR of 22% during the forecast period (2025-2030).
Factors such as increasing data volume in in-store operations and the need For better customer service and enhanced shopping experience are expected to drive the market.
Key Highlights
- In the hyper-competitive retail market, in-store analytics is gaining traction. In-store analytics has the potential to transform the store layout and improve customer experience across different business segments. In the North American region, retailers use smart carts with location beacons, pin-sized cameras installed near shelves, or the store's Wi-Fi network to see how many shoppers entered the store, how they moved around once inside, and what key areas they visited. This process can provide basic demographic data, such as gender and age group.
- The retail market in North America is one of the biggest. Wal-Mart, Costco, Kroger, Home Depot, and Target originated in this region. The rapidly growing data volume across in-store operations drives the market's growth. With increasing sales value, the volume of data is increasing. With growing data volume, it has become difficult to track every customer's record, behaviors, footfall, etc., without implementing analytics.
- When retailers give customized experiences to their consumers using several technologies, such as evaluating customer preferences, recognizing customer location in-store, targeted promotions, and purchase habits, they accomplish digitalization in shops. The business monitoring technology analyzes these trends to offer valuable insights that assist merchants in increasing sales, revenue, and footfalls. For example, Amazon announced the debut of its new Store Analytics service in June 2022. The e-commerce behemoth is attempting to profit from its physical storefronts by providing marketers with data on what customers buy.
- The United States Bureau of Labour Statistics estimated the demand for skilled and knowledgeable data scientists to boost by 2026, leading to a 27.9% rise in employment. However, this huge demand would also bring a significant shortage of qualified professionals. Further, another challenge to the market growth is that marketers might need to find new ways of executing their strategies in 2022 and beyond to satisfy the consumer thirst for convenience. New data privacy regulations like the California Consumer Privacy Act and Virginia's Consumer Data Privacy Act set a chain of events in motion that will heavily impact retail marketers. The third-party data that once enabled specific user targeting will no longer be available on ad platforms such as Google and Facebook. Retailers are trying to explore new ways to use first-party data in their digital marketing strategies.
- Due to the COVID-19 pandemic, the retail industry has seen significant technology adoption to manage store occupancy and screen temperatures, maintain social distancing, and streamline the use of facilities. Some of these adoptions are mandated by law, and others were made to ensure customer safety and limit store closures. Many of these technologies provided retailers with significant advantages for in-store analytics, and a much better return on investment is seen as a long-term strategic investment rather than a temporary protective measure.
North America In-Store Analytics Market Trends
Store Operation Management to Exhibit Good Growth Over the Forecast Period
- Store operation management entails a set of activities for running and monitoring all the operations inside a store. Some of the significant responsibilities of store management include working closely with staff, creating work schedules, communicating with suppliers to ensure the availability of products, and dealing with customer complaints.
- There are several companies within the North American region, especially in the United States, with many stores in the country. For instance, according to National Retail Federation, Walmart expanded in 2022. According to latest fiscal figures, the biggest US retailer made revenue of USD 141.6 billion in the Q1 of 2022, a 2.4 rise year on year. The majority of this revenue increase came from the United States market, where net sales increased by 4% to $96.9 billion in Q1 2022.
- The favourable market scenario has attracted several local and global software providers to develop analytics software to cater to the growing demand. For instance, IBM's Sterling Store Engagement solution provides a real-time view of the store inventory and customer and order data through an intuitive user interface that a store operator can access from sales counters and mobile devices.
- Similarly, SCOPIX Store Operations Analytics, which offers a cost-effective foundation for continuous monitoring of store operations, uses network-based IP video surveillance technology. The solution captures and analyzes live in-store conditions against specific benchmarks. Furthermore, it transforms video footage into actionable business intelligence that benefits store management, marketing teams, operations managers, and merchandisers.
- Furthermore, according to US Labor Department, grocery retailers around the United States are suffering from a labor crunch. As this shortage is not expected to go away soon, there is a growing interest in digital technology and automation among retail.
United States is Expected to Hold a Significant Market Share
- The United States is one of the top retail markets globally and was impacted by covid-19. However, returning on track with increasing numbers and bolstering the growth to maintain the boost requires advanced technology to analyze data at that scale. As per the National Retail Federation (NRF), Retail is the nation's largest private-sector employer, contributing USD 3.9 trillion to annual GDP and supporting one in four United States jobs - 52 million working Americans.
- According to the US Census Bureau, total retail sales in March 2022 was up 0.5% seasonally adjusted from February and increased 6.9% Y-O-Y. In February, the rise was 0.8% month over month and 18.2% Y-O-Y.
- The post-pandemic United States retail market has been trying to overcome obstacles using Data Analytics technology as a solution that will be shaped by several factors contributing significantly to how retailers function. Retail analytics solutions for the United States retail industry will focus on dealing with challenges that arise from heightened complexities and help to improve the market share. Their ability to offer actionable insights by analyzing multiple data sets will help their retail clients identify the right strategies for recovering lost sales and boost market share by addressing the dynamic needs of their customers.
- With the market reopening and letting go of lockdown, consumers are shifting to a Hybrid shopping structure, for this omnichannel data is of great significance. A smart omnichannel data and tracking strategy are essential to understanding customers' behavior. Brands with a robust omnichannel business rely on analytics to know how to take advantage of the opportunity possible by customers' behaviors toward the market.
- Furthermore, the country's e-commerce retail and in-store retail sales are likely to propel the industry. According to the US Department of Commerce and the US Census Bureau, e-commerce total U.S. retail sales climbed from 14.5% in the fourth quarter of 2021 to 14.8% in the third quarter of 2022.
North America In-Store Analytics Industry Overview
The North America in-store analytics market is highly competitive owing to numerous software systems providers and technological innovation in the industry for retail. Some of the major players operating in the market include Capgemini, RetailNext, Happiest Minds Technologies Limited, Capillary Technologies, and ThinkIN, among others. The players in the market are regularly involved in altering their pricing schemes, which creates pricing pressure on other companies, thereby augmenting the competition in the market.
- In October 2023, RetailNext, a provider of in-store traffic analytics, partnered with MarketDial, a prominent A/B testing solution for physical retail. Both companies have made this partnership intending to provide retailers with an unprecedented 360° view of the customer journey. RetailNext uses its AI-driven heat-mapping technology to identify in-store traffic trends, providing actionable insights on dwell time, engagement, and shopper exposure.
- In May 2023, Capgemini and Google Cloud declared an expansion of their long-standing strategic partnership in terms of data analytics and artificial intelligence, thereby building a global Generative AI Google Cloud Center of Excellence to assist enterprises in realizing the complete potential of AI technologies. Capgemini would utilize Google Cloud's generative AI technologies primarily to develop a library of more than 500 enterprise-ready industry use cases, beginning with financial services, retail, as well as automotive.
- In January 2023, Microsoft released a preview of a cloud storage service known as Smart Store Analytics in collaboration with AiFi, which seeks to allow retailers to adopt autonomous shopping technology at a low cost. Smart Store Information, which is part of Microsoft's Clouds for Retail suite of products, offers retailers employing AiFi's technologies operational analytics and shoppers for their fleets of smart shops.
Additional Benefits:
- The market estimate (ME) sheet in Excel format
- 3 months of analyst support
TABLE OF CONTENTS
1 INTRODUCTION
- 1.1 Study Assumptions and Market Definition
- 1.2 Scope of the Study
2 RESEARCH METHODOLOGY
3 EXECUTIVE SUMMARY
4 MARKET INSIGHTS
- 4.1 Market Overview
- 4.2 Industry Attractiveness - Porter's Five Forces Analysis
- 4.2.1 Threat of New Entrants
- 4.2.2 Bargaining Power of Buyers
- 4.2.3 Bargaining Power of Suppliers
- 4.2.4 Threat of Substitutes
- 4.2.5 Intensity of Competitive Rivalry
- 4.3 Industry Value Chain Analysis
- 4.4 Assessment of the Impact of COVID -19 on the Industry
5 MARKET DYNAMICS
- 5.1 Market Drivers
- 5.1.1 Increasing Data Volume In In-store Operations
- 5.1.2 Need For Better Customer Service And Enhanced Shopping Experience
- 5.2 Market Challenges
- 5.2.1 Lack of Skilled Personnel
- 5.3 Use Cases
- 5.3.1 Footfall Analytics
- 5.3.2 Customer Behavior Analytics
- 5.3.3 Loyalty Management
- 5.3.4 Video Analytics
- 5.3.5 Smart Checkouts
6 MARKET SEGMENTATION
- 6.1 By Component
- 6.1.1 Software
- 6.1.2 Services
- 6.2 By Deployment
- 6.2.1 Cloud
- 6.2.2 On-premise
- 6.3 By Organization Size
- 6.3.1 Large Enterprises
- 6.3.2 Small and Medium Enterprises
- 6.4 By Application
- 6.4.1 Customer Management
- 6.4.2 Risk and Compliance Management
- 6.4.3 Store Operation Management
- 6.4.4 Marketing and Merchandizing
- 6.4.5 Other Applications
- 6.5 By Country
- 6.5.1 United States
- 6.5.2 Canada
7 COMPETITIVE LANDSCAPE
- 7.1 Company Profiles
- 7.1.1 Capgemini Se
- 7.1.2 Retailnext Inc.
- 7.1.3 Happiest Minds Technologies
- 7.1.4 Capillary Technologies
- 7.1.5 Thinkin Srl
- 7.1.6 Trax Image Recognition
- 7.1.7 Cloud4wi Inc.
- 7.1.8 Amoobi
- 7.1.9 SAP SE
- 7.1.10 Shoppertrak(sensormatic Solutions)
- 7.1.11 Analytiks AI
- 7.1.12 Cisco Meraki (Cisco Systems Inc.)
- 7.1.13 C2ro
8 INVESTMENT ANALYSIS
9 MARKET OPPORTUNITIES AND FUTURE TRENDS
 按組件、技術、部署類型和最終用戶分類的店內分析市場 - 2025-2032 年全球預測
 店內分析市場-全球產業規模、佔有率、趨勢、機會和預測,按類型、按技術、按最終用戶產業、按地區和競爭進行細分,2020-2030 年預測
 2025年全球店內分析市場報告
 店內分析市場規模、佔有率、按組件、部署模式、公司規模和地區分類的成長分析 - 2025 年至 2032 年產業預測
 店內分析市場規模、佔有率、趨勢分析報告:2025 年至 2032 年按實施、解決方案類型、應用和地區分類的展望和預測
 店內分析 -市場佔有率分析、產業趨勢與統計、成長預測(2025-2030 年)
 店內分析市場機會、成長動力、產業趨勢分析及 2024 年至 2032 年預測
 店內分析市場規模、佔有率和趨勢分析報告:按解決方案類型、部署、應用程式、區域和細分市場進行預測,2024-2030 年