


 |
市場調查報告書
商品編碼
1685714
美國LED照明:市場佔有率分析、產業趨勢與成長預測(2025-2030年)US LED Lighting - Market Share Analysis, Industry Trends & Statistics, Growth Forecasts (2025 - 2030) |
||||||
價格
※ 本網頁內容可能與最新版本有所差異。詳細情況請與我們聯繫。
簡介目錄
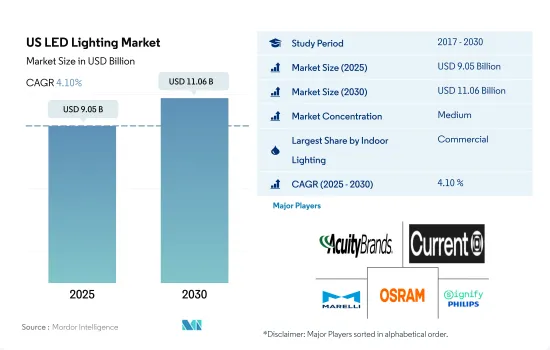
預計2025年美國LED照明市場規模為90.5億美元,到2030年將達到110.6億美元,預測期間(2025-2030年)的複合年成長率為4.10%。
該地區可支配收入的增加、政府投資和商業建築的增加正在推動 LED 照明市場的成長。
- 從價值佔有率來看,2023年商業設施將佔據大部分市場佔有率,其次是工業/倉庫和住宅。推動工業部門韌性成長的主要因素是中國勞動力水準的變化、美國生產的監管負擔較低以及製造業收入相對於美國國內生產總值的高度活力。
- 從2023年的成交量佔有率來看,商業領域將佔多數,其次是住宅領域和工業及倉儲領域。美國對儲存空間的需求前景光明。隨著電子商務的加速發展,倉儲產業可能會看到比以往更多的成長機會。 2020年第三季美國零售電子商務銷售額估計為2,095億美元。與 2019 年第三季相比成長了 36.7%。
- 建設產業是各行各業中一個不斷發展的行業。其中包括私營和商業部門的建築商、承包商和土木工程師。預計從 2019 年到 2029 年,建築和採礦業的就業人數將增加 4%,與總就業人數的平均成長率大致相同。這種成長的部分原因是人口成長導致對新建築、道路和其他結構的需求不斷增加。
- 2022年,美國小型企業數量將達3,320萬家。五家發展最快的新興企業的總部均設在舊金山。 40% 的美國新興企業至少有一名女性擔任領導職務。到2022年,超過65%的中小企業累計盈利。由於上述案例,預計未來幾年室內LED的需求將會成長。
美國LED照明市場趨勢
家庭數量增加推動LED市場成長
- 2021年,美國總人口3.3218億。預計2021年美國總體生育率為每名婦女生育1.66個孩子,比前一年增加0.01個。粗略地說,美國每1000人就有11個新生兒。比前一年增加了0.1。 2021 年美國的出生預期壽命為 76.33 歲。根據這些資料,世界上出生的嬰兒越來越多,人口也越來越多。這意味著需要更多的空間來居住,導致市場擴大。因此,新住宅的建設將導致新型 LED 的銷售增加。
- 2022年,美國共有1.312億個家庭。美國家庭數量比 2020 年(1.2845 億戶)更多。 2022年,美國典型家庭規模為3.13人。 2022年擁有住房的家庭比例將達到65.9%。 2020年,六間及六間住宅佔全住宅的19.3%。家庭成員數量的增加以及房間數量的不斷增加,推動了 LED 照明的普及。
- 電動車 (EV) 市場正在快速擴張,預計未來十年仍將持續擴張。美國電動車銷量已從 2011 年佔所有汽車銷量的 0.2% 成長至 2021 年的 4.6%。從 2011 年到 2021 年的 10 年間,道路上的電動車數量大幅增加,從約 22,000 輛增加到 200 多萬輛。因此,隨著電動車的普及,各種電動車應用中使用的半導體晶片的需求不斷增加,從而導致對 LED 照明的需求增加。
私人住宅增加和政府法規推動LED市場
- 截至 2021 年,美國約有 1.24 億個家庭。 2017年至2021年每戶人口為2.6人,2022年登記的住宅總套數為1.437億套。預計2020年人口將達3.314億,2022年將增至3.332億,成長率為0.6%。此外,房屋自有率高達64.6%。考慮上述案例顯示家庭規模正在減少,需要新的住宅,人口正在成長。基於這些案例,預計LED將得到更廣泛的應用,以滿足家庭照明需求。在美國,可支配收入不斷增加,這反過來又增加了個人的消費能力,使他們能夠花更多的錢來購買新的居住空間。 2021年12月,美國人均收入將達36,430美元,2020年12月為33,740.8美元。與其他開發中國家相比,美國的收入較高。例如,截至2020年,墨西哥的人均收入為2,639.7美元,而加拿大的人均收入為29,330美元,較低。
- 5月份私人住宅開工數量以年度為基礎為163.1萬套。這比 2022 年 5 月的 154.3 萬套高出 5.7%,比 2023 年 4 月修訂後的 134 萬套高出 21.7%。根據 2023 年的新規定,根據《能源政策法》(EPAct)第 179D 條的規定,最高稅額扣抵抵免額將躍升至每平方英尺升級空間 5 美元。 2022 年,免稅額為每平方英尺 1.88 美元(但計劃上漲至每平方英尺 2 美元)。所涵蓋的計劃涉及室內照明、空調和建築外部。預計此類案例將進一步刺激該國對 LED 照明的需求。
美國LED照明產業概況
美國LED照明市場適度整合,前五大企業佔64.62%。該市場的主要企業有:ACUITY BRANDS, INC.、Current Lighting Solutions, LLC.、Marelli Holdings、OSRAM GmbH。以及 Signify(飛利浦)。
其他福利
- Excel 格式的市場預測 (ME) 表
- 3個月的分析師支持
目錄
第1章執行摘要和主要發現
第2章 報告要約
第3章 引言
- 研究假設和市場定義
- 研究範圍
- 調查方法
第4章 產業主要趨勢
- 汽車產量
- 人口
- 人均收入
- 汽車貸款利率
- 充電站數量
- 持有汽車數量
- LED進口總量
- 照明功耗
- #家庭數量
- 道路網路
- LED滲透率
- #體育場數量
- 園藝區
- 法律規範
- 室內照明
- 美國
- 戶外照明
- 美國
- 汽車照明
- 美國
- 室內照明
- 價值鍊和通路分析
第5章市場區隔
- 室內照明
- 農業照明
- 商業照明
- 辦公室
- 零售
- 其他
- 工業/倉庫
- 住宅照明
- 戶外照明
- 公共設施
- 路
- 其他
- 汽車實用照明
- 日間行車燈 (DRL)
- 方向指示器
- 頭燈
- 倒車燈
- 紅綠燈
- 尾燈
- 其他
- 汽車照明
- 二輪車
- 商用車
- 搭乘用車
第6章 競爭格局
- 關鍵策略趨勢
- 市場佔有率分析
- 商業狀況
- 公司簡介
- ACUITY BRANDS, INC.
- Current Lighting Solutions, LLC.
- Dialight
- GRUPO ANTOLIN IRAUSA, SA
- KOITO MANUFACTURING CO., LTD.
- Marelli Holdings Co., Ltd.
- NVC INTERNATIONAL HOLDINGS LIMITED
- OSRAM GmbH.
- Signify(Philips)
- Stanley Electric Co., Ltd.
第7章:CEO面臨的關鍵策略問題
第 8 章 附錄
- 世界概況
- 概述
- 五力分析框架
- 全球價值鏈分析
- 市場動態(DRO)
- 資訊來源及延伸閱讀
- 圖片列表
- 關鍵見解
- 資料包
- 詞彙表
簡介目錄
Product Code: 46621
The US LED Lighting Market size is estimated at 9.05 billion USD in 2025, and is expected to reach 11.06 billion USD by 2030, growing at a CAGR of 4.10% during the forecast period (2025-2030).
The increasing disposable income, government investments, and rising commercial construction in the region drive the growth of led lighting market
- In terms of value share, in 2023, commercial accounted for the majority of the share, followed by industrial and warehouse, and residential. The main factors contributing to the growth of the industrial sector's resilience are changes in labor force levels in China, less regulatory burden for US production than European counterparts, and greater vitality of manufacturing income relative to the United States Gross Domestic Product.
- In terms of volume share, in 2023, commercial accounted for the majority of the share, followed by the residential sector and industrial and warehouse sector. America's need for storage space is advancing toward a brighter future. With the acceleration of e-commerce, the warehousing industry may see more growth opportunities than ever. The US retail e-commerce sales in Q3 2020 are estimated at USD 209.5 billion. This is a 36.7% increase over Q3 2019.
- The construction industry is a growth industry in all areas. These include builders, contractors, and civil engineers in the private and commercial sectors. Employment in the construction and mining sector is expected to increase by 4% from 2019 to 2029, about the same rate as the average for all jobs. Part of the driver of this growth is the increasing demand for new buildings, roads, and other structures due to population growth.
- In 2022, there were 33.2 million small businesses in the United States. The five fast-growing startups are headquartered in San Francisco. 40% of US startups have at least one woman in leadership. Over 65% of small businesses reported profits in 2022. The above instances are expected to create more demand for Indoor LEDs in the coming years.
US LED Lighting Market Trends
Increase in the number of households to drive the growth of the LED market
- In 2021, there were 332.18 million people living in the US as a whole. The overall fertility rate in the US was expected to be 1.66 children per woman in 2021. When compared to the prior year, it went up 0.01. In rough terms, there were 11 live births per 1,000 people in the US. This rose from the previous year by 0.1. In the US, the average life expectancy at birth was 76.33 years in 2021. According to the data, more children are being born and more people in the world, which means that more space will need to be inhabited by people, which will help the market expand. Thus, the sale of new LEDs will rise as a result of the building of the new home.
- The United States had 131.2 million households in 2022. There are now more households in the United States than there were in 2020 (128.45 million). In 2022, there were 3.13 people in the typical American family. The proportion of owner-occupied households in 2022 was 65.9%. In 2020, six or more rooms were present in 19.3% of all occupied dwelling units. The expansion of LEDs will be fueled by an increase in families and the need to accommodate this increase in the typical number of rooms.
- The market for electric cars (EVs) has expanded quickly and is anticipated to do so throughout the next ten years. From just 0.2% of all car sales in 2011 to 4.6% in 2021, electric car sales in the US grew. Over the decade of 2011-21, the number of EVs on the road increased significantly, from around 22,000 to over 2 million. As a result, the need for semiconductor chips used in various EV applications rose along with the popularity of EVs, raising the need for LED illumination.
Increase in the number of private-owned dwellings and government regulations to drive the market for LEDs
- As of 2021, there were around 124 million households in the United States. Person per household between 2017 and 2021 was 2.6 persons, and the total housing units registered were 143.7 million by 2022. Furthermore, the population in 2020 was 331.4 million, which increased to 333.2 million by 2022, representing 0.6% growth. The owner-occupied housing unit rate was 64.6%, which is higher. Considering the above instances, it suggested that the household size is smaller and requires new housing units, and the population is growing, which also represents the same. Such instances are expected to create more LED penetration for the need for illumination in the country. In the United States, disposable income is growing, resulting in the rising spending power of individuals who can spend more on new residential spaces. The United States per Capita income reached USD 36,430 in December 2021, compared with USD 33,740.8 in December 2020. Compared to other developing nations, the US is getting more. For instance, Mexico had a per capita income of USD 2,639.7 as of 2020, and Canada had USD 29,330, which is lower.
- The number of privately owned home starts in May was 1,631,000 on an annual basis. This is 5.7% above the May 2022 rate of 1,543,000 and is 21.7% higher than the revised April 2023 estimate of 1,340,000. As per the Energy Policy Act (EPAct) section 179D, the maximum tax deduction jumped to USD 5 per sq. ft. of upgraded space in 2023 under the new regulations. Which had USD 1.88 per sq. ft. deductions in 2022 (but is set to rise to USD 2.00 per sq. ft.). Eligible projects include those related to interior lighting, HVAC, and building envelopes. Such instances are further expected to surge the demand for LED lighting in the country.
US LED Lighting Industry Overview
The US LED Lighting Market is moderately consolidated, with the top five companies occupying 64.62%. The major players in this market are ACUITY BRANDS, INC., Current Lighting Solutions, LLC., Marelli Holdings Co., Ltd., OSRAM GmbH. and Signify (Philips) (sorted alphabetically).
Additional Benefits:
- The market estimate (ME) sheet in Excel format
- 3 months of analyst support
TABLE OF CONTENTS
1 EXECUTIVE SUMMARY & KEY FINDINGS
2 REPORT OFFERS
3 INTRODUCTION
- 3.1 Study Assumptions & Market Definition
- 3.2 Scope of the Study
- 3.3 Research Methodology
4 KEY INDUSTRY TRENDS
- 4.1 Automotive Production
- 4.2 Population
- 4.3 Per Capita Income
- 4.4 Interest Rate For Auto Loans
- 4.5 Number Of Charging Stations
- 4.6 Number Of Automobile On-road
- 4.7 Total Import Of Leds
- 4.8 Lighting Electricity Consumption
- 4.9 # Of Households
- 4.10 Road Networks
- 4.11 Led Penetration
- 4.12 # Of Stadiums
- 4.13 Horticulture Area
- 4.14 Regulatory Framework
- 4.14.1 Indoor Lighting
- 4.14.1.1 United States
- 4.14.2 Outdoor Lighting
- 4.14.2.1 United States
- 4.14.3 Automotive Lighting
- 4.14.3.1 United States
- 4.14.1 Indoor Lighting
- 4.15 Value Chain & Distribution Channel Analysis
5 MARKET SEGMENTATION (includes market size in Value in USD and Volume, Forecasts up to 2030 and analysis of growth prospects)
- 5.1 Indoor Lighting
- 5.1.1 Agricultural Lighting
- 5.1.2 Commercial
- 5.1.2.1 Office
- 5.1.2.2 Retail
- 5.1.2.3 Others
- 5.1.3 Industrial and Warehouse
- 5.1.4 Residential
- 5.2 Outdoor Lighting
- 5.2.1 Public Places
- 5.2.2 Streets and Roadways
- 5.2.3 Others
- 5.3 Automotive Utility Lighting
- 5.3.1 Daytime Running Lights (DRL)
- 5.3.2 Directional Signal Lights
- 5.3.3 Headlights
- 5.3.4 Reverse Light
- 5.3.5 Stop Light
- 5.3.6 Tail Light
- 5.3.7 Others
- 5.4 Automotive Vehicle Lighting
- 5.4.1 2 Wheelers
- 5.4.2 Commercial Vehicles
- 5.4.3 Passenger Cars
6 COMPETITIVE LANDSCAPE
- 6.1 Key Strategic Moves
- 6.2 Market Share Analysis
- 6.3 Company Landscape
- 6.4 Company Profiles (includes Global level Overview, Market level overview, Core Business Segments, Financials, Headcount, Key Information, Market Rank, Market Share, Products and Services, and analysis of Recent Developments)
- 6.4.1 ACUITY BRANDS, INC.
- 6.4.2 Current Lighting Solutions, LLC.
- 6.4.3 Dialight
- 6.4.4 GRUPO ANTOLIN IRAUSA, S.A.
- 6.4.5 KOITO MANUFACTURING CO., LTD.
- 6.4.6 Marelli Holdings Co., Ltd.
- 6.4.7 NVC INTERNATIONAL HOLDINGS LIMITED
- 6.4.8 OSRAM GmbH.
- 6.4.9 Signify (Philips)
- 6.4.10 Stanley Electric Co., Ltd.
7 KEY STRATEGIC QUESTIONS FOR LED CEOS
8 APPENDIX
- 8.1 Global Overview
- 8.1.1 Overview
- 8.1.2 Porter's Five Forces Framework
- 8.1.3 Global Value Chain Analysis
- 8.1.4 Market Dynamics (DROs)
- 8.2 Sources & References
- 8.3 List of Tables & Figures
- 8.4 Primary Insights
- 8.5 Data Pack
- 8.6 Glossary of Terms
02-2729-4219
+886-2-2729-4219
 2025年LED(發光二極體)霓虹燈全球市場報告2025年雙色發光二極體(LED)環形燈全球市場報告
 全球LEDBrick燈市場全球泛光燈攝影機市場全球LED霓虹燈市場
 2025 年至 2033 年 LED 筒燈市場報告(按應用(改造、零售和酒店、戶外、辦公室、建築、住宅、工業)和地區分類)
 LED 照明和 OLED 照明:市場分析和製造趨勢LED泛光燈市場報告(按應用(改造、零售和酒店、戶外、辦公室、建築、住宅、工業)和地區)2025-2033LED面板燈市場報告(按應用(改造、零售和酒店、戶外、辦公室、建築、住宅、工業)和地區)2025-2033全球LED檯燈市場
▼