


 |
市場調查報告書
商品編碼
1686194
工程塑膠:市場佔有率分析、產業趨勢和成長預測(2024-2029)Engineering Plastics - Market Share Analysis, Industry Trends & Statistics, Growth Forecasts (2024 - 2029) |
||||||
價格
※ 本網頁內容可能與最新版本有所差異。詳細情況請與我們聯繫。
簡介目錄
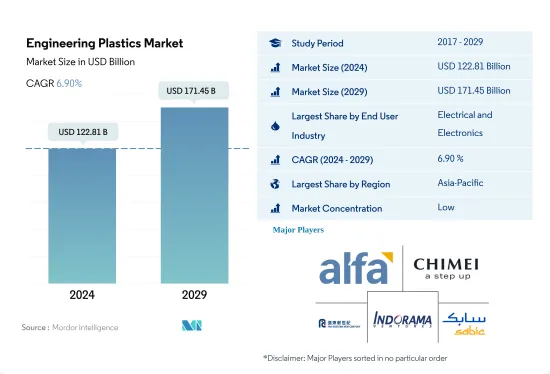
工程塑膠市場規模預計在 2024 年為 1,228.1 億美元,預計到 2029 年將達到 1,714.5 億美元,預測期內(2024-2029 年)的複合年成長率為 6.90%。
包裝在銷售佔有率中占主導地位
- 工程塑膠的應用範圍包括航太工業的內牆板和門以及硬質和軟質包裝。全球工程塑膠市場的成長受到包裝、電氣和電子以及汽車產業的推動。 2022年,包裝將佔工程塑膠市場總銷售額的約24.07%,而電氣和電子將佔約30.93%。
- 由於都市化和家庭結構變化等因素,對功能性、包裝性和便利性食品的需求不斷增加,使包裝產業成為世界上產量最大的終端用戶產業。 2022年全球塑膠包裝產量將達1.34億噸,較2021年成長4.17%。由於消費者對包裝食品和飲料的需求不斷增加,全球對工程塑膠的需求也在增加。
- 電氣電子產業是全球第二大且成長最快的終端用戶產業。 2022年,該產業為工程塑膠市場貢獻了326億美元的收益。在美國,由於對電氣和電子產品的需求不斷成長以及電動車、自動機器人和絕密防禦技術進入市場,預計預測期內(2023-2029年)對電氣和電子產品的需求將以8.09%的複合年成長率成長。
- 航太業是營收成長第二快的產業,複合年成長率為 7.71%。對具有抗衝擊和耐化學性等性能的輕質複合材料的需求正在擴大工程塑膠的應用範圍。
政府措施助力非洲崛起為大市場
- 工程塑膠用於各種行業,包括汽車、包裝、電氣和電子。從全球來看,2022年工程塑膠的銷售額為1,050億美元。
- 2022年亞太地區工程塑膠消費量較2021年成長7.18%,以金額為準最大,達55.62%。這是由包裝和電子電氣行業推動的,這兩個行業分別佔了 18.52% 和 42.25% 的市場佔有率。即食簡便食品需求的不斷成長推動了包裝材料消費量的增加,從而促進了該地區工程塑膠的銷售。電子設備需求的激增是由於企業採用在家工作模式以及人們設立家庭辦公室。
- 非洲是工程塑膠消費成長最快的地區,2022 年工程塑膠以金額為準將比 2021 年成長 7.39%,其中建設產業將發揮主導作用,預計預測期內建築業消費量的複合年成長率將達到 6.56%。預計 2023 年南非的新占地面積將達到約 8,817 萬平方英尺,到 2029 年將達到 1.0169 億平方英尺,從而在預測期內增加該國對工程塑膠的需求。
- 預計預測期內(2023-2029 年)市場複合年成長率為 6.96%,其中電氣和電子產業以金額為準,為 8.09%。先進材料、有機電子產品和塑膠複合材料的使用可以實現智慧製造方法並成為產業發展的推動力。
全球工程塑膠市場趨勢
電子產業的技術進步可能推動成長
- 電子產品技術創新的快速步伐推動著對更新、更快的電氣和電子產品的持續需求。 2022年全球電氣電子產品銷售額將達到5.807兆美元,其中亞太地區佔74%的市場佔有率,其次是歐洲,佔13%。預計預測期內全球電氣和電子設備市場複合年成長率將達到 6.61%。
- 2018年,亞太地區經濟成長強勁,受中國、韓國、日本、印度和東南亞國協快速工業化的推動。 2020年,受疫情影響,晶片短缺、供應鏈效率低等因素導致全球電子電氣生產放緩,營收與前一年同期比較增僅0.1%。由於疫情期間人們被迫待在室內,對遠距工作和家庭娛樂消費性電子產品的需求推動了這一成長。
- 預測期內,對數位化、機器人、虛擬實境、擴增實境、物聯網 (IoT) 和 5G 連接等先進技術的需求預計將成長。預計 2027 年全球電氣和電子設備產量將成長 5.9%。由於技術進步,預測期內對消費性電子產品的需求預計將上升。例如,預計2027年全球消費性電子產業收益將達到約9,046億美元,而2023年將達到7,191億美元。因此,預計技術發展將在預測期內引領對電氣和電子產品的需求。
工程塑膠行業概況
工程塑膠市場分散,前五大企業佔22.10%的市場。市場的主要企業有:Alfa SAB de CV、奇美、遠東新世紀股份有限公司、Indorama Ventures Public Company Limited 和 SABIC(按字母順序排列)。
其他福利
- Excel 格式的市場預測 (ME) 表
- 3個月的分析師支持
目錄
第1章執行摘要和主要發現
第2章 報告要約
第3章 引言
- 研究假設和市場定義
- 研究範圍
- 調查方法
第4章 產業主要趨勢
- 最終用戶趨勢
- 航太
- 車
- 建築與施工
- 電氣和電子
- 包裝
- 進出口趨勢
- 氟樹脂交易
- 聚醯胺(PA)貿易
- 聚碳酸酯(PC)貿易
- 聚對苯二甲酸乙二酯(PET)貿易
- 聚甲基丙烯酸甲酯(PMMA)貿易
- 聚甲醛(POM)貿易
- 苯乙烯共聚物(ABS和SAN)貿易
- 價格趨勢
- 回收概述
- 聚醯胺(PA)回收趨勢
- 聚碳酸酯(PC)回收趨勢
- 聚對苯二甲酸乙二醇酯(PET)的回收趨勢
- 苯乙烯共聚物(ABS、SAN)的回收趨勢
- 法律規範
- 阿根廷
- 澳洲
- 巴西
- 加拿大
- 中國
- EU
- 印度
- 日本
- 馬來西亞
- 墨西哥
- 奈及利亞
- 俄羅斯
- 沙烏地阿拉伯
- 南非
- 韓國
- 阿拉伯聯合大公國
- 英國
- 美國
- 價值鍊和通路分析
第5章市場區隔
- 最終用戶產業
- 航太
- 車
- 建築與施工
- 電氣和電子
- 工業/機械
- 包裝
- 其他最終用戶產業
- 樹脂類型
- 氟樹脂
- 依亞型
- 乙烯-四氟乙烯(ETFE)
- 氟化乙丙烯 (FEP)
- 聚四氟乙烯(PTFE)
- 聚氟乙烯(PVF)
- 聚二氟亞乙烯(PVDF)
- 其他子樹脂類型
- 液晶聚合物(LCP)
- 聚醯胺(PA)
- 依樹脂類型分
- 芳香聚醯胺
- 聚醯胺(PA)6
- 聚醯胺(PA)66
- 聚鄰苯二甲醯胺
- 聚丁烯對苯二甲酸酯(PBT)
- 聚碳酸酯(PC)
- 聚醚醚酮(PEEK)
- 聚對苯二甲酸乙二醇酯(PET)
- 聚醯亞胺(PI)
- 聚甲基丙烯酸甲酯(PMMA)
- 聚甲醛(POM)
- 苯乙烯共聚物(ABS和SAN)
- 氟樹脂
- 地區
- 非洲
- 按國家
- 奈及利亞
- 南非
- 其他非洲國家
- 亞太地區
- 按國家
- 澳洲
- 中國
- 印度
- 日本
- 馬來西亞
- 韓國
- 其他亞太地區
- 歐洲
- 按國家
- 法國
- 德國
- 義大利
- 俄羅斯
- 英國
- 其他歐洲國家
- 中東
- 按國家
- 沙烏地阿拉伯
- 阿拉伯聯合大公國
- 其他中東地區
- 北美洲
- 按國家
- 加拿大
- 墨西哥
- 美國
- 南美洲
- 按國家
- 阿根廷
- 巴西
- 南美洲其他地區
- 非洲
第6章競爭格局
- 關鍵策略趨勢
- 市場佔有率分析
- 商業狀況
- 公司簡介.
- Alfa SAB de CV
- BASF SE
- Celanese Corporation
- CHIMEI
- Covestro AG
- Dongyue Group
- DuPont
- Far Eastern New Century Corporation
- Indorama Ventures Public Company Limited
- LG Chem
- Mitsubishi Chemical Corporation
- SABIC
- Solvay
- Toray Industries, Inc.
- Victrex
第7章:CEO面臨的關鍵策略問題
第 8 章 附錄
- 世界概況
- 概述
- 五力分析框架(產業吸引力分析)
- 全球價值鏈分析
- 市場動態(DRO)
- 資訊來源及延伸閱讀
- 圖片列表
- 關鍵見解
- 資料包
- 詞彙表
簡介目錄
Product Code: 50285
The Engineering Plastics Market size is estimated at 122.81 billion USD in 2024, and is expected to reach 171.45 billion USD by 2029, growing at a CAGR of 6.90% during the forecast period (2024-2029).
Packaging to dominate the volume share in the market
- Engineering plastics have applications ranging from interior wall panels and doors in the aerospace industry to rigid and flexible packaging. The packaging, electrical and electronics, and automotive industries drive the growth of the global engineering plastics market. Packaging and electrical and electronics accounted for around 24.07% and 30.93%, respectively, of the overall engineering plastics market revenue in 2022.
- As a result of factors such as urbanization and changing family demographics, the packaging industry is the world's largest end-user industry in terms of volume, in line with the growing demand for functional, prepackaged, and convenient food products. Global plastic packaging production witnessed a volume of 134 million tons in 2022, 4.17% higher compared to 2021. The demand for engineering plastics globally increased owing to the increasing consumer demand for packaged food and beverages.
- The electrical and electronics industry is the second-largest and fastest-growing end-user industry globally. The industry generated a revenue of USD 32.6 billion in 2022 in the engineering plastics market. In the United States, the growing demand for electrical and electronics products and the entry of electric vehicles, autonomous robots, and top-secret defense technologies in the market are expected to increase the demand for electrical and electronics products at a CAGR of 8.09% during the forecast period (2023-2029).
- The aerospace industry is the second fastest-growing industry by revenue, with a CAGR of 7.71%. The application of engineering plastics is growing due to the need for lightweight composite materials with properties like impact and chemical resistance.
Africa emerging as a greater market owing to government initiatives
- Engineering plastics find applications in various industries, such as automotive, packaging, and electrical and electronics. Engineering plastics at the global level had a revenue of USD 105 billion in 2022.
- Engineering plastic consumption in Asia-Pacific witnessed a growth of 7.18%, by value, in 2022 compared to 2021 and had the largest share of 55.62%. This was attributed to the packaging and electrical and electronics industries, which held 18.52% and 42.25% of the market shares, respectively, by value. With the rising demand for ready-to-eat convenience food, the consumption of packaging materials has increased, bolstering the sales of engineering plastics in the region. The surge in demand for electronic devices is a consequence of companies adopting work-from-home models and people setting up home offices.
- Africa is the fastest-growing region for the consumption of engineering plastics, and it witnessed a growth of 7.39% in terms of value in 2022 compared to 2021, led by the building and construction industry, which is expected to record a CAGR of 6.56%, by volume, during the forecast period. South Africa is expected to have around 88.17 million sq. ft of new floor area in 2023, and it is forecast to reach 101.69 million sq. ft by 2029, thereby increasing the demand for engineering plastics in the country during the forecast period.
- The market is expected to record a CAGR of 6.96% during the forecast period (2023-2029), with the electrical and electronics industry reporting the highest CAGR of 8.09% by value. Using advanced materials, organic electronics, and plastic composites may enable smart manufacturing practices and work as growth drivers for the industry.
Global Engineering Plastics Market Trends
Technological advancements in electronics industry may foster the growth
- The rapid pace of technological innovation in electronic products is driving the consistent demand for new and fast electrical and electronic products. In 2022, the global revenue of electrical and electronics stood at USD 5,807 billion, with Asia-Pacific holding a 74% market share, followed by Europe with a 13% share. The global electrical and electronics market is expected to record a CAGR of 6.61% during the forecast period.
- In 2018, the Asia-Pacific region witnessed strong economic growth owing to rapid industrialization in China, South Korea, Japan, India, and ASEAN countries. In 2020, due to the pandemic, there was a slowdown in global electrical and electronics production due to the shortage of chips and inefficiencies in the supply chain, which led to a stagnant growth rate of 0.1% in revenue compared to the previous year. This growth was driven by the demand for consumer electronics for remote working and home entertainment as people were forced to remain indoors during the pandemic.
- The demand for advanced technologies, such as digitalization, robotics, virtual reality, augmented reality, IoT (Internet of Things), and 5G connectivity, is expected to grow during the forecast period. Global electrical and electronics production is expected to register a growth rate of 5.9% in 2027. As a result of technological advancements, the demand for consumer electronics is expected to rise during the forecast period. For instance, the global consumer electronics industry is projected to witness a revenue reach of around USD 904.6 billion in 2027, compared to USD 719.1 billion in 2023. As a result, technological development is projected to lead the demand for electrical and electronic products during the forecast period.
Engineering Plastics Industry Overview
The Engineering Plastics Market is fragmented, with the top five companies occupying 22.10%. The major players in this market are Alfa S.A.B. de C.V., CHIMEI, Far Eastern New Century Corporation, Indorama Ventures Public Company Limited and SABIC (sorted alphabetically).
Additional Benefits:
- The market estimate (ME) sheet in Excel format
- 3 months of analyst support
TABLE OF CONTENTS
1 EXECUTIVE SUMMARY & KEY FINDINGS
2 REPORT OFFERS
3 INTRODUCTION
- 3.1 Study Assumptions & Market Definition
- 3.2 Scope of the Study
- 3.3 Research Methodology
4 KEY INDUSTRY TRENDS
- 4.1 End User Trends
- 4.1.1 Aerospace
- 4.1.2 Automotive
- 4.1.3 Building and Construction
- 4.1.4 Electrical and Electronics
- 4.1.5 Packaging
- 4.2 Import And Export Trends
- 4.2.1 Fluoropolymer Trade
- 4.2.2 Polyamide (PA) Trade
- 4.2.3 Polycarbonate (PC) Trade
- 4.2.4 Polyethylene Terephthalate (PET) Trade
- 4.2.5 Polymethyl Methacrylate (PMMA) Trade
- 4.2.6 Polyoxymethylene (POM) Trade
- 4.2.7 Styrene Copolymers (ABS and SAN) Trade
- 4.3 Price Trends
- 4.4 Recycling Overview
- 4.4.1 Polyamide (PA) Recycling Trends
- 4.4.2 Polycarbonate (PC) Recycling Trends
- 4.4.3 Polyethylene Terephthalate (PET) Recycling Trends
- 4.4.4 Styrene Copolymers (ABS and SAN) Recycling Trends
- 4.5 Regulatory Framework
- 4.5.1 Argentina
- 4.5.2 Australia
- 4.5.3 Brazil
- 4.5.4 Canada
- 4.5.5 China
- 4.5.6 EU
- 4.5.7 India
- 4.5.8 Japan
- 4.5.9 Malaysia
- 4.5.10 Mexico
- 4.5.11 Nigeria
- 4.5.12 Russia
- 4.5.13 Saudi Arabia
- 4.5.14 South Africa
- 4.5.15 South Korea
- 4.5.16 United Arab Emirates
- 4.5.17 United Kingdom
- 4.5.18 United States
- 4.6 Value Chain & Distribution Channel Analysis
5 MARKET SEGMENTATION (includes market size in Value in USD and Volume, Forecasts up to 2029 and analysis of growth prospects)
- 5.1 End User Industry
- 5.1.1 Aerospace
- 5.1.2 Automotive
- 5.1.3 Building and Construction
- 5.1.4 Electrical and Electronics
- 5.1.5 Industrial and Machinery
- 5.1.6 Packaging
- 5.1.7 Other End-user Industries
- 5.2 Resin Type
- 5.2.1 Fluoropolymer
- 5.2.1.1 By Sub Resin Type
- 5.2.1.1.1 Ethylenetetrafluoroethylene (ETFE)
- 5.2.1.1.2 Fluorinated Ethylene-propylene (FEP)
- 5.2.1.1.3 Polytetrafluoroethylene (PTFE)
- 5.2.1.1.4 Polyvinylfluoride (PVF)
- 5.2.1.1.5 Polyvinylidene Fluoride (PVDF)
- 5.2.1.1.6 Other Sub Resin Types
- 5.2.2 Liquid Crystal Polymer (LCP)
- 5.2.3 Polyamide (PA)
- 5.2.3.1 By Sub Resin Type
- 5.2.3.1.1 Aramid
- 5.2.3.1.2 Polyamide (PA) 6
- 5.2.3.1.3 Polyamide (PA) 66
- 5.2.3.1.4 Polyphthalamide
- 5.2.4 Polybutylene Terephthalate (PBT)
- 5.2.5 Polycarbonate (PC)
- 5.2.6 Polyether Ether Ketone (PEEK)
- 5.2.7 Polyethylene Terephthalate (PET)
- 5.2.8 Polyimide (PI)
- 5.2.9 Polymethyl Methacrylate (PMMA)
- 5.2.10 Polyoxymethylene (POM)
- 5.2.11 Styrene Copolymers (ABS and SAN)
- 5.2.1 Fluoropolymer
- 5.3 Region
- 5.3.1 Africa
- 5.3.1.1 By Country
- 5.3.1.1.1 Nigeria
- 5.3.1.1.2 South Africa
- 5.3.1.1.3 Rest of Africa
- 5.3.2 Asia-Pacific
- 5.3.2.1 By Country
- 5.3.2.1.1 Australia
- 5.3.2.1.2 China
- 5.3.2.1.3 India
- 5.3.2.1.4 Japan
- 5.3.2.1.5 Malaysia
- 5.3.2.1.6 South Korea
- 5.3.2.1.7 Rest of Asia-Pacific
- 5.3.3 Europe
- 5.3.3.1 By Country
- 5.3.3.1.1 France
- 5.3.3.1.2 Germany
- 5.3.3.1.3 Italy
- 5.3.3.1.4 Russia
- 5.3.3.1.5 United Kingdom
- 5.3.3.1.6 Rest of Europe
- 5.3.4 Middle East
- 5.3.4.1 By Country
- 5.3.4.1.1 Saudi Arabia
- 5.3.4.1.2 United Arab Emirates
- 5.3.4.1.3 Rest of Middle East
- 5.3.5 North America
- 5.3.5.1 By Country
- 5.3.5.1.1 Canada
- 5.3.5.1.2 Mexico
- 5.3.5.1.3 United States
- 5.3.6 South America
- 5.3.6.1 By Country
- 5.3.6.1.1 Argentina
- 5.3.6.1.2 Brazil
- 5.3.6.1.3 Rest of South America
- 5.3.1 Africa
6 COMPETITIVE LANDSCAPE
- 6.1 Key Strategic Moves
- 6.2 Market Share Analysis
- 6.3 Company Landscape
- 6.4 Company Profiles (includes Global Level Overview, Market Level Overview, Core Business Segments, Financials, Headcount, Key Information, Market Rank, Market Share, Products and Services, and Analysis of Recent Developments).
- 6.4.1 Alfa S.A.B. de C.V.
- 6.4.2 BASF SE
- 6.4.3 Celanese Corporation
- 6.4.4 CHIMEI
- 6.4.5 Covestro AG
- 6.4.6 Dongyue Group
- 6.4.7 DuPont
- 6.4.8 Far Eastern New Century Corporation
- 6.4.9 Indorama Ventures Public Company Limited
- 6.4.10 LG Chem
- 6.4.11 Mitsubishi Chemical Corporation
- 6.4.12 SABIC
- 6.4.13 Solvay
- 6.4.14 Toray Industries, Inc.
- 6.4.15 Victrex
7 KEY STRATEGIC QUESTIONS FOR ENGINEERING PLASTICS CEOS
8 APPENDIX
- 8.1 Global Overview
- 8.1.1 Overview
- 8.1.2 Porter's Five Forces Framework (Industry Attractiveness Analysis)
- 8.1.3 Global Value Chain Analysis
- 8.1.4 Market Dynamics (DROs)
- 8.2 Sources & References
- 8.3 List of Tables & Figures
- 8.4 Primary Insights
- 8.5 Data Pack
- 8.6 Glossary of Terms
02-2729-4219
+886-2-2729-4219
 2025-2033年工程塑膠市場報告(按類型、性能參數、應用和地區)
 中國工程塑膠:市場佔有率分析、產業趨勢與統計、成長預測(2024-2029)中東工程塑膠:市場佔有率分析、產業趨勢和成長預測(2024-2029)亞太工程塑膠:市場佔有率分析、產業趨勢與統計、成長預測(2024-2029 年)北美工程塑膠:市場佔有率分析、行業趨勢和統計、成長預測(2024-2029 年)南美工程塑膠:市場佔有率分析、行業趨勢和統計、成長預測(2024-2029 年)印度工程塑膠市場:市場佔有率分析、產業趨勢與統計、成長預測(2024-2029)德國工程塑膠:市場佔有率分析、行業趨勢和統計、成長預測(2024-2029 年)日本工程塑膠:市場佔有率分析、產業趨勢與成長預測(2024-2029年)歐洲工程塑膠:市場佔有率分析、行業趨勢和統計、成長預測(2024-2029 年)
▼