


 |
市場調查報告書
商品編碼
1854905
全球託管網路服務市場(至2030年)按類型(託管區域網路、託管Wi-Fi、託管廣域網路、託管VPN、網路監控、託管NFV、託管網路安全)、產業(銀行、金融服務和保險、IT與通訊、製造業)和地區分類Managed Network Services Market by Type (Managed LAN, Managed Wi-Fi, Managed WAN, Managed VPN, Network Monitoring, Managed NFV, Managed Network Security), Vertical (BFSI, IT & Telecom, Manufacturing), and Region - Global Forecast to 2030 |
||||||
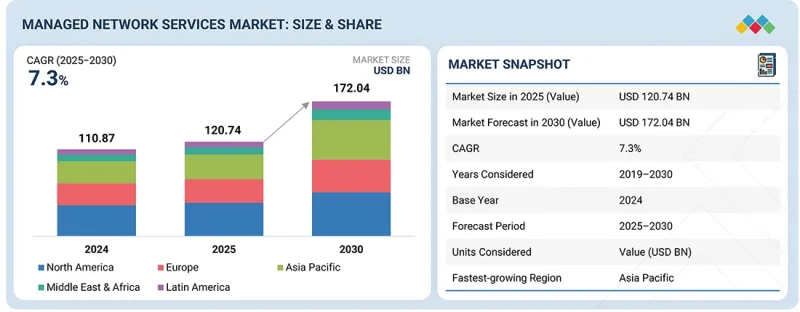
預計到 2025 年,託管網路服務市場規模將達到 1,207.4 億美元,到 2030 年將達到 1,720.4 億美元,預測期內複合年成長率為 7.3%。
| 調查範圍 | |
|---|---|
| 調查年度 | 2019-2030 |
| 基準年 | 2024 |
| 預測期 | 2025-2030 |
| 考慮單位 | 金額(美元) |
| 部分 | 類型、主機安全、產業、地區 |
| 目標區域 | 北美洲、歐洲、亞太地區、中東和非洲、拉丁美洲 |
企業擴大轉向託管網路服務,以應對全球連接、混合辦公室和雲端轉型帶來的複雜性,而市場現在由提供整合效能管理、安全性和自動化的綜合解決方案的服務供應商所驅動。
隨著數位生態系統在各行各業的擴展,企業越來越依賴值得信賴的合作夥伴來建立擴充性、始終運作的網路。提供靈活服務模式和基於績效收費系統的供應商正日益受到青睞。託管網路服務正成為敏捷營運的關鍵推動因素,它將連接性、雲端整合和網路安全融為一體,並逐漸轉向智慧、預測性和自適應的網路管理。
“按類型分類,預計在預測期內,託管廣域網部分將是最大的。”
企業正迅速轉向託管廣域網路服務,以簡化複雜且分散式的網路架構,並確保應用程式效能的穩定性。隨著混合辦公模式的興起、SaaS 的普及以及全球化進程的推進,提供安全、雲端最佳化連接的託管廣域網路服務供應商的重要性日益凸顯。
現今的託管廣域網路服務涵蓋動態流量控制、即時分析和基於策略的自動化,以滿足企業日益成長的效能需求。這項技術也是人工智慧工作負載、邊緣運算和物聯網生態系統的支柱,並有望成為全球下一代數位化企業發展的基礎。
“預計在預測期內,醫療保健行業將實現最快的成長速度。”
託管網路服務透過在醫院、診所、遠端醫療機構等之間提供安全、高效能的連接,正在變革醫療服務模式。 2023年,克利夫蘭診所和Verizon與愛立信合作,在俄亥俄州門托醫院部署了5G就緒網路,從而支援先進的臨床工作流程和遠端醫療。此案例展示了託管專用網路如何支援低延遲應用和跨醫療機構的數位化協作。
醫療保健產業的市場擴張主要受電子健康記錄數位化、連網醫療設備普及以及需要持續運作的關鍵醫療營運等因素所驅動。隨著醫院採用智慧基礎設施和人工智慧診斷技術,在複雜的醫療環境中,對資料完整性、即時監控和整合網路管治的需求日益成長,這進一步推動了對託管服務的需求。
“亞太地區將是成長最快的地區,而北美預計在預測期內仍將是最大的市場。”
亞太市場正經歷快速成長,這主要得益於雲端運算的普及、遠距辦公的擴展以及政府主導的數位轉型計劃。企業擴大將網路管理外包,以提高效率、增強視覺性並加強分散式環境中的安全性。 2024年,新加坡電信(Singtel)將其託管網路和保全服務擴展全部區域,提供網路智慧、託管SD-WAN和持續監控等服務。
此舉表明,在日益複雜的數位化環境中,企業對能夠提供端到端連接和安全保障的可靠合作夥伴的需求日益成長。物聯網的普及和資料中心連接性的提升,推動了對擴充性、靈活性和人工智慧驅動模式的需求。對於那些尋求在創新、安全性和營運彈性之間取得平衡的企業而言,託管網路服務勢必成為不可或缺的一部分。
同時,北美佔據了最大的市場佔有率。隨著企業尋求簡化網路複雜性並提高網路彈性,北美市場正快速成長。多重雲端環境和分散式辦公模式促使企業優先考慮能夠統一網路效能、視覺性和網路安全性的託管解決方案。
為了實現大規模敏捷且可預測的營運,服務供應商正在加大對人工智慧和軟體定義網路 (SDN) 技術的投資。北美在將智慧、自動化和策略主導的編配融入託管服務方面處於全球領先地位。此外,企業也擴大採用基本契約,在不擴充自身營運團隊的情況下,尋求在性能、安全性和可靠性方面取得可衡量的成果。
本報告調查了全球託管網路服務市場,並提供了市場概況、影響市場成長的各種因素分析、技術和專利趨勢、法律制度、案例研究、市場規模趨勢和預測、按各個細分市場、地區/主要國家/地區進行的詳細分析、競爭格局以及主要企業的概況。
目錄
第1章 引言
第2章調查方法
第3章執行摘要
第4章重要考察
第5章 市場概覽與產業趨勢
- 市場動態
- 促進要素
- 抑制因素
- 機會
- 任務
- 託管網路服務市場:簡史
- 價值鏈分析
- 生態系分析
- 案例研究分析
- 波特五力模型
- 主要相關利益者和採購標準
- 專利分析
- 影響客戶業務的趨勢/干擾因素
- 定價分析
- 技術分析
- 監管狀態
- 2025-2026 年重要會議與活動
- 技術藍圖
- 最佳實踐
- 當前和新興的經營模式經營模式
- 託管網路服務市場中使用的工具、框架和技術
- 投資和資金籌措方案
- 人工智慧/生成式人工智慧的影響
- 2025年美國關稅的影響
6. 按類型分類的託管網路服務市場
- 管理型區域網路
- 管理型 Wi-Fi
- 託管 VPN
- 託管廣域網
- 網路監控
- 託管式NFV
- 託管網路安全
7. 託管網路安全市場
- 託管防火牆
- 託管式入侵偵測/防禦系統
- 其他
8. 按行業垂直分類的託管網路服務市場
- 銀行、金融服務和保險
- 零售與電子商務
- 資訊科技/通訊
- 製造業
- 政府
- 教育
- 醫療保健
- 媒體與娛樂
- 其他
9. 按地區分類的託管網路服務市場
- 北美洲
- 北美:宏觀經濟展望
- 美國
- 加拿大
- 歐洲
- 歐洲:宏觀經濟展望
- 英國
- 德國
- 法國
- 義大利
- 西班牙
- 其他
- 亞太地區
- 亞太地區:宏觀經濟展望
- 中國
- 日本
- 印度
- 澳洲和紐西蘭
- 韓國
- 新加坡
- 其他
- 中東和非洲
- 中東與非洲:宏觀經濟展望
- 中東
- 非洲
- 拉丁美洲
- 拉丁美洲:宏觀經濟展望
- 巴西
- 墨西哥
- 其他
第10章 競爭格局
- 主要參與企業的策略/優勢
- 收入分析
- 市佔率分析
- 品牌/產品對比
- 估值和財務指標
- 公司評估矩陣:主要企業
- 公司估值矩陣:Start-Ups/中小企業
- 競爭場景
第11章 公司簡介
- 主要企業
- CISCO
- AT&T
- VERIZON
- NTT
- DEUTSCHE TELEKOM
- VODAFONE
- ORANGE
- ERICSSON
- HUAWEI
- TELEFONICA
- 其他公司
- LUMEN TECHNOLOGIES
- FUJITSU
- TATA COMMUNICATIONS
- TELSTRA
- COLT TECHNOLOGY SERVICES
- NOKIA
- SINGTEL
- GTT COMMUNICATIONS
- SIFY TECHNOLOGIES
- DXC TECHNOLOGY
- WIPRO
- COMARCH
- COMMSCOPE
- 中小企業/Start-Ups
- ALKIRA
- FLEXIWAN
- BIGLEAF NETWORKS
- GRAPHIANT
- KENTIK
- OMAN DATA PARK
- KUBUS
- EIL GLOBAL
- SYSTAL TECHNOLOGY SOLUTIONS
- METTEL
第12章:鄰近及相關市場
第13章附錄
The managed network services market is estimated to be USD 120.74 billion in 2025 to USD 172.04 billion by 2030, at a CAGR of 7.3%, during the forecast period.
| Scope of the Report | |
|---|---|
| Years Considered for the Study | 2019-2030 |
| Base Year | 2024 |
| Forecast Period | 2025-2030 |
| Units Considered | Value (USD) Million/Billion |
| Segments | By Type, Managed Network Security, Vertical, and Region |
| Regions covered | North America, Europe, Asia Pacific, Middle East & Africa, and Latin America |
Enterprises are increasingly turning to managed network services as they navigate the complexity of global connectivity, hybrid work, and cloud transformation. The market is gaining traction as providers deliver comprehensive solutions that integrate performance management, security, and automation.
The rise of digital ecosystems across industries has pushed demand for scalable, always-on networks managed by trusted partners. Providers offering flexible service models and outcome-based pricing are witnessing growing adoption. Managed network services will emerge as key drivers of agile operations, bridging connectivity, cloud integration, and cybersecurity into a unified service experience. The emphasis will shift toward intelligent, predictive, and adaptive network management.
Managed network services face various restraints and challenges that slow adoption and complicate operations. Integrating and modernizing legacy on-premises infrastructure with cloud-native SD-WAN and SASE architecture is technically and financially demanding, while multi-cloud and edge deployments create fragmentation that makes consistent visibility, quality of service, and policy enforcement difficult. Security and data privacy compliance across jurisdictions adds legal and operational overhead, and rising telemetry volumes strain monitoring, analytics, and storage.
"Managed WAN segment is expected to contribute to the largest market size during the forecast period"
Enterprises are rapidly transitioning to managed WAN services to simplify their complex, distributed network infrastructures and ensure consistent application performance. The rise of hybrid work, SaaS adoption, and global operations is driving the need for managed WAN providers that can deliver secure, cloud-optimized connectivity.
Managed WAN offerings now include dynamic traffic steering, real-time analytics, and policy-based automation, helping enterprises meet growing performance expectations. Managed WAN is expected to play a crucial role in supporting AI-driven workloads, edge computing, and IoT ecosystems, establishing them as the backbone of modern digital enterprise operations worldwide.
"Healthcare segment among types is expected to register the fastest growth rate during the forecast period"
Managed network services are transforming healthcare delivery by providing secure, high-performance connectivity across hospitals, clinics, and remote care facilities. In 2023, the Cleveland Clinic and Verizon, in partnership with Ericsson, deployed a 5G-enabled network to support advanced clinical workflows and telemedicine services at the Mentor Hospital in Ohio. This demonstrates how managed private networks are supporting low-latency applications and digital collaboration in patient care.
Market expansion is being fueled by the growing digitization of health records, wider use of connected medical devices, and the need for continuous uptime in mission-critical healthcare operations. As hospitals pursue smart infrastructure and AI-driven diagnostics, demand for managed services will be driven by requirements for data integrity, real-time monitoring, and unified network governance in complex healthcare environments.
"Asia Pacific is expected to be the fastest-growing region, while North America will hold the largest market during the forecast period"
The managed network services market in the Asia Pacific is expanding rapidly, fueled by strong enterprise cloud adoption, the rise of remote operations, and government-led digital transformation projects. Companies are outsourcing network management to improve efficiency, enhance visibility, and secure distributed environments. In 2024, Singtel expanded its managed network and cybersecurity services across the Asia Pacific region, combining network intelligence, managed SD WAN, and continuous monitoring for enterprise customers.
This reflects the growing need for trusted partners who can deliver end-to-end connectivity and protection in a complex digital landscape. With the rise of IoT deployments and data center interconnections, regional growth will be shaped by the demand for scalable, flexible, and AI-driven service models. During the forecast period, the managed network services are expected to be essential for enterprises seeking to balance innovation, security, and operational resilience in an increasingly interconnected economy.
The North America region is expected to be the largest region in the managed network services market. It is growing rapidly as enterprises seek to simplify network complexity and improve resilience. With multi-cloud environments and distributed workforces, companies are prioritizing managed solutions that integrate network performance, visibility, and cybersecurity.
Providers are investing heavily in AI and software-defined capabilities to deliver agility and predictability at scale. North America will lead in embedding intelligence, automation, and policy-driven orchestration into managed services. Enterprises will increasingly adopt outcome-based contracts, expecting providers to deliver measurable performance, security, and reliability without expanding in-house operational teams.
Breakdown of primary interviews
The study contains insights from various industry experts, from solution vendors to Tier 1 companies. The breakdown of the primary interviews is as follows:
- By Company Type: Tier 1 - 20%, Tier 2 - 10%, and Tier 3 - 70%
- By Designation: C-level - 9%, Directors - 18%, and Others - 73%
- By Region: North America - 55%, Europe - 9%, Asia Pacific - 36%
The major players in the managed network services market are Cisco (US), AT&T (US), Verizon (US), NTT Data (Japan), Deutsche Telekom (Germany), Huawei (China), Orange (France), Vodafone (UK), Ericsson (Sweden), Telefonica (Spain), Singtel (Singapore), Telstra (Australia), Lumen Technologies (US), Fujitsu (Japan), Tata Communications (India), Colt Technology Services (UK), Nokia (Finland), GTT Communications (US), Sify Technologies (India), DXC Technology (US), Wipro (India), Comarch (Poland), Commscope (US), Alkira (US), Kentik (US), flexiWAN (Israel), Bigleaf Networks (US), Graphiant (US), Oman Data Park (Oman), Kubus (UK), EIL Global (Australia), Systal Technology Solutions (Scotland), and MetTel (US). These players have adopted various growth strategies, such as partnerships, agreements, and collaborations, product launches, product enhancements, and acquisitions, to expand their footprint in the managed network services market.
Research Coverage
The market study covers the managed network services market size across different segments. It aims at estimating the market size and the growth potential across various segments, including Usage Scenario (Further-enhanced Mobile Broadband (FEMBB), Extremely Reliable And Low-latency Communications (ERLLC), Long-distance and High-mobility Communications (LDHMC), Ultra-massive Machine Type Communications (UMMTC), Extremely Low-power Communications (ELPC)), Enterprise Application (Holographic Communications, Tactile/Haptic Internet, Fully Automated Driving, Industry 5.0, Internet Of Bio-Nano-Things, Other Enterprise Applications (Deep-sea Sightseeing and Space Travel)), Communication Infrastructure (Cellular, Broaband, Fixed), Vertical (Consumer and Enterprise (Manufacturing, Healthcare & Life Sciences, Automotive, Media & Entertainment, Aerospace & Defense, Other Enterprises [Retail & Ecommerce, Energy & Utilities, Education])), and Region (North America, Europe, Asia Pacific, Middle East & Africa, and Latin America). The study includes an in-depth competitive analysis of the leading market players, their company profiles, key observations related to product and business offerings, recent developments, and market strategies.
Key Benefits of Buying the Report
The report will help market leaders and new entrants with information on the closest approximations of the global managed network services market's revenue numbers and subsegments. It will also help stakeholders understand the competitive landscape and gain more insights to position their businesses better and plan suitable go-to-market strategies. Moreover, the report will provide stakeholders with insights into the market's pulse, as well as information on key market drivers, restraints, challenges, and opportunities.
The report provides insights into the following points:
- Analysis of key drivers (technological advancements, deliver extreme performance and highly advanced use cases, growing metaverse traction), restraints (high initial cost, limited spectrum availability, regulatory and standardization challenges, terahertz (THz) frequency challenges and energy efficiency concerns), opportunities (transformative applications, global connectivity, detailed sensing and high-precision positioning technologies offered by 6g networks), and challenges (security and privacy, ethical and social implications, environmental concerns) influencing the growth of the managed network services market
- Product Development/Innovation: Detailed insights into upcoming technologies, research & development activities, and new product & service launches in the managed network services market
- Market Development: Comprehensive information about lucrative markets and analyzes the managed network services market across various regions
- Market Diversification: Exhaustive information about new products & services, untapped geographies, recent developments, and investments in the managed network services market
- Competitive Assessment: In-depth assessment of market shares, growth strategies, and service offerings of leading players, such as Cisco (US), AT&T (US), Verizon (US), NTT Data (Japan), Deutsche Telekom (Germany), Huawei (China), Orange (France), Vodafone (UK), Ericsson (Sweden), Telefonica (Spain), Singtel (Singapore), Telstra (Australia), Lumen Technologies (US), Fujitsu (Japan), Tata Communications (India), Colt Technology Services (UK), Nokia (Finland), GTT Communications (US), Sify Technologies (India), DXC Technology (US), Wipro (India), Comarch (Poland), Commscope (US), Alkira (US), Kentik (US), flexiWAN (Israel), Bigleaf Networks (US), Graphiant (US), Oman Data Park (Oman), Kubus (UK), EIL Global (Australia), Systal Technology Solutions (Scotland), and MetTel (US)
TABLE OF CONTENTS
1 INTRODUCTION
- 1.1 STUDY OBJECTIVES
- 1.2 MARKET DEFINITION
- 1.3 MARKET SCOPE
- 1.3.1 MARKET SEGMENTATION AND REGIONAL SCOPE
- 1.3.2 INCLUSIONS AND EXCLUSIONS
- 1.3.3 YEARS CONSIDERED
- 1.4 CURRENCY CONSIDERED
- 1.5 STAKEHOLDERS
- 1.6 SUMMARY OF CHANGES
2 RESEARCH METHODOLOGY
- 2.1 RESEARCH DATA
- 2.1.1 SECONDARY DATA
- 2.1.1.1 Key data from secondary sources
- 2.1.2 PRIMARY DATA
- 2.1.2.1 Primary interviews with experts
- 2.1.2.2 Breakup of primary profiles
- 2.1.2.3 Key data from primary sources
- 2.1.2.4 Key industry insights
- 2.1.1 SECONDARY DATA
- 2.2 MARKET BREAKUP AND DATA TRIANGULATION
- 2.3 MARKET SIZE ESTIMATION
- 2.3.1 TOP-DOWN APPROACH
- 2.3.2 BOTTOM-UP APPROACH
- 2.4 MARKET FORECAST
- 2.5 RESEARCH ASSUMPTIONS
- 2.6 RESEARCH LIMITATIONS
3 EXECUTIVE SUMMARY
4 PREMIUM INSIGHTS
- 4.1 ATTRACTIVE OPPORTUNITIES FOR MARKET PLAYERS IN MANAGED NETWORK SECURITY MARKET
- 4.2 NORTH AMERICA: MANAGED NETWORK SERVICES MARKET, BY TYPE & COUNTRY
- 4.3 MANAGED NETWORK SERVICES MARKET, BY TYPE
- 4.4 MANAGED NETWORK SERVICES MARKET, BY VERTICAL
- 4.5 MANAGED NETWORK SERVICES MARKET, BY MANAGED NETWORK SECURITY
5 MARKET OVERVIEW AND INDUSTRY TRENDS
- 5.1 INTRODUCTION
- 5.2 MARKET DYNAMICS
- 5.2.1 DRIVERS
- 5.2.1.1 Outsourcing of IT expertise by small and medium-sized businesses
- 5.2.1.2 Technological advancements impacting enterprise networks
- 5.2.1.3 Capital and operational expenditure savings associated with managed network services
- 5.2.2 RESTRAINTS
- 5.2.2.1 Privacy and security concerns in outsourcing network management
- 5.2.2.2 Increasing regulations and compliance issues
- 5.2.3 OPPORTUNITIES
- 5.2.3.1 Exponential growth in global IP traffic and cloud traffic
- 5.2.3.2 Ability to provide value-added services above and beyond core network infrastructure
- 5.2.3.3 Increasing demand for managed network services among small and medium-sized enterprises
- 5.2.4 CHALLENGES
- 5.2.4.1 Establishing clear expectations and requirements
- 5.2.4.2 Navigating customer support depending on MSP response times
- 5.2.4.3 Challenges associated with marketing and sales efforts
- 5.2.1 DRIVERS
- 5.3 MANAGED NETWORK SERVICES MARKET: BRIEF HISTORY
- 5.4 VALUE CHAIN ANALYSIS
- 5.5 ECOSYSTEM ANALYSIS
- 5.6 CASE STUDY ANALYSIS
- 5.6.1 CASE STUDY 1: NORTH AMERICAN FOOD MANUFACTURER UPGRADES ITS NETWORK FOR BUSINESS GROWTH WITH KYNDRYL
- 5.6.2 CASE STUDY 2: COMMUNICATIONS COSTS REDUCED TO AN INDUSTRY LOW OF ABOUT 1% OF OPERATING BUDGET WITH NTT
- 5.6.3 CASE STUDY 3: EVOLUTION OF ENTERPRISE DATA MANAGEMENT IN HEALTH
- 5.6.4 CASE STUDY 4: SINGLE-PROVIDER MANAGED NETWORK FOR IMPROVING CHECKOUT RELIABILITY, GUEST WI-FI, AND CENTRALIZING OPERATIONS
- 5.7 PORTER'S FIVE FORCES MODEL
- 5.7.1 THREAT OF NEW ENTRANTS
- 5.7.2 THREAT OF SUBSTITUTES
- 5.7.3 BARGAINING POWER OF BUYERS
- 5.7.4 BARGAINING POWER OF SUPPLIERS
- 5.7.5 INTENSITY OF COMPETITIVE RIVALRY
- 5.8 KEY STAKEHOLDERS AND BUYING CRITERIA
- 5.8.1 KEY STAKEHOLDERS IN BUYING PROCESS
- 5.8.2 BUYING CRITERIA
- 5.9 PATENT ANALYSIS
- 5.9.1 METHODOLOGY
- 5.10 TRENDS/DISRUPTIONS IMPACTING CUSTOMER BUSINESS
- 5.11 PRICING ANALYSIS
- 5.11.1 AVERAGE SELLING PRICE OF SERVICE TYPES, BY KEY PLAYER, 2024
- 5.11.2 INDICATIVE PRICING ANALYSIS, BY TYPE, 2024
- 5.12 TECHNOLOGY ANALYSIS
- 5.12.1 KEY TECHNOLOGIES
- 5.12.1.1 Software-defined networking (SDN)
- 5.12.1.2 Network functions virtualization (NFV)
- 5.12.1.3 Artificial intelligence (AI) and machine learning (ML)
- 5.12.1.4 Security automation and orchestration (SAO)
- 5.12.2 ADJACENT TECHNOLOGIES
- 5.12.2.1 Cloud computing
- 5.12.2.2 Internet of Things (IoT)
- 5.12.2.3 Edge computing
- 5.12.2.4 Blockchain
- 5.12.3 COMPLEMENTARY TECHNOLOGIES
- 5.12.3.1 Big data analytics
- 5.12.3.2 Cybersecurity automation tools
- 5.12.3.3 Collaboration platforms
- 5.12.1 KEY TECHNOLOGIES
- 5.13 REGULATORY LANDSCAPE
- 5.13.1 REGULATORY BODIES, GOVERNMENT AGENCIES, AND OTHER ORGANIZATIONS
- 5.13.2 KEY REGULATIONS
- 5.13.2.1 North America
- 5.13.2.1.1 US
- 5.13.2.2 Europe
- 5.13.2.3 Asia Pacific
- 5.13.2.3.1 India
- 5.13.2.4 Middle East & Africa
- 5.13.2.4.1 UAE
- 5.13.2.5 Latin America
- 5.13.2.5.1 Brazil
- 5.13.2.5.2 Mexico
- 5.13.2.1 North America
- 5.14 KEY CONFERENCES & EVENTS, 2025-2026
- 5.15 TECHNOLOGY ROADMAP FOR MANAGED NETWORK SERVICES MARKET
- 5.15.1 SHORT-TERM ROADMAP (2025-2027)
- 5.15.2 MID-TERM ROADMAP (2027-2029)
- 5.15.3 LONG-TERM ROADMAP (2029-2030)
- 5.16 BEST PRACTICES IN MANAGED NETWORK SERVICES MARKET
- 5.17 CURRENT AND EMERGING BUSINESS MODELS
- 5.18 TOOLS, FRAMEWORKS, AND TECHNIQUES USED IN MANAGED NETWORK SERVICES MARKET
- 5.19 INVESTMENT AND FUNDING SCENARIO
- 5.20 IMPACT OF AI/GENERATIVE AI ON MANAGED NETWORK SERVICES MARKET
- 5.21 IMPACT OF 2025 US TARIFF - MANAGED NETWORK SERVICES MARKET
- 5.21.1 INTRODUCTION
- 5.21.2 KEY TARIFF RATES
- 5.21.3 PRICE IMPACT ANALYSIS
- 5.21.4 IMPACT ON COUNTRY/REGION
- 5.21.4.1 US
- 5.21.4.2 Europe
- 5.21.4.3 Asia Pacific
- 5.21.5 IMPACT ON MANAGED NETWORK SERVICES MARKET END USE
6 MANAGED NETWORK SERVICES MARKET, BY TYPE
- 6.1 INTRODUCTION
- 6.1.1 MANAGED NETWORK SERVICES MARKET, BY TYPE: DRIVERS
- 6.2 MANAGED LAN
- 6.2.1 GROWTH OF HYBRID/REMOTE WORK TO REQUIRE SECURE LAN ACCESS
- 6.3 MANAGED WI-FI
- 6.3.1 EXPLOSIVE GROWTH IN SMARTPHONES, TABLETS, AND IOT DEVICES TO BOOST DEMAND FOR WIRELESS NETWORK INFRASTRUCTURE
- 6.4 MANAGED VPN
- 6.4.1 GLOBALIZATION OF BUSINESS TO FUEL NEED FOR ENCRYPTED LINKS BETWEEN GEO DISTRIBUTED SITES
- 6.5 MANAGED WAN
- 6.5.1 RAPID GROWTH OF CLOUD APPS AND STREAMING SERVICES TO REQUIRE HIGH BANDWIDTH LINKS
- 6.6 NETWORK MONITORING
- 6.6.1 DEMAND FOR REAL-TIME PERFORMANCE DATA AND SLA COMPLIANCE TO ENSURE ZERO NETWORK OUTAGES
- 6.7 MANAGED NFV
- 6.7.1 SHIFT TO CLOUD NATIVE TELECOM AND ENTERPRISE NETWORKS TO RELY ON VIRTUALIZED FUNCTIONS
- 6.8 MANAGED NETWORK SECURITY
- 6.8.1 LACK OF IN-HOUSE SECURITY EXPERTISE TO MANAGE FIREWALLS/IDS EFFECTIVELY
7 MANAGED NETWORK SERVICES MARKET, BY MANAGED NETWORK SECURITY
- 7.1 INTRODUCTION
- 7.1.1 MANAGED NETWORK SECURITY: MARKET DRIVERS
- 7.2 MANAGED FIREWALL
- 7.2.1 RAPID INCREASE IN CYBER ATTACKS AND SOPHISTICATED THREATS TO DRIVE DEMAND
- 7.3 MANAGED IDS/IPS
- 7.3.1 ANALYZING NETWORK TRAFFIC TO IDENTIFY PATTERNS INDICATIVE OF A CYBERATTACK
- 7.4 OTHER MANAGED NETWORK SECURITY
8 MANAGED NETWORK SERVICES MARKET, BY VERTICAL
- 8.1 INTRODUCTION
- 8.1.1 VERTICALS: MANAGED NETWORK SERVICES MARKET DRIVERS
- 8.2 BANKING, FINANCIAL SERVICES, & INSURANCE
- 8.2.1 ULTRA-LOW LATENCY REQUIREMENTS AND PROTECTION OF SENSITIVE CLIENT DATA TO BOOST DEMAND
- 8.2.2 USE CASES
- 8.2.2.1 Secure SD-WAN for branch connectivity
- 8.2.2.2 Managed firewalls and intrusion detection systems
- 8.2.2.3 Disaster recovery and business continuity planning
- 8.3 RETAIL & ECOMMERCE
- 8.3.1 NEED FOR ROBUST NETWORK AND CUSTOMER EXPERIENCE IMPROVEMENTS TO SUPPORT ADOPTION
- 8.3.2 USE CASES
- 8.3.2.1 Managed Wi-Fi for enhanced customer experience
- 8.3.2.2 Secure VPNs for remote point-of-sale systems
- 8.3.2.3 Network monitoring for inventory management
- 8.4 IT & TELECOM
- 8.4.1 CUSTOMER SATURATION, SLOW INNOVATION, AND OTHER CHALLENGES TO DRIVE USERS TOWARD OUTSOURCING
- 8.4.2 USE CASES
- 8.4.2.1 Managed network infrastructure for data centers
- 8.4.2.2 SD-WAN for optimized application delivery
- 8.4.2.3 Managed security services for client networks
- 8.5 MANUFACTURING
- 8.5.1 ENHANCED PRODUCT LIFE CYCLE, INNOVATION, AND COST REDUCTION BENEFITS TO BOOST ADOPTION
- 8.5.2 USE CASES
- 8.5.2.1 Industrial IoT network management
- 8.5.2.2 Secure remote access for operational technology
- 8.5.2.3 Network segmentation for enhanced security
- 8.6 GOVERNMENT
- 8.6.1 RISING DATA GENERATION AND CONCERNS OVER SECURITY BREACHES TO FUEL NEED FOR DISASTER RECOVERY NETWORKS
- 8.6.2 USE CASES
- 8.6.2.1 Secure managed networks for public services
- 8.6.2.2 Emergency communication network services
- 8.6.2.3 Data encryption and compliance management
- 8.7 EDUCATION
- 8.7.1 DIGITAL MEDIA TO OFFER PERSONALIZED ELEARNING CONTENT
- 8.7.2 USE CASES
- 8.7.2.1 Campus-wide managed Wi-Fi
- 8.7.2.2 Secure remote learning platforms
- 8.7.2.3 Network monitoring for academic research
- 8.8 HEALTHCARE
- 8.8.1 GREATER EFFICIENCY AND REDUCED OPERATING COSTS TO DRIVE HEALTHCARE CUSTOMERS TOWARD MANAGED NETWORK SERVICES
- 8.8.2 USE CASES
- 8.8.2.1 Managed networks for telemedicine services
- 8.8.2.2 Secure data transmission for electronic health records
- 8.8.2.3 Network redundancy for critical medical equipment
- 8.9 MEDIA & ENTERTAINMENT
- 8.9.1 SHIFTING CONSUMPTION TRENDS TO DRIVE MEDIA HOUSES TOWARD DIGITAL DISTRIBUTION AND HIGH-SPEED CONNECTIVITY
- 8.9.2 USE CASES
- 8.9.2.1 High-bandwidth managed networks for content distribution
- 8.9.2.2 Managed Wi-Fi for live events
- 8.10 OTHER VERTICALS
9 MANAGED NETWORK SERVICES MARKET, BY REGION
- 9.1 INTRODUCTION
- 9.2 NORTH AMERICA
- 9.2.1 NORTH AMERICA: MACROECONOMIC OUTLOOK
- 9.2.2 US
- 9.2.2.1 Adoption of emerging technologies to boost managed network outsourcing
- 9.2.3 CANADA
- 9.2.3.1 Rural broadband expansion to fuel demand for managed network services
- 9.3 EUROPE
- 9.3.1 EUROPE: MACROECONOMIC OUTLOOK
- 9.3.2 UK
- 9.3.2.1 Developing networking infrastructure and high number of mobile subscribers to drive market
- 9.3.3 GERMANY
- 9.3.3.1 Demand for secure, low-latency connectivity to boost adoption of managed offerings
- 9.3.4 FRANCE
- 9.3.4.1 Smart city projects to fuel adoption of centralized managed network platforms
- 9.3.5 ITALY
- 9.3.5.1 SME digitalization to accelerate demand for managed connectivity
- 9.3.6 SPAIN
- 9.3.6.1 Tourism and hospitality digitization to increase requirement of resilient networks
- 9.3.7 REST OF EUROPE
- 9.4 ASIA PACIFIC
- 9.4.1 ASIA PACIFIC: MACROECONOMIC OUTLOOK
- 9.4.2 CHINA
- 9.4.2.1 Massive 5G enterprise rollouts to fuel demand for managed services
- 9.4.3 JAPAN
- 9.4.3.1 Significant investment in AI infrastructure to boost demand for high-performance computing and data center operations
- 9.4.4 INDIA
- 9.4.4.1 Rapid digital adoption to drive demand for pressure-scalable managed network solution
- 9.4.5 AUSTRALIA & NEW ZEALAND
- 9.4.5.1 Remote connectivity and cloud adoption to boost managed services
- 9.4.6 SOUTH KOREA
- 9.4.6.1 Hyperconnected consumer market to boost demand for low-latency networks
- 9.4.7 SINGAPORE
- 9.4.7.1 Surge in regional data hubs to boost demand for secure managed networking
- 9.4.8 REST OF ASIA PACIFIC
- 9.5 MIDDLE EAST & AFRICA
- 9.5.1 MIDDLE EAST & AFRICA: MACROECONOMIC OUTLOOK
- 9.5.2 MIDDLE EAST
- 9.5.2.1 Energy sector digitization and mega projects to fuel demand for managed networks
- 9.5.2.2 KSA
- 9.5.2.2.1 National cloud and giga projects to drive demand for managed networks
- 9.5.2.3 UAE
- 9.5.2.3.1 Smart city and EXPO legacy to boost demand for network services
- 9.5.2.4 KUWAIT
- 9.5.2.4.1 Strategic moves by regional operators to alter secure managed connectivity
- 9.5.2.5 Bahrain
- 9.5.2.5.1 Financial services growth to increase demand for managed security
- 9.5.2.6 Rest of Middle East
- 9.5.3 AFRICA
- 9.5.3.1 SME digital transformation to drive adoption managed services
- 9.6 LATIN AMERICA
- 9.6.1 LATIN AMERICA: MACROECONOMIC OUTLOOK
- 9.6.2 BRAZIL
- 9.6.2.1 Urbanization and mobile growth to push adoption of managed networking services
- 9.6.3 MEXICO
- 9.6.3.1 Nearshoring manufacturing expansion to drive resilient network services
- 9.6.4 REST OF LATIN AMERICA
10 COMPETITIVE LANDSCAPE
- 10.1 INTRODUCTION
- 10.2 KEY PLAYER STRATEGIES/RIGHT TO WIN, 2023-2025
- 10.3 REVENUE ANALYSIS, 2024
- 10.4 MARKET SHARE ANALYSIS, 2024
- 10.5 BRAND/PRODUCT COMPARISON
- 10.6 COMPANY VALUATION AND FINANCIAL METRICS
- 10.7 COMPANY EVALUATION MATRIX: KEY PLAYERS, 2024
- 10.7.1 STARS
- 10.7.2 EMERGING LEADERS
- 10.7.3 PERVASIVE PLAYERS
- 10.7.4 PARTICIPANTS
- 10.7.5 COMPANY FOOTPRINT: KEY PLAYERS, 2024
- 10.7.5.1 Company footprint
- 10.7.5.2 Region footprint
- 10.7.5.3 Type footprint
- 10.7.5.4 Managed network security footprint
- 10.7.5.5 Vertical footprint
- 10.8 COMPANY EVALUATION MATRIX: STARTUPS/SMES, 2024
- 10.8.1 PROGRESSIVE COMPANIES
- 10.8.2 RESPONSIVE COMPANIES
- 10.8.3 DYNAMIC COMPANIES
- 10.8.4 STARTING BLOCKS
- 10.8.5 COMPETITIVE BENCHMARKING: STARTUPS/SMES, 2024
- 10.8.5.1 Detailed list of key startups/SMEs
- 10.8.5.2 Competitive benchmarking of key startups/SMEs
- 10.9 COMPETITIVE SCENARIO
- 10.9.1 PRODUCT LAUNCHES AND ENHANCEMENTS
- 10.9.2 DEALS
11 COMPANY PROFILES
- 11.1 KEY PLAYERS
- 11.1.1 CISCO
- 11.1.1.1 Business overview
- 11.1.1.2 Products/Solutions/Services offered
- 11.1.1.3 Recent developments
- 11.1.1.3.1 Product launches and enhancements
- 11.1.1.3.2 Deals
- 11.1.1.4 MnM view
- 11.1.1.4.1 Key strengths/Right to win
- 11.1.1.4.2 Strategic choices
- 11.1.1.4.3 Weaknesses and competitive threats
- 11.1.2 AT&T
- 11.1.2.1 Business overview
- 11.1.2.2 Products/Solutions/Services offered
- 11.1.2.3 Recent developments
- 11.1.2.3.1 Deals
- 11.1.2.4 MnM view
- 11.1.2.4.1 Key strengths/Right to win
- 11.1.2.4.2 Strategic choices
- 11.1.2.4.3 Weaknesses and competitive threats
- 11.1.3 VERIZON
- 11.1.3.1 Business overview
- 11.1.3.2 Products/Solutions/Services offered
- 11.1.3.3 Recent developments
- 11.1.3.3.1 Product launches and enhancements
- 11.1.3.3.2 Deals
- 11.1.3.4 MnM view
- 11.1.3.4.1 Key strengths/Right to win
- 11.1.3.4.2 Strategic choices
- 11.1.3.4.3 Weaknesses and competitive threats
- 11.1.4 NTT
- 11.1.4.1 Business overview
- 11.1.4.2 Products/Solutions/Services offered
- 11.1.4.3 Recent developments
- 11.1.4.3.1 Product launches and enhancements
- 11.1.4.3.2 Deals
- 11.1.4.4 MnM view
- 11.1.4.4.1 Key strengths/Right to win
- 11.1.4.4.2 Strategic choices
- 11.1.4.4.3 Weaknesses and competitive threats
- 11.1.5 DEUTSCHE TELEKOM
- 11.1.5.1 Business overview
- 11.1.5.2 Products/Solutions/Services offered
- 11.1.5.3 Recent developments
- 11.1.5.3.1 Product launches and enhancements
- 11.1.5.3.2 Deals
- 11.1.5.4 MnM view
- 11.1.5.4.1 Key strengths/Right to win
- 11.1.5.4.2 Strategic choices
- 11.1.5.4.3 Weaknesses and competitive threats
- 11.1.6 VODAFONE
- 11.1.6.1 Business overview
- 11.1.6.2 Products/Solutions/Services offered
- 11.1.6.3 Recent developments
- 11.1.6.3.1 Product launches and enhancements
- 11.1.6.3.2 Deals
- 11.1.7 ORANGE
- 11.1.7.1 Business overview
- 11.1.7.2 Products/Solutions/Services offered
- 11.1.7.3 Recent developments
- 11.1.7.3.1 Product launches and enhancements
- 11.1.7.3.2 Deals
- 11.1.8 ERICSSON
- 11.1.8.1 Business overview
- 11.1.8.2 Products/Solutions/Services offered
- 11.1.9 HUAWEI
- 11.1.9.1 Business overview
- 11.1.9.2 Products/Solutions/Services offered
- 11.1.10 TELEFONICA
- 11.1.10.1 Business overview
- 11.1.10.2 Products/Solutions/Services offered
- 11.1.1 CISCO
- 11.2 OTHER PLAYERS
- 11.2.1 LUMEN TECHNOLOGIES
- 11.2.2 FUJITSU
- 11.2.3 TATA COMMUNICATIONS
- 11.2.4 TELSTRA
- 11.2.5 COLT TECHNOLOGY SERVICES
- 11.2.6 NOKIA
- 11.2.7 SINGTEL
- 11.2.8 GTT COMMUNICATIONS
- 11.2.9 SIFY TECHNOLOGIES
- 11.2.10 DXC TECHNOLOGY
- 11.2.11 WIPRO
- 11.2.12 COMARCH
- 11.2.13 COMMSCOPE
- 11.3 SMES/STARTUPS
- 11.3.1 ALKIRA
- 11.3.2 FLEXIWAN
- 11.3.3 BIGLEAF NETWORKS
- 11.3.4 GRAPHIANT
- 11.3.5 KENTIK
- 11.3.6 OMAN DATA PARK
- 11.3.7 KUBUS
- 11.3.8 EIL GLOBAL
- 11.3.9 SYSTAL TECHNOLOGY SOLUTIONS
- 11.3.10 METTEL
12 ADJACENT AND RELATED MARKETS
- 12.1 INTRODUCTION
- 12.2 MANAGED SERVICES MARKET - GLOBAL FORECAST TO 2029
- 12.2.1 MARKET DEFINITION
- 12.3 NETWORK-AS-A-SERVICE MARKET
- 12.3.1 MARKET DEFINITION
13 APPENDIX
- 13.1 DISCUSSION GUIDE
- 13.2 KNOWLEDGESTORE: MARKETSANDMARKETS' SUBSCRIPTION PORTAL
- 13.3 CUSTOMIZATION OPTIONS
- 13.4 RELATED REPORTS
- 13.5 AUTHOR DETAILS
List of Tables
- TABLE 1 UNITED STATES DOLLAR, EXCHANGE RATES, 2019-2022
- TABLE 2 FACTOR ANALYSIS
- TABLE 3 MANAGED NETWORK SERVICES MARKET: ECOSYSTEM
- TABLE 4 MANAGED NETWORK SERVICES MARKET: PORTER'S FIVE FORCES MODEL
- TABLE 5 INFLUENCE OF STAKEHOLDERS ON BUYING PROCESS FOR KEY VERTICALS (%)
- TABLE 6 KEY BUYING CRITERIA FOR TOP THREE VERTICALS
- TABLE 7 LIST OF PATENTS IN MANAGED NETWORK SERVICES MARKET, 2016-2025
- TABLE 8 AVERAGE SELLING PRICE OF SERVICES TYPE, BY KEY PLAYER, 2024
- TABLE 9 INDICATIVE PRICING ANALYSIS, BY TYPE (USD PER USER/MONTH)
- TABLE 10 NORTH AMERICA: REGULATORY BODIES, GOVERNMENT AGENCIES, AND OTHER ORGANIZATIONS
- TABLE 11 EUROPE: REGULATORY BODIES, GOVERNMENT AGENCIES, AND OTHER ORGANIZATIONS
- TABLE 12 ASIA PACIFIC: REGULATORY BODIES, GOVERNMENT AGENCIES, AND OTHER ORGANIZATIONS
- TABLE 13 REST OF WORLD: REGULATORY BODIES, GOVERNMENT AGENCIES, AND OTHER ORGANIZATIONS
- TABLE 14 MANAGED NETWORK SERVICES MARKET: KEY CONFERENCES & EVENTS, 2025-2026
- TABLE 15 US ADJUSTED RECIPROCAL TARIFF RATES
- TABLE 16 EXPECTED CHANGE IN PRICES AND LIKELY IMPACT ON END-USE MARKETS DUE TO TARIFF IMPACT
- TABLE 17 MANAGED NETWORK SERVICES MARKET, BY TYPE, 2019-2024 (USD MILLION)
- TABLE 18 MANAGED NETWORK SERVICES MARKET, BY TYPE, 2025-2030 (USD MILLION)
- TABLE 19 MANAGED LAN: MANAGED NETWORK SERVICES MARKET, BY REGION, 2019-2024 (USD MILLION)
- TABLE 20 MANAGED LAN: MANAGED NETWORK SERVICES MARKET, BY REGION, 2025-2030 (USD MILLION)
- TABLE 21 MANAGED WI-FI: MANAGED NETWORK SERVICES MARKET, BY REGION, 2019-2024 (USD MILLION)
- TABLE 22 MANAGED WI-FI: MANAGED NETWORK SERVICES MARKET, BY REGION, 2025-2030 (USD MILLION)
- TABLE 23 MANAGED VPN: MANAGED NETWORK SERVICES MARKET, BY REGION, 2019-2024 (USD MILLION)
- TABLE 24 MANAGED VPN: MANAGED NETWORK SERVICES MARKET, BY REGION, 2025-2030 (USD MILLION)
- TABLE 25 MANAGED WAN: MANAGED NETWORK SERVICES MARKET, BY REGION, 2019-2024 (USD MILLION)
- TABLE 26 MANAGED WAN: MANAGED NETWORK SERVICES MARKET, BY REGION, 2025-2030 (USD MILLION)
- TABLE 27 NETWORK MONITORING: MANAGED NETWORK SERVICES MARKET, BY REGION, 2019-2024 (USD MILLION)
- TABLE 28 NETWORK MONITORING: MANAGED NETWORK SERVICES MARKET, BY REGION, 2025-2030 (USD MILLION)
- TABLE 29 MANAGED NFV: MANAGED NETWORK SERVICES MARKET, BY REGION, 2019-2024 (USD MILLION)
- TABLE 30 MANAGED NFV: MANAGED NETWORK SERVICES MARKET, BY REGION, 2025-2030 (USD MILLION)
- TABLE 31 MANAGED NETWORK SECURITY: MANAGED NETWORK SERVICES MARKET, BY REGION, 2019-2024 (USD MILLION)
- TABLE 32 MANAGED NETWORK SECURITY: MANAGED NETWORK SERVICES MARKET, BY REGION, 2025-2030 (USD MILLION)
- TABLE 33 MANAGED NETWORK SERVICES MARKET, BY MANAGED NETWORK SECURITY, 2019-2024 (USD MILLION)
- TABLE 34 MANAGED NETWORK SERVICES MARKET, BY MANAGED NETWORK SECURITY, 2025-2030 (USD MILLION)
- TABLE 35 MANAGED FIREWALL: MANAGED NETWORK SERVICES MARKET, BY REGION, 2019-2024 (USD MILLION)
- TABLE 36 MANAGED FIREWALL: MANAGED NETWORK SERVICES MARKET, BY REGION, 2025-2030 (USD MILLION)
- TABLE 37 MANAGED IDS/IPS: MANAGED NETWORK SERVICES MARKET, BY REGION, 2019-2024 (USD MILLION)
- TABLE 38 MANAGED IDS/IPS: MANAGED NETWORK SERVICES MARKET, BY REGION, 2025-2030 (USD MILLION)
- TABLE 39 OTHER MANAGED NETWORK SECURITY: MANAGED NETWORK SERVICES MARKET, BY REGION, 2019-2024 (USD MILLION)
- TABLE 40 OTHER MANAGED NETWORK SECURITY: MANAGED NETWORK SERVICES MARKET, BY REGION, 2025-2030 (USD MILLION)
- TABLE 41 MANAGED NETWORK SERVICES MARKET, BY VERTICAL, 2019-2024 (USD MILLION)
- TABLE 42 MANAGED NETWORK SERVICES MARKET, BY VERTICAL, 2025-2030 (USD MILLION)
- TABLE 43 BANKING, FINANCIAL SERVICES, & INSURANCE: MANAGED NETWORK SERVICES MARKET, BY REGION, 2019-2024 (USD MILLION)
- TABLE 44 BANKING, FINANCIAL SERVICES, & INSURANCE: MANAGED NETWORK SERVICES MARKET, BY REGION, 2025-2030 (USD MILLION)
- TABLE 45 RETAIL & ECOMMERCE: MANAGED NETWORK SERVICES MARKET, BY REGION, 2019-2024 (USD MILLION)
- TABLE 46 RETAIL & ECOMMERCE: MANAGED NETWORK SERVICES MARKET, BY REGION, 2025-2030 (USD MILLION)
- TABLE 47 IT & TELECOM: MANAGED NETWORK SERVICES MARKET, BY REGION, 2019-2024 (USD MILLION)
- TABLE 48 IT & TELECOM: MANAGED NETWORK SERVICES MARKET, BY REGION, 2025-2030 (USD MILLION)
- TABLE 49 MANUFACTURING: MANAGED SECURITY SERVICES MARKET, BY REGION, 2019-2024 (USD MILLION)
- TABLE 50 MANUFACTURING: MANAGED SECURITY SERVICES MARKET, BY REGION, 2025-2030 (USD MILLION)
- TABLE 51 GOVERNMENT: MANAGED NETWORK SERVICES MARKET, BY REGION, 2019-2024 (USD MILLION)
- TABLE 52 GOVERNMENT: MANAGED NETWORK SERVICES MARKET, BY REGION, 2025-2030 (USD MILLION)
- TABLE 53 EDUCATION: MANAGED NETWORK SERVICES MARKET, BY REGION, 2019-2024 (USD MILLION)
- TABLE 54 EDUCATION: MANAGED NETWORK SERVICES MARKET, BY REGION, 2025-2030 (USD MILLION)
- TABLE 55 HEALTHCARE: MANAGED NETWORK SERVICES MARKET, BY REGION, 2019-2024 (USD MILLION)
- TABLE 56 HEALTHCARE: MANAGED NETWORK SERVICES MARKET, BY REGION, 2025-2030 (USD MILLION)
- TABLE 57 MEDIA & ENTERTAINMENT: MANAGED NETWORK SERVICES MARKET, BY REGION, 2019-2024 (USD MILLION)
- TABLE 58 MEDIA & ENTERTAINMENT: MANAGED NETWORK SERVICES MARKET, BY REGION, 2025-2030 (USD MILLION)
- TABLE 59 OTHER VERTICALS: MANAGED NETWORK SERVICES MARKET, BY REGION, 2019-2024 (USD MILLION)
- TABLE 60 OTHER VERTICALS: MANAGED NETWORK SERVICES MARKET, BY REGION, 2025-2030 (USD MILLION)
- TABLE 61 MANAGED NETWORK SERVICES MARKET, BY REGION, 2019-2024 (USD MILLION)
- TABLE 62 MANAGED NETWORK SERVICES MARKET, BY REGION, 2025-2030 (USD MILLION)
- TABLE 63 NORTH AMERICA: MANAGED NETWORK SERVICES MARKET, BY TYPE, 2019-2024 (USD MILLION)
- TABLE 64 NORTH AMERICA: MANAGED NETWORK SERVICES MARKET, BY TYPE, 2025-2030 (USD MILLION)
- TABLE 65 NORTH AMERICA: MANAGED NETWORK SERVICES MARKET, BY MANAGED NETWORK SECURITY, 2019-2024 (USD MILLION)
- TABLE 66 NORTH AMERICA: MANAGED NETWORK SERVICES MARKET, BY MANAGED NETWORK SECURITY, 2025-2030 (USD MILLION)
- TABLE 67 NORTH AMERICA: MANAGED NETWORK SERVICES MARKET, BY VERTICAL, 2019-2024 (USD MILLION)
- TABLE 68 NORTH AMERICA: MANAGED NETWORK SERVICES MARKET, BY VERTICAL, 2025-2030 (USD MILLION)
- TABLE 69 NORTH AMERICA: MANAGED NETWORK SERVICES MARKET, BY COUNTRY, 2019-2024 (USD MILLION)
- TABLE 70 NORTH AMERICA: MANAGED NETWORK SERVICES MARKET, BY COUNTRY, 2025-2030 (USD MILLION)
- TABLE 71 US: MANAGED NETWORK SERVICES MARKET, BY TYPE, 2019-2024 (USD MILLION)
- TABLE 72 US: MANAGED NETWORK SERVICES MARKET, BY TYPE, 2025-2030 (USD MILLION)
- TABLE 73 US: MANAGED NETWORK SERVICES MARKET, BY MANAGED NETWORK SECURITY, 2019-2024 (USD MILLION)
- TABLE 74 US: MANAGED NETWORK SERVICES MARKET, BY MANAGED NETWORK SECURITY, 2025-2030 (USD MILLION)
- TABLE 75 US: MANAGED NETWORK SERVICES MARKET, BY VERTICAL, 2019-2024 (USD MILLION)
- TABLE 76 US: MANAGED NETWORK SERVICES MARKET, BY VERTICAL, 2025-2030 (USD MILLION)
- TABLE 77 CANADA: MANAGED NETWORK SERVICES MARKET, BY TYPE, 2019-2024 (USD MILLION)
- TABLE 78 CANADA: MANAGED NETWORK SERVICES MARKET, BY TYPE, 2025-2030 (USD MILLION)
- TABLE 79 CANADA: MANAGED NETWORK SERVICES MARKET, BY MANAGED NETWORK SECURITY, 2019-2024 (USD MILLION)
- TABLE 80 CANADA: MANAGED NETWORK SERVICES MARKET, BY MANAGED NETWORK SECURITY, 2025-2030 (USD MILLION)
- TABLE 81 CANADA: MANAGED NETWORK SERVICES MARKET, BY VERTICAL, 2019-2024 (USD MILLION)
- TABLE 82 CANADA: MANAGED NETWORK SERVICES MARKET, BY VERTICAL, 2025-2030 (USD MILLION)
- TABLE 83 EUROPE: MANAGED NETWORK SERVICES MARKET, BY TYPE, 2019-2024 (USD MILLION)
- TABLE 84 EUROPE: MANAGED NETWORK SERVICES MARKET, BY TYPE, 2025-2030 (USD MILLION)
- TABLE 85 EUROPE: MANAGED NETWORK SERVICES MARKET, BY MANAGED NETWORK SECURITY, 2019-2024 (USD MILLION)
- TABLE 86 EUROPE: MANAGED NETWORK SERVICES MARKET, BY MANAGED NETWORK SECURITY, 2025-2030 (USD MILLION)
- TABLE 87 EUROPE: MANAGED NETWORK SERVICES MARKET, BY VERTICAL, 2019-2024 (USD MILLION)
- TABLE 88 EUROPE: MANAGED NETWORK SERVICES MARKET, BY VERTICAL, 2025-2030 (USD MILLION)
- TABLE 89 EUROPE: MANAGED NETWORK SERVICES MARKET, BY COUNTRY, 2019-2024 (USD MILLION)
- TABLE 90 EUROPE: MANAGED NETWORK SERVICES MARKET, BY COUNTRY, 2025-2030 (USD MILLION)
- TABLE 91 UK: MANAGED NETWORK SERVICES MARKET, BY TYPE, 2019-2024 (USD MILLION)
- TABLE 92 UK: MANAGED NETWORK SERVICES MARKET, BY TYPE, 2025-2030 (USD MILLION)
- TABLE 93 UK: MANAGED NETWORK SERVICES MARKET, BY MANAGED NETWORK SECURITY, 2019-2024 (USD MILLION)
- TABLE 94 UK: MANAGED NETWORK SERVICES MARKET, BY MANAGED NETWORK SECURITY, 2025-2030 (USD MILLION)
- TABLE 95 UK: MANAGED NETWORK SERVICES MARKET, BY VERTICAL, 2019-2024 (USD MILLION)
- TABLE 96 UK: MANAGED NETWORK SERVICES MARKET, BY VERTICAL, 2025-2030 (USD MILLION)
- TABLE 97 GERMANY: MANAGED NETWORK SERVICES MARKET, BY TYPE, 2019-2024 (USD MILLION)
- TABLE 98 GERMANY: MANAGED NETWORK SERVICES MARKET, BY TYPE, 2025-2030 (USD MILLION)
- TABLE 99 GERMANY: MANAGED NETWORK SERVICES MARKET, BY MANAGED NETWORK SECURITY, 2019-2024 (USD MILLION)
- TABLE 100 GERMANY: MANAGED NETWORK SERVICES MARKET, BY MANAGED NETWORK SECURITY, 2025-2030 (USD MILLION)
- TABLE 101 GERMANY: MANAGED NETWORK SERVICES MARKET, BY VERTICAL, 2019-2024 (USD MILLION)
- TABLE 102 GERMANY: MANAGED NETWORK SERVICES MARKET, BY VERTICAL, 2025-2030 (USD MILLION)
- TABLE 103 FRANCE: MANAGED NETWORK SERVICES MARKET, BY TYPE, 2019-2024 (USD MILLION)
- TABLE 104 FRANCE: MANAGED NETWORK SERVICES MARKET, BY TYPE, 2025-2030 (USD MILLION)
- TABLE 105 FRANCE: MANAGED NETWORK SERVICES MARKET, BY MANAGED NETWORK SECURITY, 2019-2024 (USD MILLION)
- TABLE 106 FRANCE: MANAGED NETWORK SERVICES MARKET, BY MANAGED NETWORK SECURITY, 2025-2030 (USD MILLION)
- TABLE 107 FRANCE: MANAGED NETWORK SERVICES MARKET, BY VERTICAL, 2019-2024 (USD MILLION)
- TABLE 108 FRANCE: MANAGED NETWORK SERVICES MARKET, BY VERTICAL, 2025-2030 (USD MILLION)
- TABLE 109 ITALY: MANAGED NETWORK SERVICES MARKET, BY TYPE, 2019-2024 (USD MILLION)
- TABLE 110 ITALY: MANAGED NETWORK SERVICES MARKET, BY TYPE, 2025-2030 (USD MILLION)
- TABLE 111 ITALY: MANAGED NETWORK SERVICES MARKET, BY MANAGED NETWORK SECURITY, 2019-2024 (USD MILLION)
- TABLE 112 ITALY: MANAGED NETWORK SERVICES MARKET, BY MANAGED NETWORK SECURITY, 2025-2030 (USD MILLION)
- TABLE 113 ITALY: MANAGED NETWORK SERVICES MARKET, BY VERTICAL, 2019-2024 (USD MILLION)
- TABLE 114 ITALY: MANAGED NETWORK SERVICES MARKET, BY VERTICAL, 2025-2030 (USD MILLION)
- TABLE 115 SPAIN: MANAGED NETWORK SERVICES MARKET, BY TYPE, 2019-2024 (USD MILLION)
- TABLE 116 SPAIN: MANAGED NETWORK SERVICES MARKET, BY TYPE, 2025-2030 (USD MILLION)
- TABLE 117 SPAIN: MANAGED NETWORK SERVICES MARKET, BY MANAGED NETWORK SECURITY, 2019-2024 (USD MILLION)
- TABLE 118 SPAIN: MANAGED NETWORK SERVICES MARKET, BY MANAGED NETWORK SECURITY, 2025-2030 (USD MILLION)
- TABLE 119 SPAIN: MANAGED NETWORK SERVICES MARKET, BY VERTICAL, 2019-2024 (USD MILLION)
- TABLE 120 SPAIN: MANAGED NETWORK SERVICES MARKET, BY VERTICAL, 2025-2030 (USD MILLION)
- TABLE 121 ASIA PACIFIC: MANAGED NETWORK SERVICES MARKET, BY TYPE, 2019-2024 (USD MILLION)
- TABLE 122 ASIA PACIFIC: MANAGED NETWORK SERVICES MARKET, BY TYPE, 2025-2030 (USD MILLION)
- TABLE 123 ASIA PACIFIC: MANAGED NETWORK SERVICES MARKET, BY MANAGED NETWORK SECURITY, 2019-2024 (USD MILLION)
- TABLE 124 ASIA PACIFIC: MANAGED NETWORK SERVICES MARKET, BY MANAGED NETWORK SECURITY, 2025-2030 (USD MILLION)
- TABLE 125 ASIA PACIFIC: MANAGED NETWORK SERVICES MARKET, BY VERTICAL, 2019-2024 (USD MILLION)
- TABLE 126 ASIA PACIFIC: MANAGED NETWORK SERVICES MARKET, BY VERTICAL, 2025-2030 (USD MILLION)
- TABLE 127 ASIA PACIFIC: MANAGED NETWORK SERVICES MARKET, BY COUNTRY, 2019-2024 (USD MILLION)
- TABLE 128 ASIA PACIFIC: MANAGED NETWORK SERVICES MARKET, BY COUNTRY, 2025-2030 (USD MILLION)
- TABLE 129 CHINA: MANAGED NETWORK SERVICES MARKET, BY TYPE, 2019-2024 (USD MILLION)
- TABLE 130 CHINA: MANAGED NETWORK SERVICES MARKET, BY TYPE, 2025-2030 (USD MILLION)
- TABLE 131 CHINA: MANAGED NETWORK SERVICES MARKET, BY MANAGED NETWORK SECURITY, 2019-2024 (USD MILLION)
- TABLE 132 CHINA: MANAGED NETWORK SERVICES MARKET, BY MANAGED NETWORK SECURITY, 2025-2030 (USD MILLION)
- TABLE 133 CHINA: MANAGED NETWORK SERVICES MARKET, BY VERTICAL, 2019-2024 (USD MILLION)
- TABLE 134 CHINA: MANAGED NETWORK SERVICES MARKET, BY VERTICAL, 2025-2030 (USD MILLION)
- TABLE 135 JAPAN: MANAGED NETWORK SERVICES MARKET, BY TYPE, 2019-2024 (USD MILLION)
- TABLE 136 JAPAN: MANAGED NETWORK SERVICES MARKET, BY TYPE, 2025-2030 (USD MILLION)
- TABLE 137 JAPAN: MANAGED NETWORK SERVICES MARKET, BY MANAGED NETWORK SECURITY, 2019-2024 (USD MILLION)
- TABLE 138 JAPAN: MANAGED NETWORK SERVICES MARKET, BY MANAGED NETWORK SECURITY, 2025-2030 (USD MILLION)
- TABLE 139 JAPAN: MANAGED NETWORK SERVICES MARKET, BY VERTICAL, 2019-2024 (USD MILLION)
- TABLE 140 JAPAN: MANAGED NETWORK SERVICES MARKET, BY VERTICAL, 2025-2030 (USD MILLION)
- TABLE 141 INDIA: MANAGED NETWORK SERVICES MARKET, BY TYPE, 2019-2024 (USD MILLION)
- TABLE 142 INDIA: MANAGED NETWORK SERVICES MARKET, BY TYPE, 2025-2030 (USD MILLION)
- TABLE 143 INDIA: MANAGED NETWORK SERVICES MARKET, BY MANAGED NETWORK SECURITY, 2019-2024 (USD MILLION)
- TABLE 144 INDIA: MANAGED NETWORK SERVICES MARKET, BY MANAGED NETWORK SECURITY, 2025-2030 (USD MILLION)
- TABLE 145 INDIA: MANAGED NETWORK SERVICES MARKET, BY VERTICAL, 2019-2024 (USD MILLION)
- TABLE 146 INDIA: MANAGED NETWORK SERVICES MARKET, BY VERTICAL, 2025-2030 (USD MILLION)
- TABLE 147 AUSTRALIA & NEW ZEALAND: MANAGED NETWORK SERVICES MARKET, BY TYPE, 2019-2024 (USD MILLION)
- TABLE 148 AUSTRALIA & NEW ZEALAND: MANAGED NETWORK SERVICES MARKET, BY TYPE, 2025-2030 (USD MILLION)
- TABLE 149 AUSTRALIA & NEW ZEALAND: MANAGED NETWORK SERVICES MARKET, BY MANAGED NETWORK SECURITY, 2019-2024 (USD MILLION)
- TABLE 150 AUSTRALIA & NEW ZEALAND: MANAGED NETWORK SERVICES MARKET, BY MANAGED NETWORK SECURITY, 2025-2030 (USD MILLION)
- TABLE 151 AUSTRALIA & NEW ZEALAND: MANAGED NETWORK SERVICES MARKET, BY VERTICAL, 2019-2024 (USD MILLION)
- TABLE 152 AUSTRALIA & NEW ZEALAND: MANAGED NETWORK SERVICES MARKET, BY VERTICAL, 2025-2030 (USD MILLION)
- TABLE 153 SOUTH KOREA: MANAGED NETWORK SERVICES MARKET, BY TYPE, 2019-2024 (USD MILLION)
- TABLE 154 SOUTH KOREA: MANAGED NETWORK SERVICES MARKET, BY TYPE, 2025-2030 (USD MILLION)
- TABLE 155 SOUTH KOREA: MANAGED NETWORK SERVICES MARKET, BY MANAGED NETWORK SECURITY, 2019-2024 (USD MILLION)
- TABLE 156 SOUTH KOREA: MANAGED NETWORK SERVICES MARKET, BY MANAGED NETWORK SECURITY, 2025-2030 (USD MILLION)
- TABLE 157 SOUTH KOREA: MANAGED NETWORK SERVICES MARKET, BY VERTICAL, 2019-2024 (USD MILLION)
- TABLE 158 SOUTH KOREA: MANAGED NETWORK SERVICES MARKET, BY VERTICAL, 2025-2030 (USD MILLION)
- TABLE 159 SINGAPORE: MANAGED NETWORK SERVICES MARKET, BY TYPE, 2019-2024 (USD MILLION)
- TABLE 160 SINGAPORE: MANAGED NETWORK SERVICES MARKET, BY TYPE, 2025-2030 (USD MILLION)
- TABLE 161 SINGAPORE: MANAGED NETWORK SERVICES MARKET, BY MANAGED NETWORK SECURITY, 2019-2024 (USD MILLION)
- TABLE 162 SINGAPORE: MANAGED NETWORK SERVICES MARKET, BY MANAGED NETWORK SECURITY, 2025-2030 (USD MILLION)
- TABLE 163 SINGAPORE: MANAGED NETWORK SERVICES MARKET, BY VERTICAL, 2019-2024 (USD MILLION)
- TABLE 164 SINGAPORE: MANAGED NETWORK SERVICES MARKET, BY VERTICAL, 2025-2030 (USD MILLION)
- TABLE 165 MIDDLE EAST & AFRICA: MANAGED NETWORK SERVICES MARKET, BY TYPE, 2019-2024 (USD MILLION)
- TABLE 166 MIDDLE EAST & AFRICA: MANAGED NETWORK SERVICES MARKET, BY TYPE, 2025-2030 (USD MILLION)
- TABLE 167 MIDDLE EAST & AFRICA: MANAGED NETWORK SERVICES MARKET, BY MANAGED NETWORK SECURITY, 2019-2024 (USD MILLION)
- TABLE 168 MIDDLE EAST & AFRICA: MANAGED NETWORK SERVICES MARKET, BY MANAGED NETWORK SECURITY, 2025-2030 (USD MILLION)
- TABLE 169 MIDDLE EAST & AFRICA: MANAGED NETWORK SERVICES MARKET, BY VERTICAL, 2019-2024 (USD MILLION)
- TABLE 170 MIDDLE EAST & AFRICA: MANAGED NETWORK SERVICES MARKET, BY VERTICAL, 2025-2030 (USD MILLION)
- TABLE 171 MIDDLE EAST & AFRICA: MANAGED NETWORK SERVICES MARKET, BY COUNTRY, 2019-2024 (USD MILLION)
- TABLE 172 MIDDLE EAST & AFRICA: MANAGED NETWORK SERVICES MARKET, BY COUNTRY, 2025-2030 (USD MILLION)
- TABLE 173 MIDDLE EAST: MANAGED NETWORK SERVICES MARKET, BY TYPE, 2019-2024 (USD MILLION)
- TABLE 174 MIDDLE EAST: MANAGED NETWORK SERVICES MARKET, BY TYPE, 2025-2030 (USD MILLION)
- TABLE 175 MIDDLE EAST: MANAGED NETWORK SERVICES MARKET, BY MANAGED NETWORK SECURITY, 2019-2024 (USD MILLION)
- TABLE 176 MIDDLE EAST: MANAGED NETWORK SERVICES MARKET, BY MANAGED NETWORK SECURITY, 2025-2030 (USD MILLION)
- TABLE 177 MIDDLE EAST: MANAGED NETWORK SERVICES MARKET, BY VERTICAL, 2019-2024 (USD MILLION)
- TABLE 178 MIDDLE EAST: MANAGED NETWORK SERVICES MARKET, BY VERTICAL, 2025-2030 (USD MILLION)
- TABLE 179 MIDDLE EAST: MANAGED NETWORK SERVICES MARKET, BY COUNTRY, 2019-2024 (USD MILLION)
- TABLE 180 MIDDLE EAST: MANAGED NETWORK SERVICES MARKET, BY COUNTRY, 2025-2030 (USD MILLION)
- TABLE 181 KSA: MANAGED NETWORK SERVICES MARKET, BY TYPE, 2019-2024 (USD MILLION)
- TABLE 182 KSA: MANAGED NETWORK SERVICES MARKET, BY TYPE, 2025-2030 (USD MILLION)
- TABLE 183 KSA: MANAGED NETWORK SERVICES MARKET, BY MANAGED NETWORK SECURITY, 2019-2024 (USD MILLION)
- TABLE 184 KSA: MANAGED NETWORK SERVICES MARKET, BY MANAGED NETWORK SECURITY, 2025-2030 (USD MILLION)
- TABLE 185 KSA: MANAGED NETWORK SERVICES MARKET, BY VERTICAL, 2019-2024 (USD MILLION)
- TABLE 186 KSA: MANAGED NETWORK SERVICES MARKET, BY VERTICAL, 2025-2030 (USD MILLION)
- TABLE 187 UAE: MANAGED NETWORK SERVICES MARKET, BY TYPE, 2019-2024 (USD MILLION)
- TABLE 188 UAE: MANAGED NETWORK SERVICES MARKET, BY TYPE, 2025-2030 (USD MILLION)
- TABLE 189 UAE: MANAGED NETWORK SERVICES MARKET, BY MANAGED NETWORK SECURITY, 2019-2024 (USD MILLION)
- TABLE 190 UAE: MANAGED NETWORK SERVICES MARKET, BY MANAGED NETWORK SECURITY, 2025-2030 (USD MILLION)
- TABLE 191 UAE: MANAGED NETWORK SERVICES MARKET, BY VERTICAL, 2019-2024 (USD MILLION)
- TABLE 192 UAE: MANAGED NETWORK SERVICES MARKET, BY VERTICAL, 2025-2030 (USD MILLION)
- TABLE 193 KUWAIT: MANAGED NETWORK SERVICES MARKET, BY TYPE, 2019-2024 (USD MILLION)
- TABLE 194 KUWAIT: MANAGED NETWORK SERVICES MARKET, BY TYPE, 2025-2030 (USD MILLION)
- TABLE 195 KUWAIT: MANAGED NETWORK SERVICES MARKET, BY MANAGED NETWORK SECURITY, 2019-2024 (USD MILLION)
- TABLE 196 KUWAIT: MANAGED NETWORK SERVICES MARKET, BY MANAGED NETWORK SECURITY, 2025-2030 (USD MILLION)
- TABLE 197 KUWAIT: MANAGED NETWORK SERVICES MARKET, BY VERTICAL, 2019-2024 (USD MILLION)
- TABLE 198 KUWAIT: MANAGED NETWORK SERVICES MARKET, BY VERTICAL, 2025-2030 (USD MILLION)
- TABLE 199 BAHRAIN: MANAGED NETWORK SERVICES MARKET, BY TYPE, 2019-2024 (USD MILLION)
- TABLE 200 BAHRAIN: MANAGED NETWORK SERVICES MARKET, BY TYPE, 2025-2030 (USD MILLION)
- TABLE 201 BAHRAIN: MANAGED NETWORK SERVICES MARKET, BY MANAGED NETWORK SECURITY, 2019-2024 (USD MILLION)
- TABLE 202 BAHRAIN: MANAGED NETWORK SERVICES MARKET, BY MANAGED NETWORK SECURITY, 2025-2030 (USD MILLION)
- TABLE 203 BAHRAIN: MANAGED NETWORK SERVICES MARKET, BY VERTICAL, 2019-2024 (USD MILLION)
- TABLE 204 BAHRAIN: MANAGED NETWORK SERVICES MARKET, BY VERTICAL, 2025-2030 (USD MILLION)
- TABLE 205 AFRICA: MANAGED NETWORK SERVICES MARKET, BY TYPE, 2019-2024 (USD MILLION)
- TABLE 206 AFRICA: MANAGED NETWORK SERVICES MARKET, BY TYPE, 2025-2030 (USD MILLION)
- TABLE 207 AFRICA: MANAGED NETWORK SERVICES MARKET, BY MANAGED NETWORK SECURITY, 2019-2024 (USD MILLION)
- TABLE 208 AFRICA: MANAGED NETWORK SERVICES MARKET, BY MANAGED NETWORK SECURITY, 2025-2030 (USD MILLION)
- TABLE 209 AFRICA: MANAGED NETWORK SERVICES MARKET, BY VERTICAL, 2019-2024 (USD MILLION)
- TABLE 210 AFRICA: MANAGED NETWORK SERVICES MARKET, BY VERTICAL, 2025-2030 (USD MILLION)
- TABLE 211 LATIN AMERICA: MANAGED NETWORK SERVICES MARKET, BY TYPE, 2019-2024 (USD MILLION)
- TABLE 212 LATIN AMERICA: MANAGED NETWORK SERVICES MARKET, BY TYPE, 2025-2030 (USD MILLION)
- TABLE 213 LATIN AMERICA: MANAGED NETWORK SERVICES MARKET, BY MANAGED NETWORK SECURITY, 2019-2024 (USD MILLION)
- TABLE 214 LATIN AMERICA: MANAGED NETWORK SERVICES MARKET, BY MANAGED NETWORK SECURITY, 2025-2030 (USD MILLION)
- TABLE 215 LATIN AMERICA: MANAGED NETWORK SERVICES MARKET, BY VERTICAL, 2019-2024 (USD MILLION)
- TABLE 216 LATIN AMERICA: MANAGED NETWORK SERVICES MARKET, BY VERTICAL, 2025-2030 (USD MILLION)
- TABLE 217 LATIN AMERICA: MANAGED NETWORK SERVICES MARKET, BY COUNTRY, 2019-2024 (USD MILLION)
- TABLE 218 LATIN AMERICA: MANAGED NETWORK SERVICES MARKET, BY COUNTRY, 2025-2030 (USD MILLION)
- TABLE 219 BRAZIL: MANAGED NETWORK SERVICES MARKET, BY TYPE, 2019-2024 (USD MILLION)
- TABLE 220 BRAZIL: MANAGED NETWORK SERVICES MARKET, BY TYPE, 2025-2030 (USD MILLION)
- TABLE 221 BRAZIL: MANAGED NETWORK SERVICES MARKET, BY MANAGED NETWORK SECURITY, 2019-2024 (USD MILLION)
- TABLE 222 BRAZIL: MANAGED NETWORK SERVICES MARKET, BY MANAGED NETWORK SECURITY, 2025-2030 (USD MILLION)
- TABLE 223 BRAZIL: MANAGED NETWORK SERVICES MARKET, BY VERTICAL, 2019-2024 (USD MILLION)
- TABLE 224 BRAZIL: MANAGED NETWORK SERVICES MARKET, BY VERTICAL, 2025-2030 (USD MILLION)
- TABLE 225 MEXICO: MANAGED NETWORK SERVICES MARKET, BY TYPE, 2019-2024 (USD MILLION)
- TABLE 226 MEXICO: MANAGED NETWORK SERVICES MARKET, BY TYPE, 2025-2030 (USD MILLION)
- TABLE 227 MEXICO: MANAGED NETWORK SERVICES MARKET, BY MANAGED NETWORK SECURITY, 2019-2024 (USD MILLION)
- TABLE 228 MEXICO: MANAGED NETWORK SERVICES MARKET, BY MANAGED NETWORK SECURITY, 2025-2030 (USD MILLION)
- TABLE 229 MEXICO: MANAGED NETWORK SERVICES MARKET, BY VERTICAL, 2019-2024 (USD MILLION)
- TABLE 230 MEXICO: MANAGED NETWORK SERVICES MARKET, BY VERTICAL, 2025-2030 (USD MILLION)
- TABLE 231 OVERVIEW OF STRATEGIES DEPLOYED BY KEY MANAGED NETWORK SERVICES MARKET PLAYERS, 2022-2025
- TABLE 232 MANAGED NETWORK SERVICES MARKET: DEGREE OF COMPETITION
- TABLE 233 MANAGED NETWORK SERVICES MARKET: REGION FOOTPRINT
- TABLE 234 MANAGED NETWORK SERVICES MARKET: TYPE FOOTPRINT
- TABLE 235 MANAGED NETWORK SERVICES MARKET: MANAGED NETWORK SECURITY FOOTPRINT
- TABLE 236 MANAGED NETWORK SERVICES MARKET: VERTICAL FOOTPRINT
- TABLE 237 MANAGED NETWORK SERVICES MARKET: LIST OF KEY STARTUPS/SMES
- TABLE 238 MANAGED NETWORK SERVICES MARKET: COMPETITIVE BENCHMARKING OF KEY STARTUPS/SMES
- TABLE 239 MANAGED NETWORK SERVICES MARKET: PRODUCT LAUNCHES AND ENHANCEMENTS, MAY 2023-JUNE 2025
- TABLE 240 MANAGED NETWORK SERVICES MARKET: DEALS, MARCH 2022-AUGUST 2025
- TABLE 241 CISCO: COMPANY OVERVIEW
- TABLE 242 CISCO: PRODUCTS/SOLUTIONS/SERVICES OFFERED
- TABLE 243 CISCO: PRODUCT LAUNCHES
- TABLE 244 CISCO: DEALS
- TABLE 245 AT&T: COMPANY OVERVIEW
- TABLE 246 AT&T: PRODUCTS/SOLUTIONS/SERVICES OFFERED
- TABLE 247 AT&T: DEALS
- TABLE 248 VERIZON: COMPANY OVERVIEW
- TABLE 249 VERIZON: PRODUCTS/SOLUTIONS/SERVICES OFFERED
- TABLE 250 VERIZON: PRODUCT LAUNCHES
- TABLE 251 VERIZON: DEALS
- TABLE 252 NTT: COMPANY OVERVIEW
- TABLE 253 NTT: PRODUCTS/SOLUTIONS/SERVICES OFFERED
- TABLE 254 NTT: PRODUCT LAUNCHES
- TABLE 255 NTT: DEALS
- TABLE 256 DEUTSCHE TELEKOM: COMPANY OVERVIEW
- TABLE 257 DEUTSCHE TELEKOM: PRODUCTS/SOLUTIONS/SERVICES OFFERED
- TABLE 258 DEUTSCHE TELEKOM: PRODUCT LAUNCHES
- TABLE 259 DEUTSCHE TELEKOM: DEALS
- TABLE 260 VODAFONE: COMPANY OVERVIEW
- TABLE 261 VODAFONE: PRODUCTS/SOLUTIONS/SERVICES OFFERED
- TABLE 262 VODAFONE: PRODUCT LAUNCHES
- TABLE 263 VODAFONE: DEALS
- TABLE 264 ORANGE: BUSINESS OVERVIEW
- TABLE 265 ORANGE: PRODUCTS/SOLUTIONS/SERVICES OFFERED
- TABLE 266 ORANGE: PRODUCT LAUNCHES
- TABLE 267 ORANGE: DEALS
- TABLE 268 ERICSSON: BUSINESS OVERVIEW
- TABLE 269 ERICSSON: PRODUCTS/SOLUTIONS/SERVICES OFFERED
- TABLE 270 HUAWEI: COMPANY OVERVIEW
- TABLE 271 HUAWEI: PRODUCTS/SOLUTIONS/SERVICES OFFERED
- TABLE 272 TELEFONICA: BUSINESS OVERVIEW
- TABLE 273 TELEFONICA: PRODUCTS/SOLUTIONS/SERVICES OFFERED
- TABLE 274 MANAGED SERVICES MARKET, BY SERVICE TYPE, 2019-2023 (USD MILLION)
- TABLE 275 MANAGED SERVICES MARKET, BY SERVICE TYPE, 2024-2029 (USD MILLION)
- TABLE 276 MANAGED SERVICES MARKET, BY MANAGED SECURITY SERVICE, 2019-2023 (USD MILLION)
- TABLE 277 MANAGED SERVICES MARKET, BY MANAGED SECURITY SERVICE, 2024-2029 (USD MILLION)
- TABLE 278 MANAGED SERVICES MARKET, BY MANAGED IT INFRASTRUCTURE & DATA CENTER SERVICE, 2019-2023 (USD MILLION)
- TABLE 279 MANAGED SERVICES MARKET, BY MANAGED IT INFRASTRUCTURE & DATA CENTER SERVICE, 2024-2029 (USD MILLION)
- TABLE 280 MANAGED SERVICES MARKET, BY MANAGED COMMUNICATION & COLLABORATION SERVICE, 2019-2023 (USD MILLION)
- TABLE 281 MANAGED SERVICES MARKET, BY MANAGED COMMUNICATION & COLLABORATION SERVICE, 2024-2029 (USD MILLION)
- TABLE 282 MANAGED SERVICES MARKET, BY DEPLOYMENT TYPE, 2019-2023 (USD MILLION)
- TABLE 283 MANAGED SERVICES MARKET, BY DEPLOYMENT TYPE, 2024-2029 (USD MILLION)
- TABLE 284 MANAGED SERVICES MARKET, BY VERTICAL, 2019-2023 (USD MILLION)
- TABLE 285 MANAGED SERVICES MARKET, BY VERTICAL, 2024-2029 (USD MILLION)
- TABLE 286 MANAGED SERVICES MARKET, BY REGION, 2019-2023 (USD MILLION)
- TABLE 287 MANAGED SERVICES MARKET, BY REGION, 2024-2029 (USD MILLION)
- TABLE 288 NETWORK-AS-A-SERVICE MARKET, BY TYPE, 2016-2021 (USD MILLION)
- TABLE 289 NETWORK-AS-A-SERVICE MARKET, BY TYPE, 2022-2027 (USD MILLION)
- TABLE 290 NETWORK-AS-A-SERVICE MARKET, BY APPLICATION, 2016-2021 (USD MILLION)
- TABLE 291 NETWORK-AS-A-SERVICE MARKET, BY APPLICATION, 2022-2027 (USD MILLION)
- TABLE 292 NETWORK-AS-A-SERVICE MARKET, BY ORGANIZATION SIZE, 2016-2021 (USD MILLION)
- TABLE 293 NETWORK-AS-A-SERVICE MARKET, BY ORGANIZATION SIZE, 2022-2027 (USD MILLION)
- TABLE 294 NETWORK-AS-A-SERVICE MARKET, BY END USER, 2016-2021 (USD MILLION)
- TABLE 295 NETWORK-AS-A-SERVICE MARKET, BY END USER, 2022-2027 (USD MILLION)
- TABLE 296 NETWORK-AS-A-SERVICE MARKET, BY REGION, 2016-2021 (USD MILLION)
- TABLE 297 NETWORK-AS-A-SERVICE MARKET, BY REGION, 2022-2027 (USD MILLION)
List of Figures
- FIGURE 1 MANAGED NETWORK SERVICES MARKET: RESEARCH DESIGN
- FIGURE 2 DATA TRIANGULATION
- FIGURE 3 RESEARCH METHODOLOGY: APPROACH
- FIGURE 4 MARKET SIZE ESTIMATION METHODOLOGY: APPROACH 1 (SUPPLY SIDE): REVENUE OF MANAGED NETWORK SERVICES MARKET
- FIGURE 5 MARKET SIZE ESTIMATION METHODOLOGY- APPROACH 1 BOTTOM-UP (SUPPLY SIDE): COLLECTIVE REVENUE OF MANAGED NETWORK SERVICES VENDORS
- FIGURE 6 TOP-DOWN APPROACH
- FIGURE 7 BOTTOM-UP APPROACH
- FIGURE 8 MANAGED NETWORK SERVICES MARKET, 2023-2030 (USD MILLION)
- FIGURE 9 MANAGED NETWORK SERVICES MARKET, REGIONAL SHARE, 2025
- FIGURE 10 TECHNOLOGICAL ADVANCEMENTS IN ENTERPRISE NETWORKS TO DRIVE MARKET
- FIGURE 11 MANAGED WAN SEGMENT AND US TO DOMINATE MARKET IN NORTH AMERICA
- FIGURE 12 MANAGED WAN SEGMENT TO ACCOUNT FOR LARGEST MARKET SHARE IN 2025
- FIGURE 13 BFSI SEGMENT TO ACCOUNT FOR LARGEST MARKET SHARE IN 2025
- FIGURE 14 MANAGED IDS/IPS SEGMENT TO ACCOUNT FOR LARGEST MARKET SHARE IN 2025
- FIGURE 15 MANAGED NETWORK SERVICES MARKET: DRIVERS, RESTRAINTS, OPPORTUNITIES, AND CHALLENGES
- FIGURE 16 BRIEF HISTORY OF MANAGED NETWORK SERVICES MARKET
- FIGURE 17 MANAGED NETWORK SERVICES MARKET: VALUE CHAIN ANALYSIS
- FIGURE 18 KEY PLAYERS IN MANAGED NETWORK SERVICES MARKET ECOSYSTEM
- FIGURE 19 MANAGED NETWORK SERVICES MARKET: PORTER'S FIVE FORCES ANALYSIS
- FIGURE 20 INFLUENCE OF STAKEHOLDERS ON BUYING PROCESS FOR KEY VERTICALS
- FIGURE 21 KEY BUYING CRITERIA FOR TOP THREE VERTICALS
- FIGURE 22 LIST OF MAJOR PATENTS FOR MANAGED NETWORK SERVICES
- FIGURE 23 MANAGED NETWORK SERVICES MARKET: TRENDS/DISRUPTIONS IMPACTING CUSTOMER BUSINESS
- FIGURE 24 AVERAGE SELLING PRICE OF SERVICE TYPES, BY KEY PLAYER, 2024
- FIGURE 25 TOOLS, FRAMEWORKS, AND TECHNIQUES USED IN MANAGED NETWORK SERVICES MARKET
- FIGURE 26 MANAGED NETWORK SERVICES MARKET: INVESTMENT AND FUNDING SCENARIO
- FIGURE 27 USE CASES OF GENERATIVE AI IN MANAGED NETWORK SERVICES
- FIGURE 28 MANAGED WAN SEGMENT TO HOLD LARGEST SHARE DURING FORECAST PERIOD
- FIGURE 29 MANAGED IDS/IPS SEGMENT TO HOLD LARGEST SHARE DURING FORECAST PERIOD
- FIGURE 30 BFSI VERTICAL TO HOLD MAJOR MARKET DURING FORECAST PERIOD
- FIGURE 31 NORTH AMERICA: MARKET SNAPSHOT
- FIGURE 32 ASIA PACIFIC: MARKET SNAPSHOT
- FIGURE 33 REVENUE ANALYSIS OF KEY PLAYERS IN MANAGED NETWORK SERVICES MARKET, 2022-2024
- FIGURE 34 SHARES OF LEADING COMPANIES IN MANAGED NETWORK SERVICES MARKET, 2024
- FIGURE 35 MANAGED NETWORK SERVICES MARKET: BRAND/PRODUCT COMPARISON
- FIGURE 36 COMPANY VALUATION, 2025
- FIGURE 37 FINANCIAL METRICS OF KEY VENDORS, 2025
- FIGURE 38 MANAGED NETWORK SERVICES MARKET: COMPANY EVALUATION MATRIX (KEY PLAYERS), 2024
- FIGURE 39 MANAGED NETWORK SERVICES MARKET: COMPANY FOOTPRINT
- FIGURE 40 MANAGED NETWORK SERVICES MARKET: COMPANY EVALUATION MATRIX (STARTUPS/SMES), 2024
- FIGURE 41 CISCO: COMPANY SNAPSHOT
- FIGURE 42 AT&T: COMPANY SNAPSHOT
- FIGURE 43 VERIZON: COMPANY SNAPSHOT
- FIGURE 44 NTT: COMPANY SNAPSHOT
- FIGURE 45 DEUTSCHE TELEKOM: COMPANY SNAPSHOT
- FIGURE 46 VODAFONE: COMPANY SNAPSHOT
- FIGURE 47 ORANGE: COMPANY SNAPSHOT
- FIGURE 48 ERICSSON: COMPANY SNAPSHOT
- FIGURE 49 TELEFONICA: COMPANY SNAPSHOT
 託管網路服務市場-2026-2032年全球市場預測
 骨幹網路服務市場:按網路類型、網路拓撲、服務類型、最終用戶產業、資料速度/容量、網路供應商和地區分類
 託管式區域網路/廣域網路服務市場預測至2034年-按服務類型、部署類型、組織規模、最終用戶和地區分類的全球分析
 全球託管網路服務市場規模、佔有率、趨勢和成長分析報告(2026-2034年)
 2026年全球託管網路服務市場報告
 託管網路服務市場分析及預測(至 2035 年):按類型、產品類型、服務、技術、組件、應用、部署類型、最終用戶和解決方案分類
 託管網路服務市場規模、佔有率和成長分析(按類型、託管網路安全、垂直產業和地區分類)-2026-2033年產業預測
 託管網路服務市場-全球產業規模、佔有率、趨勢、機會及預測(按類型、組織規模(中小企業和大型企業)、最終用戶、地區和競爭格局分類,2020-2030 年預測)
 網路營運中心(NOC)即服務市場機會、成長促進因素、產業趨勢分析及預測(2025-2034年)託管網路服務市場機會、成長促進因素、產業趨勢分析及預測(2025-2034 年)