

 |
市場調查報告書
商品編碼
1871154
網路營運中心(NOC)即服務市場機會、成長促進因素、產業趨勢分析及預測(2025-2034年)Network Operations Center (NOC) as a Service Market Opportunity, Growth Drivers, Industry Trend Analysis, and Forecast 2025 - 2034 |
||||||
2024 年全球網路營運中心 (NOC) 即服務市場價值為 34 億美元,預計到 2034 年將以 10.7% 的複合年成長率成長至 92 億美元。
企業加速數位轉型並採用先進的網路管理解決方案是推動成長的主要因素。人工智慧 (AI)、機器學習 (ML) 和自動化正在革新網路營運中心 (NOC) 的營運,實現預測性事件解決、智慧回應管理和資源最佳化配置。日益複雜的 IT 網路、不斷成長的持續可視性需求以及主動網路安全要求是推動市場採用的主要因素。企業傾向於採用混合模式,將本地基礎設施與雲端功能結合,以實現可擴展性和分析能力。醫療保健、金融服務和政府等關鍵產業正在引領這些混合 NOC 模式的採用。 NOC 與安全營運中心 (SOC) 的整合正成為一種核心趨勢,提供統一的威脅檢測、監控和回應。以結果為導向的服務模式正在重塑傳統的 NOC 契約,更加重視性能、正常運行時間和營運效率。
| 市場範圍 | |
|---|---|
| 起始年份 | 2024 |
| 預測年份 | 2025-2034 |
| 起始值 | 34億美元 |
| 預測值 | 92億美元 |
| 複合年成長率 | 10.7% |
網路監控和管理領域在2024年佔據了33%的市場佔有率,預計到2034年將以10.8%的複合年成長率成長,達到30億美元。持續監控和效能最佳化,以及警告關聯和事件管理,凸顯了該領域的重要性。
2024年,基於雲端的部署領域創造了16.2億美元的收入,預計到2034年將達到46.4億美元。由於可擴展性、成本效益以及對人工智慧/機器學習資源的訪問,雲端網路營運中心(NOC)解決方案的採用率正在上升。分散式企業和中小企業無需大量前期投資即可受益於快速部署、全球訪問和企業級功能。
預計到2024年,北美網路營運中心(NOC)即服務市佔率將達到42%。人工智慧驅動的自動化、混合IT環境和雲端運算的日益普及,正促使美國和加拿大的企業將網路監控外包,以提高正常運行時間、降低成本並實現主動網路管理。智慧型NOC解決方案能夠實現自動化事件偵測、根本原因分析和預測性效能最佳化。
網路營運中心即服務 (NOCaaS) 市場的主要參與者包括 IBM、思科系統、INOC、Kaseya、諾基亞、Park Place Technologies、iGLASS Networks、富士通、Infrassist Technologies 和 Sify Technologies。 NOCaaS 市場的領導者正致力於透過多種策略來鞏固其市場地位。他們投資於人工智慧 (AI) 和機器學習 (ML) 驅動的工具,以增強預測性監控和自動化事件解決能力。與雲端服務供應商和 IT 服務公司的策略合作正在拓展其服務組合和地理覆蓋範圍。各公司也正在開發混合型 NOC-SOC 解決方案,以提供整合的網路安全和網路管理服務。此外,各公司優先考慮基於訂閱和結果導向的服務模式,以吸引長期企業合約。自動化、可擴展性和即時分析的創新正在幫助企業保持競爭優勢,同時滿足客戶對效率、可視性和彈性的日益成長的需求。
目錄
第1章:方法論
- 市場範圍和定義
- 研究設計
- 研究方法
- 資料收集方法
- 資料探勘來源
- 全球的
- 地區/國家
- 基準估算和計算
- 基準年計算
- 市場估算的關鍵趨勢
- 初步研究和驗證
- 原始資料
- 預測模型
- 研究假設和局限性
第2章:執行概要
第3章:行業洞察
- 產業生態系分析
- 供應商格局
- 利潤率分析
- 成本結構
- 每個階段的價值增加
- 影響價值鏈的因素
- 中斷
- 產業影響因素
- 成長促進因素
- 數位轉型與雲端遷移
- 關鍵技能短缺和人才缺口
- 人工智慧/機器學習和自動化整合
- 安全融合與合規性要求
- 成本最佳化與營運支出模式偏好
- 產業陷阱與挑戰
- 平台整合趨勢
- 基於結果的服務演進
- 市場機遇
- 邊緣和物聯網網路營運
- 人工智慧驅動的預測操作
- SASE 和 SD-WAN 管理營運
- 多雲網路管理
- 成長潛力分析
- 監管環境
- 波特的分析
- PESTEL 分析
- 技術與創新格局
- 當前技術趨勢
- 新興技術
- 價格趨勢和經濟分析
- 歷史價格演變(2019-2024)
- 服務層級定價基準
- 地理定價差異
- 依部署模式進行投資報酬率和總擁有成本分析
- 定價壓力點和市場動態
- 專利分析
- 永續性和環境方面
- 永續實踐
- 減少廢棄物策略
- 生產中的能源效率
- 環保舉措
- 碳足跡考量
- 客戶需求與產品供應差距分析
- 企業客戶痛點識別
- 中小企業未滿足需求分析
- MSP合作夥伴能力差距
- 產業特定合規性差距
- 客戶旅程圖與體驗分析
- 企業買家旅程分析
- 決策過程和利害關係人
- 供應商評估標準
- 實施時間表和挑戰
- 公司投資與創新格局
- 公司研發投資分析
- 專利申請趨勢與創新重點
- 創投與私募股權活動
- 併購交易分析(2022-2024)
- 策略夥伴關係形成趨勢
- 案例研究和實施分析
- 世界500強企業網路營運中心轉型案例研究
- 政府機構FISMA合規實施
- 符合 HIPAA 標準的醫療保健網路 NOC 部署
- MSP白標整合成功案例
- 製造物聯網網路監控案例研究
第4章:競爭格局
- 介紹
- 公司市佔率分析
- 北美洲
- 歐洲
- 亞太地區
- 拉丁美洲
- MEA
- 主要市場參與者的競爭分析
- 競爭定位矩陣
- 戰略展望矩陣
- 關鍵進展
- 併購
- 合作夥伴關係與合作
- 新產品發布
- 擴張計劃和資金
- 競爭標竿矩陣
- 服務能力比較
- 技術堆疊分析
- 地理覆蓋範圍評估
- 客戶滿意度基準測試
- 網路產業生態系圖譜
- 網路設備供應商的進入策略
- 雲端供應商網路營運中心(NOC)服務演進
- 電信營運商管理服務
- 系統整合商合作模式
第5章:市場估計與預測:依服務業分類,2021-2034年
- 主要趨勢
- 網路監控與管理
- 事件回應和故障排除
- 安全監控與管理
- 效能最佳化
- 備份和復原服務
- 報告和分析
第6章:市場估算與預測:依部署模式分類,2021-2034年
- 主要趨勢
- 現場
- 基於雲端的
- 混合
第7章:市場估算與預測:依組織規模分類,2021-2034年
- 主要趨勢
- 中小企業
- 大型企業
第8章:市場估算與預測:依支撐模式分類,2021-2034年
- 主要趨勢
- 反應式支持
- 主動支持
- 預測支持
第9章:市場估算與預測:依整合模型分類,2021-2034年
- 主要趨勢
- 獨立網路營運中心
- ITSM整合的網路營運中心
- SOC整合NOC
- MSP 白標整合
第10章:市場估計與預測:依最終用途分類,2021-2034年
- 主要趨勢
- 銀行、金融服務和保險 (BFSI)
- 醫療保健與生命科學
- 資訊科技與電信
- 政府和公共部門
- 製造業
- 零售
- 其他
第11章:市場估計與預測:按地區分類,2021-2034年
- 主要趨勢
- 北美洲
- 美國
- 加拿大
- 歐洲
- 德國
- 英國
- 法國
- 義大利
- 西班牙
- 俄羅斯
- 北歐
- 葡萄牙
- 克羅埃西亞
- 亞太地區
- 中國
- 印度
- 日本
- 澳洲
- 韓國
- 新加坡
- 泰國
- 印尼
- 越南
- 拉丁美洲
- 巴西
- 墨西哥
- 阿根廷
- MEA
- 南非
- 沙烏地阿拉伯
- 阿拉伯聯合大公國
- 土耳其
第12章:公司簡介
- 全球參與者
- Cisco Systems
- Fujitsu
- HCL Technologies
- IBM Corporation
- NTT Communications
- Network Equipment Vendors
- Arista Networks
- Extreme Networks
- Fortinet
- Juniper Networks
- Cloud Provider NOC Services
- Amazon Web Services (AWS)
- Google Cloud
- Microsoft
- Telecommunications Operator NOC Services
- AT&T Business
- BT
- Verizon Business
- Specialized NOC Service Providers
- iGLASS Networks
- Infrassist Technologies
- INOC
- Kaseya
- Park Place Technologies
- Sify Technologies
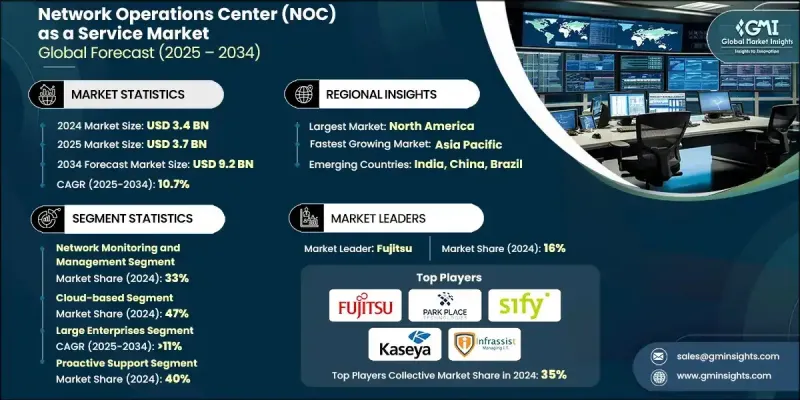
The Global Network Operations Center (NOC) as a Service Market was valued at USD 3.4 Billion in 2024 and is estimated to grow at a CAGR of 10.7% to reach USD 9.2 Billion by 2034.
The growth is driven by enterprises accelerating digital transformation and adopting advanced network management solutions. Artificial intelligence (AI), machine learning (ML), and automation are revolutionizing NOC operations, enabling predictive incident resolution, intelligent response management, and optimal allocation of resources. Increasing IT network complexity, rising demand for continuous visibility, and proactive cybersecurity requirements are major factors fueling market adoption. Organizations are favoring hybrid approaches that combine on-premises infrastructure with cloud-based capabilities for scalability and analytics. Key sectors like healthcare, financial services, and government are leading the adoption of these hybrid NOC models. Integration of NOC and Security Operations Centers (SOC) is emerging as a central trend, offering unified threat detection, monitoring, and response. Outcome-driven service models are reshaping traditional NOC contracts, emphasizing performance, uptime, and operational efficiency.
| Market Scope | |
|---|---|
| Start Year | 2024 |
| Forecast Year | 2025-2034 |
| Start Value | $3.4 Billion |
| Forecast Value | $9.2 Billion |
| CAGR | 10.7% |
The network monitoring and management segment held a 33% share in 2024 and is projected to grow at a CAGR of 10.8% through 2034, reaching USD 3 Billion. Continuous monitoring and performance optimization, alongside alarm correlation and event management, underscore the critical importance of this segment.
The cloud-based deployments segment generated USD 1.62 Billion in 2024 and is expected to reach USD 4.64 Billion by 2034. The adoption of cloud NOC solutions is rising due to scalability, cost-effectiveness, and access to AI/ML resources. Distributed enterprises and small-to-medium businesses benefit from rapid deployment, global access, and enterprise-grade functionality without heavy upfront investments.
North America Network Operations Center (NOC) as a Service Market held a 42% share in 2024. Growing adoption of AI-driven automation, hybrid IT environments, and cloud computing is driving enterprises in the US and Canada to outsource network monitoring for improved uptime, cost efficiency, and proactive network management. Intelligent NOC solutions are enabling automated incident detection, root-cause analysis, and predictive performance optimization.
Key players in the Network Operations Center (NOC) as a Service Market include IBM, Cisco Systems, INOC, Kaseya, Nokia, Park Place Technologies, iGLASS Networks, Fujitsu, Infrassist Technologies, and Sify Technologies. Leading companies in the Network Operations Center (NOC) as a Service Market are focusing on several strategies to strengthen their market position. They are investing in AI and ML-driven tools to enhance predictive monitoring and automated incident resolution. Strategic partnerships with cloud providers and IT service companies are expanding their service portfolios and geographic reach. Firms are also developing hybrid NOC-SOC solutions to offer integrated cybersecurity and network management services. Additionally, companies are prioritizing subscription-based and outcome-oriented service models to attract long-term enterprise contracts. Innovation in automation, scalability, and real-time analytics is helping businesses maintain competitive differentiation while addressing growing customer demands for efficiency, visibility, and resilience.
Table of Contents
Chapter 1 Methodology
- 1.1 Market scope and definition
- 1.2 Research design
- 1.2.1 Research approach
- 1.2.2 Data collection methods
- 1.3 Data mining sources
- 1.3.1 Global
- 1.3.2 Regional/Country
- 1.4 Base estimates and calculations
- 1.4.1 Base year calculation
- 1.4.2 Key trends for market estimation
- 1.5 Primary research and validation
- 1.5.1 Primary sources
- 1.6 Forecast model
- 1.7 Research assumptions and limitations
Chapter 2 Executive Summary
- 2.1 Industry 3600 synopsis, 2021 - 2034
- 2.2 Key market trends
- 2.2.1 Regional
- 2.2.2 Services
- 2.2.3 Deployment Mode
- 2.2.4 Organization Size
- 2.2.5 Support Model
- 2.2.6 End Use
- 2.3 TAM Analysis, 2025-2034
- 2.4 CXO perspectives: Strategic imperatives
- 2.4.1 Executive decision points
- 2.4.2 Critical success factors
- 2.5 Future outlook and strategic recommendations
Chapter 3 Industry Insights
- 3.1 Industry ecosystem analysis
- 3.1.1 Supplier landscape
- 3.1.2 Profit margin analysis
- 3.1.3 Cost structure
- 3.1.4 Value addition at each stage
- 3.1.5 Factor affecting the value chain
- 3.1.6 Disruptions
- 3.2 Industry impact forces
- 3.2.1.1 Growth drivers
- 3.2.1.2 Digital transformation and cloud migration
- 3.2.1.3 Critical skills shortage and talent gap
- 3.2.1.4 AI/ML and automation integration
- 3.2.1.5 Security convergence and compliance requirements
- 3.2.1.6 Cost optimization and OPEX model preference
- 3.2.2 Industry pitfalls and challenges
- 3.2.2.1 Platform consolidation and integration trend
- 3.2.2.2 Outcome-based service evolution
- 3.2.3 Market opportunities
- 3.2.3.1 Edge and IoT network operations
- 3.2.3.2 AI-powered predictive operations
- 3.2.3.3 SASE and SD-WAN managed operations
- 3.2.3.4 Multi-cloud network management
- 3.3 Growth potential analysis
- 3.4 Regulatory landscape
- 3.5 Porter's analysis
- 3.6 PESTEL analysis
- 3.7 Technology and innovation landscape
- 3.7.1 Current technological trends
- 3.7.2 Emerging technologies
- 3.8 Pricing trends and economic analysis
- 3.8.1 Historical pricing evolution (2019-2024)
- 3.8.2 Service tier pricing benchmarking
- 3.8.3 Geographic pricing variations
- 3.8.4 ROI and TCO analysis by deployment model
- 3.8.5 Pricing pressure points and market dynamics
- 3.9 Patent analysis
- 3.10 Sustainability and environmental aspects
- 3.10.1 Sustainable practices
- 3.10.2 Waste reduction strategies
- 3.10.3 Energy efficiency in production
- 3.10.4 Eco-friendly Initiatives
- 3.10.5 Carbon footprint considerations
- 3.11 Customer needs vs. product offering gap analysis
- 3.11.1 Enterprise customer pain points identification
- 3.11.2 SMB unmet requirements analysis
- 3.11.3 MSP partner capability gaps
- 3.11.4 Industry-specific compliance gaps
- 3.12 Customer journey mapping and experience analysis
- 3.12.1 Enterprise buyer journey analysis
- 3.12.2 Decision-making process and stakeholders
- 3.12.3 Vendor evaluation criteria
- 3.12.4 Implementation timeline and challenges
- 3.13 Company investment and innovation landscape
- 3.13.1 R&D investment analysis by company
- 3.13.2 Patent filing trends and innovation focus
- 3.13.3 Venture capital and private equity activity
- 3.13.4 M&A transaction analysis (2022-2024)
- 3.13.5 Strategic partnership formation trends
- 3.14 Case studies and implementation analysis
- 3.14.1 Fortune 500 NOC transformation case study
- 3.14.2 Government agency FISMA compliance implementation
- 3.14.3 Healthcare network HIPAA-compliant NOC deployment
- 3.14.4 MSP white-label integration success story
- 3.14.5 Manufacturing IoT network monitoring case study
Chapter 4 Competitive Landscape, 2024
- 4.1 Introduction
- 4.2 Company market share analysis
- 4.2.1 North America
- 4.2.2 Europe
- 4.2.3 Asia Pacific
- 4.2.4 LATAM
- 4.2.5 MEA
- 4.3 Competitive analysis of major market players
- 4.4 Competitive positioning matrix
- 4.5 Strategic outlook matrix
- 4.6 Key developments
- 4.6.1 Mergers & acquisitions
- 4.6.2 Partnerships & collaborations
- 4.6.3 New Product Launches
- 4.6.4 Expansion Plans and funding
- 4.7 Competitive benchmarking matrix
- 4.7.1 Service capability comparison
- 4.7.2 Technology stack analysis
- 4.7.3 Geographic coverage assessment
- 4.7.4 Customer satisfaction benchmarking
- 4.8 Networking industry ecosystem mapping
- 4.8.1 Network equipment vendors entry strategies
- 4.8.2 Cloud provider NOC service evolution
- 4.8.3 Telecom operator managed services
- 4.8.4 System integrator partnership models
Chapter 5 Market Estimates & Forecast, By Services, 2021 - 2034 (USD Mn)
- 5.1 Key trends
- 5.2 Network monitoring and management
- 5.3 Incident response and troubleshooting
- 5.4 Security monitoring and management
- 5.5 Performance optimization
- 5.6 Backup and recovery services
- 5.7 Reporting and analytics
Chapter 6 Market Estimates & Forecast, By Deployment Mode, 2021 - 2034 (USD Mn)
- 6.1 Key trends
- 6.2 On-premises
- 6.3 Cloud-based
- 6.4 Hybrid
Chapter 7 Market Estimates & Forecast, By Organization Size, 2021 - 2034 (USD Mn)
- 7.1 Key trends
- 7.2 Small and medium-sized enterprises (SMEs)
- 7.3 Large enterprises
Chapter 8 Market Estimates & Forecast, By Support Model, 2021 - 2034 (USD Mn)
- 8.1 Key trends
- 8.2 Reactive support
- 8.3 Proactive support
- 8.4 Predictive support
Chapter 9 Market Estimates & Forecast, By Integration Model, 2021 - 2034 (USD Mn)
- 9.1 Key trends
- 9.2 Standalone NOC
- 9.3 ITSM-integrated NOC
- 9.4 SOC-integrated NOC
- 9.5 MSP White-label integration
Chapter 10 Market Estimates & Forecast, By End Use, 2021 - 2034 (USD Mn)
- 10.1 Key trends
- 10.2 BFSI (banking, financial services, and insurance)
- 10.3 Healthcare & life sciences
- 10.4 IT & telecommunications
- 10.5 Government & public sector
- 10.6 Manufacturing
- 10.7 Retail
- 10.8 Others
Chapter 11 Market Estimates & Forecast, By Region, 2021 - 2034 (USD Mn)
- 11.1 Key trends
- 11.2 North America
- 11.2.1 US
- 11.2.2 Canada
- 11.3 Europe
- 11.3.1 Germany
- 11.3.2 UK
- 11.3.3 France
- 11.3.4 Italy
- 11.3.5 Spain
- 11.3.6 Russia
- 11.3.7 Nordics
- 11.3.8 Portugal
- 11.3.9 Croatia
- 11.4 Asia Pacific
- 11.4.1 China
- 11.4.2 India
- 11.4.3 Japan
- 11.4.4 Australia
- 11.4.5 South Korea
- 11.4.6 Singapore
- 11.4.7 Thailand
- 11.4.8 Indonesia
- 11.4.9 Vietnam
- 11.5 Latin America
- 11.5.1 Brazil
- 11.5.2 Mexico
- 11.5.3 Argentina
- 11.6 MEA
- 11.6.1 South Africa
- 11.6.2 Saudi Arabia
- 11.6.3 UAE
- 11.6.4 Turkey
Chapter 12 Company Profiles
- 12.1 Global Players
- 12.1.1 Cisco Systems
- 12.1.2 Fujitsu
- 12.1.3 HCL Technologies
- 12.1.4 IBM Corporation
- 12.1.5 NTT Communications
- 12.2 Network Equipment Vendors
- 12.2.1 Arista Networks
- 12.2.2 Extreme Networks
- 12.2.3 Fortinet
- 12.2.4 Juniper Networks
- 12.3 Cloud Provider NOC Services
- 12.3.1 Amazon Web Services (AWS)
- 12.3.2 Google Cloud
- 12.3.3 Microsoft
- 12.4 Telecommunications Operator NOC Services
- 12.4.1 AT&T Business
- 12.4.2 BT
- 12.4.3 Verizon Business
- 12.5 Specialized NOC Service Providers
- 12.5.1 iGLASS Networks
- 12.5.2 Infrassist Technologies
- 12.5.3 INOC
- 12.5.4 Kaseya
- 12.5.5 Park Place Technologies
- 12.5.6 Sify Technologies
 託管網路服務市場-2026-2032年全球市場預測
 骨幹網路服務市場:按網路類型、網路拓撲、服務類型、最終用戶產業、資料速度/容量、網路供應商和地區分類
 託管式區域網路/廣域網路服務市場預測至2034年-按服務類型、部署類型、組織規模、最終用戶和地區分類的全球分析
 全球託管網路服務市場規模、佔有率、趨勢和成長分析報告(2026-2034年)
 2026年全球託管網路服務市場報告
 託管網路服務市場分析及預測(至 2035 年):按類型、產品類型、服務、技術、組件、應用、部署類型、最終用戶和解決方案分類
 託管網路服務市場規模、佔有率和成長分析(按類型、託管網路安全、垂直產業和地區分類)-2026-2033年產業預測
 託管網路服務市場-全球產業規模、佔有率、趨勢、機會及預測(按類型、組織規模(中小企業和大型企業)、最終用戶、地區和競爭格局分類,2020-2030 年預測)
 全球託管網路服務市場(至2030年)按類型(託管區域網路、託管Wi-Fi、託管廣域網路、託管VPN、網路監控、託管NFV、託管網路安全)、產業(銀行、金融服務和保險、IT與通訊、製造業)和地區分類
 託管網路服務市場機會、成長促進因素、產業趨勢分析及預測(2025-2034 年)