


 |
市場調查報告書
商品編碼
1830045
全球碳捕獲材料市場(按工藝、材料、技術、最終用戶和地區分類)- 預測至 2030 年Carbon Capture Materials Market by Material, Process, Technique, End-Use Industry & Region - Forecast to 2030 |
||||||
碳捕獲材料市場規模預計將從 2025 年的 669.047 億美元成長到 2030 年的 990.985 億美元,預測期內複合年成長率為 8.2%。
| 調查範圍 | |
|---|---|
| 調查年份 | 2021-2030 |
| 基準年 | 2024 |
| 預測期 | 2025-2030 |
| 對價單位 | 金額(百萬美元/十億美元)、數量(千噸) |
| 部分 | 按工藝、材料、技術、最終用戶和地區 |
| 目標區域 | 北美、歐洲、亞太地區、中東和非洲、南美 |
推動碳捕獲材料市場發展的關鍵因素包括嚴格的氣候政策、日益成長的企業永續性承諾以及技術進步。嚴格的政府法規迫使各行各業減少溫室氣體排放,從而推動了對高效能碳捕獲材料的需求。致力於實現淨零目標的公司越來越重視永續材料和碳減排,推動了市場採用。
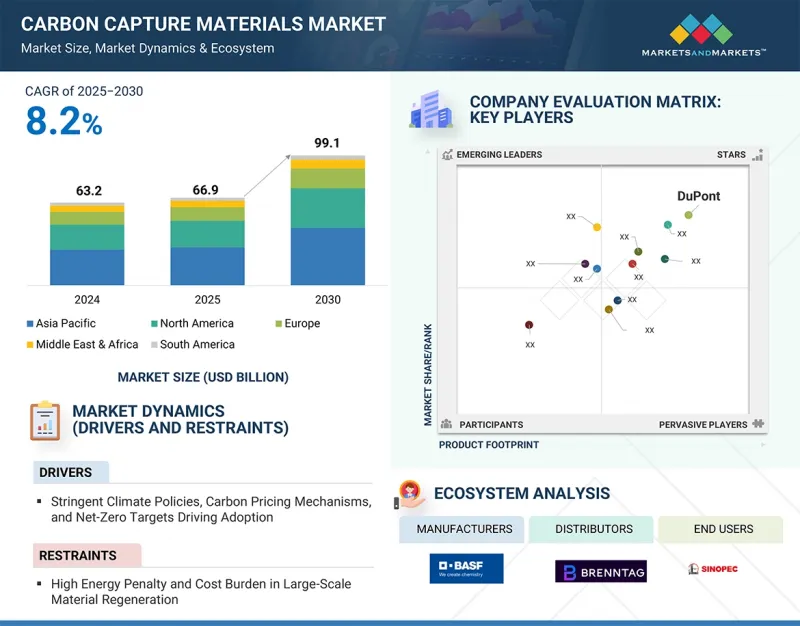
此外,生物基和循環碳捕獲材料的技術創新正在提高效率、降低成本、增強環境效益並擴大使用案例。這些因素正在創造有利的市場條件,並透過吸引整個產業的投資來支持快速成長,以減輕氣候變遷的影響並遵守環境法規。
液體溶劑(包括胺基和鹼基溶液)因其在捕獲工業排放中的二氧化碳方面已證實的高效性和多功能性,成為碳捕獲市場中成長最快的材料。胺基溶劑因其對二氧化碳分子的高親和性而得到了數十年的廣泛應用,從而能夠有效地捕獲二氧化碳。它們能夠吸收煙氣中常見的二氧化碳,即使在低濃度下也是如此。這一良好的業績記錄使其在燃燒後碳捕獲過程中具有可靠性,尤其是在碳排放備受關注的發電和工業領域。
溶劑配方的進步顯著提高了再生能源需求並降低了營業成本,使這些解決方案在經濟上可行。技術創新也正在解決溶劑的缺點,例如劣化和腐蝕,並提高這些材料的耐用性和生命週期。同時,鹼性溶劑具有與二氧化碳反應速度更快、適用於各種製程條件等優勢,拓寬了它們的工業應用範圍。液體溶劑系統因其靈活性而實現了顯著成長,使其無需進行大量改造即可整合到現有的工業設備中。這些溶劑可以適應廢氣成分和溫度的變化,並可根據特定的製程需求進行客製化。全球強大的減少碳排放監管壓力也促使各行各業採用這些成熟的溶劑技術。
吸附技術憑藉其高能源效率、多功能性以及與可擴展脫碳解決方案的契合度,成為碳捕獲市場中成長最快的製程環節。吸附技術利用沸石和金屬有機骨架等固體材料,從氣流中捕獲二氧化碳,捕獲效率高達 90%,通常比吸收製程節省 30% 的能耗。其快速成長的驅動力在於其在燃燒後和直接空氣捕獲中的適用性,能夠應對從發電廠到環境空氣的各種排放源。吸附技術的模組化和緊湊系統使其能夠輕鬆整合到現有的工業設施中,例如水泥廠和鋼鐵廠,從而降低改造成本。高容量、高選擇性的吸附劑創新技術提升了性能,為從小型到大型應用提供了經濟高效的製程。對負排放技術日益成長的需求,加上碳定價等支持性政策,正在加速其應用,尤其是在淨零排放目標嚴格的地區。吸附劑的環境效益,例如與液體溶劑相比減少化學廢棄物,進一步增強了其吸引力。吸附技術具有處理低濃度二氧化碳的能力,並且在物料輸送方面不斷改進,是成長最快的工藝,滿足了對高效、可擴展的碳捕獲解決方案的迫切需求。
燃燒前碳捕集是碳捕集市場中成長最快的技術,因為它具備多項關鍵優勢,使其高效且有望實現大規模脫碳。與燃燒後捕集不同,燃燒前碳捕集技術透過氣化或重整過程將石化燃料轉化為氫氣和二氧化碳的混合物(稱為合成氣),在燃燒前去除二氧化碳。這會產生高二氧化碳濃度和壓力的氣流,大大提高了透過物理或化學吸收方法捕捉的便利性和效率。高二氧化碳濃度意味著燃燒前捕集所需的設備和分離能耗更低,與其他方法相比,降低了資本和營業成本。該製程產生的氫氣是一種清潔燃料,是一種有價值的產品,可支持更廣泛的能源轉型,即向低碳氫化合物經濟轉型。此外,燃燒前碳捕集可以整合到專為清潔能源生產而設計的新工廠和工業設施中,使其成為符合全球脫碳趨勢的前瞻性方法。雖然氣化系統的初始投資高於傳統系統,但其捕獲效率提高、能源成本降低和燃料品質改善等長期效益正推動其發展。此外,隨著工業界尋求排放,燃燒前技術提供了以相對較低的成本捕獲大量二氧化碳的有效解決方案。
石油和天然氣產業是全球二氧化碳排放的重要貢獻者,由於減少二氧化碳排放的壓力越來越大,它是碳捕獲市場中成長最快的終端產業。該產業在其上游、中游和下游環節中運行許多碳密集型流程,使捕碳封存(CCS) 成為有效減少排放的重要技術。成長的主要驅動力之一是 CCS 能夠在解決環境問題的同時繼續使用石化燃料,支援產業轉型為低碳營運而不會中斷生產。市場的一個關鍵驅動力是 CCS 與提高採收率(EOR) 技術的結合。將捕獲的二氧化碳注入成熟油田以加強石油開採,可實現減少排放和提高資源回收率的雙重好處。這種協同作用為採用 CCS 創造了經濟獎勵,使其比其他產業更具經濟可行性。此外,監管要求和全球淨零承諾迫使石油和天然氣公司大力投資碳捕獲技術,以滿足氣候變遷目標和相關人員的永續性期望。提高捕集效率、降低成本並確保二氧化碳安全封存的技術進步正在進一步加速該產業的應用。包括二氧化碳運輸和封存網路在內的大型基礎設施計劃正在支持石油和天然氣領域碳捕集與封存(CCS)舉措的擴展。該行業對永續性的關注,加上政府的獎勵和碳市場的變化,使石油和天然氣成為碳捕集的高成長領域。
本報告研究了全球碳捕獲材料市場,按工藝、材料、技術、最終用戶和地區進行細分,並提供了參與市場的公司概況。
目錄
第1章 引言
第2章調查方法
第3章執行摘要
第4章重要考察
第5章 市場概況
- 介紹
- 市場動態
- 生成式人工智慧/人工智慧對碳捕獲材料市場的影響
第6章 產業趨勢
- 介紹
- 影響客戶業務的趨勢/中斷
- 供應鏈分析
- 2025年美國關稅對碳捕獲材料市場的影響
- 定價分析
- 投資金籌措場景
- 生態系分析
- 技術分析
- 專利分析
- 貿易分析
- 2025年至2027年的主要會議和活動
- 關稅和監管狀況
- 波特五力分析
- 主要相關人員和採購標準
- 宏觀經濟展望
- 案例研究分析
7. 碳捕獲材料市場(按工藝)
- 介紹
- 吸附
- 吸收
第8章 碳捕獲材料市場(按材料)
- 介紹
- 液體溶劑
- 強溶劑
- 電影
9. 碳捕獲材料市場(依技術)
- 介紹
- 燃燒前捕集
- 燃燒後回收
- 富氧燃料回收
- 直接空氣捕獲
第 10 章 碳捕獲材料市場(依最終使用者)
- 介紹
- 發電
- 石油和天然氣
- 化工/石化
- 金屬和採礦
- 工業的
- 其他
第11章碳捕獲材料市場(按地區)
- 介紹
- 亞太地區
- 中國
- 日本
- 印度
- 韓國
- 其他
- 北美洲
- 美國
- 加拿大
- 墨西哥
- 歐洲
- 德國
- 義大利
- 法國
- 英國
- 西班牙
- 俄羅斯
- 其他
- 中東和非洲
- 海灣合作理事會國家
- 南非
- 其他
- 南美洲
- 巴西
- 阿根廷
- 其他
第12章 競爭格局
- 介紹
- 主要參與企業的策略/優勢
- 市佔率分析
- 收益分析
- 品牌/產品比較
- 公司估值矩陣:2024 年關鍵參與企業
- 公司估值矩陣:Start-Ups/中小企業,2024 年
- 估值和財務指標
- 競爭場景
第13章:公司簡介
- 主要參與企業
- BASF
- DOW
- HONEYWELL INTERNATIONAL INC.
- MITSUBISHI HEAVY INDUSTRIES, LTD.
- TOSOH CORPORATION
- AIR PRODUCTS AND CHEMICALS, INC.
- ZEOCHEM AG
- ECOLAB
- SVANTE TECHNOLOGIES INC.
- CALGON CARBON CORPORATION
- 其他公司
- BOYCE CARBON
- JALON
- SPIRITUS
- CARBON ACTIVATED CORPORATION
- WARTSILA
- CLARIANT AG
第14章 附錄
The carbon capture materials market is projected to grow from USD 66,904.7 million in 2025 to USD 99,098.5 million by 2030, registering a CAGR of 8.2% during the forecast period.
| Scope of the Report | |
|---|---|
| Years Considered for the Study | 2021-2030 |
| Base Year | 2024 |
| Forecast Period | 2025-2030 |
| Units Considered | Value (USD Million/Billion), Volume (Kiloton) |
| Segments | Process, Material, End-Use Industries, and Region |
| Regions covered | North America, Europe, Asia Pacific, Middle East & Africa, South America |
key factors accelerating the carbon capture materials market include stringent climate policies, rising corporate sustainability commitments, and technological advancements. Stringent government regulations compel industries to reduce greenhouse gas emissions, driving demand for efficient carbon capture materials. Corporations aiming to meet net-zero targets increasingly prioritize sustainable materials and carbon reduction, boosting market adoption.
Additionally, ongoing innovation in bio-derived and circular carbon capture materials improves efficiency, reduces costs, and enhances environmental benefits, expanding use cases. These factors create favorable market conditions, attracting investments and supporting rapid growth across industries seeking to mitigate climate impact and comply with environmental mandates.
"Liquid solvents are the fastest-growing material segment of the carbon capture materials market in terms of value."
Liquid solvents, including amine-based and alkaline-based solutions, are the fastest-growing materials in the carbon capture market due to their proven efficiency and versatility in capturing CO2 from industrial emissions. Amine-based solvents have been widely used for decades because of their high affinity for CO2 molecules, enabling effective. Absorptions, even at low concentrations, are typically found in flue gases. This established track record makes them highly reliable for post-combustion carbon capture processes, particularly in power generation and industrial sectors where carbon emissions are a major concern.
Advancements in solvent formulations have significantly improved their regeneration energy requirements, reducing operational costs and making these solutions more economically viable. Innovations are addressing drawbacks such as solvent degradation and corrosion, enhancing the durability and lifecycle of these materials. Alkaline-based solvents, on the other hand, offer benefits including faster reaction rates with CO2 and suitability for use in different process conditions, which broadens their industrial applicability. The flexibility of liquid solvent systems to be integrated into existing industrial setups without extensive modifications is a major growth driver. These solvents can be tailored for specific process needs, adapting to varying flue gas compositions and temperatures. The strong regulatory push for carbon emission reductions globally also incentivizes industries to adopt these mature solvent technologies.
"Absorptions are the fastest-growing process segment of the carbon capture materials market in terms of value."
Adsorptions are the fastest-growing process segment in the carbon capture market due to their energy efficiency, versatility, and alignment with scalable decarbonization solutions. Utilizing solid materials like zeolites or metal-organic frameworks, adsorptions capture CO2 from gas streams with capture efficiencies up to 90%, requiring significantly less energy, often 30% lower than absorption processes. Its rapid growth is driven by its applicability in both post-combustion and direct air capture, addressing diverse emission sources from power plants to ambient air. Adsorptions' modular and compact systems enable easy integration into existing industrial setups, such as cement or steel facilities, reducing retrofitting costs. Innovations in high-capacity, selective sorbents enhance performance, making the process cost-effective for small- and large-scale applications. The growing demand for negative emissions technologies, coupled with supportive policies like carbon pricing, accelerates adoption, particularly in regions with stringent net-zero goals. Adsorptions' environmental benefits, including reduced chemical waste compared to liquid solvents, further boost their appeal. Its ability to handle low CO2 concentrations and continuous improvements in material durability make Adsorptions the fastest-growing process, addressing the urgent need for efficient, scalable carbon capture solutions.
"Pre-combustion is the fastest-growing technique segment of the carbon capture materials market in terms of value."
Pre-combustion carbon capture is the fastest-growing technique in the carbon capture market due to several key advantages that make it highly efficient and promising for large-scale decarbonization. Unlike post-combustion capture, pre-combustion technology removes CO2 before combustion by converting fossil fuels into a mixture of hydrogen and carbon dioxide (known as syngas) through a gasification or reforming process. This results in a gas stream with a higher concentration and pressure of CO2, which significantly enhances the ease and efficiency of capture using physical or chemical absorption methods. This higher concentration of CO2 means pre-combustion capture requires smaller equipment and less energy for separation, reducing both the capital and operational costs compared to other techniques. The process produces hydrogen, a clean-burning fuel, as a valuable byproduct, supporting the broader energy transition toward low-carbon hydrogen economies. Furthermore, pre-combustion capture can be integrated into new plants and industrial facilities designed for clean energy production, making it a forward-looking approach aligned with global decarbonization trends. Though the initial investment for the gasification process is higher than that of conventional systems, the long-term benefits of greater capture efficiency, lower energy penalties, and enhanced fuel quality are driving its growth. Additionally, as industries seek to reduce emissions from hard-to-abate sectors like power generation and heavy industry, pre-combustion technology offers an effective solution capable of capturing large volumes of CO2 at relatively lower cost.
"Oil & gas is the fastest-growing end-use industry segment of the carbon capture materials market in terms of value."
The oil & gas industry is the fastest-growing end-use sector in the carbon capture market because of its significant contribution to global CO2 emissions and the increasing pressure to lower its carbon footprint. This industry operates many carbon-intensive processes across upstream, midstream, and downstream segments, making carbon capture and storage (CCS) an essential technology for effectively reducing emissions. One of the main drivers of growth is CCS's ability to allow continued fossil fuel use while addressing environmental concerns, supporting the industry's transition to lower-carbon operations without stopping production. A major factor boosting the market is the integration of CCS with enhanced oil recovery (EOR) techniques. Captured CO2 is injected into mature oil fields to boost oil extraction, providing the dual benefit of reducing emissions and increasing resource recovery. This synergy creates economic incentives for adopting CCS, making it more financially practical than in other sectors. Additionally, regulatory requirements and global net-zero commitments compel oil and gas companies to heavily invest in carbon capture technologies to meet climate goals and stakeholder sustainability expectations. Technological advances that improve capture efficiency, cut costs, and ensure safe CO2 storage are further speeding up adoption in this sector. Large-scale infrastructure projects, including CO2 transportation and storage networks, support the expansion of CCS initiatives in oil and gas. The industry's focus on sustainability, along with government incentives and changing carbon markets, places oil and gas as a high-growth area within the carbon capture landscape.
In-depth interviews were conducted with Chief Executive Officers (CEOs), marketing directors, other innovation and technology directors, and executives from various key organizations operating in the carbon capture materials market, and information was gathered from secondary research to determine and verify the market size of several segments.
- By Company Type: Tier 1 - 50%, Tier 2 - 30%, and Tier 3 - 20%
- By Designation: Managers- 15%, Directors - 20%, and Others - 65%
- By Region: North America - 15%, Europe - 10%, Asia Pacific - 65%, Middle East & Africa - 7%, South America - 3%.
The key players in the carbon capture materials market include Ecolab (US), BASF (Germany), DOW (US), MITSUBISHI HEAVY INDUSTRIES, LTD (Japan), Solvay (Belgium), Air Products and Chemicals, Inc. (US), Tosoh Corporation (Japan), Honeywell International Inc. (US), and Zeochem (Switzerland). The study includes an in-depth competitive analysis of these key players in the carbon capture materials market, with their company profiles, recent developments, and key market strategies.
Research Coverage
This report segments the market for carbon capture materials by process, technique, material, end-use industry, and region, and estimates the overall market value across various regions. It also provides a detailed analysis of key industry players to provide insights into their business overviews, products and services, key strategies, and expansions associated with the carbon capture materials market.
Key Benefits of Buying This Report
This research report is focused on various levels of analysis - industry analysis (industry trends), market ranking analysis of top players, and company profiles, which together provide an overall view of the competitive landscape; emerging and high-growth segments of the carbon capture materials market; high-growth regions; and market drivers, restraints, opportunities, and challenges.
The report provides insights into the following pointers:
- Analysis of drivers (Stringent Climate Policies, Carbon Pricing Mechanisms, and Net-Zero Targets Driving Adoption), restraints (High Energy Penalty and Cost Burden in Large-Scale Material Regeneration), opportunities (Innovation of Bio-Derived and Circular Carbon Capture Materials), and challenges (Supply-Chain Reliability & Plant-Retrofit Compatibility Constraints).
- Market Penetration: Comprehensive information on the carbon capture materials market offered by top players in the carbon capture materials market.
- Product Development/Innovation: Detailed insights on upcoming technologies, research & development activities, partnerships, agreements, and collaborations in the market.
- Market Development: Comprehensive information about lucrative emerging markets. The report analyzes the carbon capture materials market across regions.
- Market Capacity: Production capacities of companies producing carbon capture materials market are provided wherever available, with upcoming capacities for the carbon capture materials market.
- Competitive Assessment: In-depth assessment of market shares, strategies, products, and manufacturing capabilities of leading players in the carbon capture materials market.
TABLE OF CONTENTS
1 INTRODUCTION
- 1.1 STUDY OBJECTIVES
- 1.2 MARKET DEFINITION
- 1.3 STUDY SCOPE
- 1.3.1 MARKETS COVERED AND REGIONAL SCOPE
- 1.3.2 INCLUSIONS AND EXCLUSIONS
- 1.3.3 YEARS CONSIDERED
- 1.3.4 CURRENCY CONSIDERED
- 1.3.5 UNIT CONSIDERED
- 1.4 RESEARCH LIMITATIONS
- 1.5 STAKEHOLDERS
2 RESEARCH METHODOLOGY
- 2.1 RESEARCH DATA
- 2.1.1 SECONDARY DATA
- 2.1.1.1 Key data from secondary sources
- 2.1.2 PRIMARY DATA
- 2.1.2.1 Key data from primary sources
- 2.1.2.2 Key primary sources
- 2.1.2.3 Key participants for primary interviews
- 2.1.2.4 Breakdown of primary interviews
- 2.1.2.5 Key industry insights
- 2.1.1 SECONDARY DATA
- 2.2 BASE NUMBER CALCULATION
- 2.2.1 SUPPLY-SIDE ANALYSIS
- 2.2.2 DEMAND-SIDE ANALYSIS
- 2.3 MARKET FORECAST
- 2.3.1 SUPPLY SIDE
- 2.3.2 DEMAND SIDE
- 2.4 MARKET SIZE ESTIMATION
- 2.4.1 BOTTOM-UP APPROACH
- 2.4.2 TOP-DOWN APPROACH
- 2.5 DATA TRIANGULATION
- 2.6 RESEARCH ASSUMPTIONS
- 2.7 GROWTH FORECAST
- 2.8 RISK ASSESSMENT
- 2.9 FACTOR ANALYSIS
3 EXECUTIVE SUMMARY
4 PREMIUM INSIGHTS
- 4.1 ATTRACTIVE OPPORTUNITIES FOR PLAYERS IN CARBON CAPTURE MATERIALS MARKET
- 4.2 CARBON CAPTURE MATERIALS MARKET, BY MATERIAL
- 4.3 CARBON CAPTURE MATERIALS MARKET, BY PROCESS
- 4.4 CARBON CAPTURE MATERIALS MARKET, BY TECHNIQUE
- 4.5 CARBON CAPTURE MATERIALS MARKET, BY END USER
- 4.6 CARBON CAPTURE MATERIALS MARKET, BY COUNTRY
5 MARKET OVERVIEW
- 5.1 INTRODUCTION
- 5.2 MARKET DYNAMICS
- 5.2.1 DRIVERS
- 5.2.1.1 Rising decarbonization pressure in energy-intensive industries
- 5.2.1.2 Stringent climate policies, carbon pricing mechanisms, and net-zero targets
- 5.2.2 RESTRAINTS
- 5.2.2.1 High energy requirement and cost burden in large-scale material regeneration
- 5.2.3 OPPORTUNITIES
- 5.2.3.1 Development of bio-derived and circular carbon capture materials
- 5.2.3.2 Integration of capture systems with utilization and mineralization technologies
- 5.2.4 CHALLENGES
- 5.2.4.1 Supply chain reliability and plant-retrofit compatibility constraints
- 5.2.1 DRIVERS
- 5.3 IMPACT OF GENERATIVE AI/AI ON CARBON CAPTURE MATERIALS MARKET
6 INDUSTRY TRENDS
- 6.1 INTRODUCTION
- 6.2 TRENDS/DISRUPTIONS IMPACTING CUSTOMER BUSINESS
- 6.3 SUPPLY CHAIN ANALYSIS
- 6.4 IMPACT OF 2025 US TARIFFS ON CARBON CAPTURE MATERIALS MARKET
- 6.4.1 INTRODUCTION
- 6.4.2 KEY TARIFF RATES
- 6.4.3 PRICE IMPACT ANALYSIS
- 6.4.4 IMPACT ON COUNTRY/REGION
- 6.4.4.1 US
- 6.4.4.2 Europe
- 6.4.4.3 Asia Pacific
- 6.4.5 IMPACT ON END-USE INDUSTRIES
- 6.5 PRICING ANALYSIS
- 6.5.1 AVERAGE SELLING PRICE TREND, BY REGION, 2021-2024
- 6.5.2 AVERAGE SELLING PRICE TREND, BY MATERIAL, 2021-2024
- 6.5.3 AVERAGE SELLING PRICE TREND OF KEY PLAYER, BY MATERIAL, 2024
- 6.6 INVESTMENT AND FUNDING SCENARIO
- 6.7 ECOSYSTEM ANALYSIS
- 6.8 TECHNOLOGY ANALYSIS
- 6.8.1 KEY TECHNOLOGIES
- 6.8.2 COMPLEMENTARY TECHNOLOGIES
- 6.9 PATENT ANALYSIS
- 6.9.1 METHODOLOGY
- 6.9.2 PATENTS GRANTED
- 6.9.3 PATENT PUBLICATION TRENDS
- 6.9.4 INSIGHTS
- 6.9.5 LEGAL STATUS OF PATENTS
- 6.9.6 JURISDICTION ANALYSIS
- 6.9.7 TOP APPLICANTS
- 6.9.8 LIST OF MAJOR PATENTS
- 6.10 TRADE ANALYSIS
- 6.10.1 EXPORT SCENARIO (HS CODE 380210)
- 6.10.2 IMPORT SCENARIO (HS CODE 380210)
- 6.11 KEY CONFERENCES AND EVENTS, 2025-2027
- 6.12 TARIFF AND REGULATORY LANDSCAPE
- 6.12.1 TARIFF ANALYSIS
- 6.12.2 REGULATORY BODIES, GOVERNMENT AGENCIES, AND OTHER ORGANIZATIONS
- 6.12.3 REGULATIONS AND STANDARDS RELATED TO CARBON CAPTURE MATERIALS
- 6.13 PORTER'S FIVE FORCES ANALYSIS
- 6.13.1 THREAT OF NEW ENTRANTS
- 6.13.2 THREAT OF SUBSTITUTES
- 6.13.3 BARGAINING POWER OF SUPPLIERS
- 6.13.4 BARGAINING POWER OF BUYERS
- 6.13.5 INTENSITY OF COMPETITIVE RIVALRY
- 6.14 KEY STAKEHOLDERS AND BUYING CRITERIA
- 6.14.1 KEY STAKEHOLDERS IN BUYING PROCESS
- 6.14.2 BUYING CRITERIA
- 6.15 MACROECONOMIC OUTLOOK
- 6.15.1 GDP TRENDS AND FORECASTS, BY COUNTRY
- 6.16 CASE STUDY ANALYSIS
- 6.16.1 TECHNOLOGY ANALYSIS OF CARBON CAPTURE MATERIALS: KEY AND COMPLEMENTARY TECHNOLOGIES SHAPING MARKET EVOLUTION
- 6.16.2 ADVANCED NANOSTRUCTURED MATERIALS FOR INDUSTRIAL CARBON CAPTURE
7 CARBON CAPTURE MATERIALS MARKET, BY PROCESS
- 7.1 INTRODUCTION
- 7.2 ADSORPTION
- 7.2.1 INCREASING DEMAND FOR ENERGY-EFFICIENT AND REGENERABLE MATERIALS IN INDUSTRIAL CARBON CAPTURE SYSTEMS TO DRIVE DEMAND
- 7.3 ABSORPTION
- 7.3.1 GROWING DEPLOYMENT OF SOLVENT-BASED CO2 CAPTURE SYSTEMS IN LARGE-SCALE POWER PLANTS AND INDUSTRIAL FACILITIES TO FUEL DEMAND
8 CARBON CAPTURE MATERIALS MARKET, BY MATERIAL
- 8.1 INTRODUCTION
- 8.2 LIQUID SOLVENTS
- 8.2.1 ADVANCEMENTS IN SOLVENT FORMULATIONS TO DRIVE DEMAND
- 8.2.2 AMINE-BASED SOLUTIONS
- 8.2.3 ALKALINE SOLUTIONS
- 8.3 STRONG SOLVENTS
- 8.3.1 GROWING EMPHASIS ON ENVIRONMENTALLY SUSTAINABLE AND REUSABLE MATERIALS TO FUEL DEMAND
- 8.3.2 ZEOLITES
- 8.3.3 ACTIVATED CARBON
- 8.3.4 CALCIUM-BASED SORBENTS
- 8.3.5 METAL-ORGANIC FRAMEWORKS
- 8.4 MEMBRANES
- 8.4.1 ABILITY TO SELECTIVELY SEPARATE CO2 FROM FLUE GASES OR INDUSTRIAL STREAMS TO PROPEL DEMAND
- 8.4.2 POLYMERIC MEMBRANES
9 CARBON CAPTURE MATERIALS MARKET, BY TECHNIQUE
- 9.1 INTRODUCTION
- 9.2 PRE-COMBUSTION CAPTURE
- 9.2.1 RISING DEMAND FOR HYDROGEN AS CLEAN FUEL TO DRIVE MARKET
- 9.3 POST-COMBUSTION CAPTURE
- 9.3.1 RETROFITTING POTENTIAL IN EXISTING POWER PLANTS AND INDUSTRIES TO DRIVE DEMAND
- 9.4 OXYFUEL COMBUSTION CAPTURE
- 9.4.1 HIGHER CO2 PURITY AND SIMPLIFIED CAPTURE PROCESSES TO PROPEL MARKET
- 9.5 DIRECT AIR CAPTURE
- 9.5.1 INCREASING GLOBAL EMPHASIS ON ACHIEVING NET-ZERO CARBON TARGETS TO DRIVE DEMAND
10 CARBON CAPTURE MATERIALS MARKET, BY END USER
- 10.1 INTRODUCTION
- 10.2 POWER
- 10.2.1 RISING EMISSION REDUCTION MANDATES AND CARBON-NEUTRALITY TARGETS TO ACCELERATE DEMAND
- 10.3 OIL & GAS
- 10.3.1 COMPLIANCE WITH EMISSION REDUCTION MANDATES TO DRIVE DEMAND
- 10.4 CHEMICAL & PETROCHEMICAL
- 10.4.1 RISING NEED TO DECARBONIZE ENERGY-INTENSIVE CHEMICAL PRODUCTION TO PROPEL DEMAND
- 10.5 METALS & MINING
- 10.5.1 INCREASING PRESSURE TO DECARBONIZE ENERGY-INTENSIVE SMELTING, REFINING, AND MINERAL PROCESSING OPERATIONS TO FUEL DEMAND
- 10.6 INDUSTRIAL
- 10.6.1 DECARBONIZATION REQUIREMENTS ACROSS DIVERSE INDUSTRIAL OPERATIONS TO BOOST DEMAND
- 10.7 OTHER END USERS
- 10.7.1 WASTE WATER TREATMENT
- 10.7.2 AGRICULTURE
11 CARBON CAPTURE MATERIALS MARKET, BY REGION
- 11.1 INTRODUCTION
- 11.2 ASIA PACIFIC
- 11.2.1 CHINA
- 11.2.1.1 Extensive industrial activity and government-backed decarbonization goals to drive market
- 11.2.2 JAPAN
- 11.2.2.1 Focus on development of hydrogen economy to drive market
- 11.2.3 INDIA
- 11.2.3.1 High coal dependency and industrial emissions to fuel demand
- 11.2.4 SOUTH KOREA
- 11.2.4.1 Government-backed CCUS pilot projects in heavy industries to propel demand
- 11.2.5 REST OF ASIA PACIFIC
- 11.2.1 CHINA
- 11.3 NORTH AMERICA
- 11.3.1 US
- 11.3.1.1 Federal incentives under Inflation Reduction Act (IRA) and 45Q tax credits to drive adoption
- 11.3.2 CANADA
- 11.3.2.1 Stringent carbon pricing policies and large-scale CCUS infrastructure to fuel demand
- 11.3.3 MEXICO
- 11.3.3.1 Alignment with North American CCUS strategies and potential for industrial decarbonization to accelerate demand
- 11.3.1 US
- 11.4 EUROPE
- 11.4.1 GERMANY
- 11.4.1.1 Ambitious climate neutrality targets and industrial decarbonization mandates to drive demand
- 11.4.2 ITALY
- 11.4.2.1 National decarbonization strategies and EU-funded CCS pilot projects to fuel demand
- 11.4.3 FRANCE
- 11.4.3.1 Expansion of industrial CCS initiatives and regulatory frameworks to drive demand
- 11.4.4 UK
- 11.4.4.1 High emphasis on negative emissions technologies and direct air capture pilot programs to fuel demand
- 11.4.5 SPAIN
- 11.4.5.1 High R&D support and innovation-driven policies to drive market
- 11.4.6 RUSSIA
- 11.4.6.1 Emerging CCU economic viability and CO2-EOR opportunities to drive demand
- 11.4.7 REST OF EUROPE
- 11.4.1 GERMANY
- 11.5 MIDDLE EAST & AFRICA
- 11.5.1 GCC COUNTRIES
- 11.5.1.1 Saudi Arabia
- 11.5.1.1.1 Strategic focus on large-scale CCUS infrastructure to drive demand
- 11.5.1.2 UAE
- 11.5.1.2.1 Strategic focus on blue hydrogen production and large-scale industrial CCUS projects to fuel demand
- 11.5.1.3 Rest of GCC Countries
- 11.5.1.1 Saudi Arabia
- 11.5.2 SOUTH AFRICA
- 11.5.2.1 Government incentives to reduce coal-related emissions to drive adoption
- 11.5.3 REST OF MIDDLE EAST & AFRICA
- 11.5.1 GCC COUNTRIES
- 11.6 SOUTH AMERICA
- 11.6.1 BRAZIL
- 11.6.1.1 Robust legislative framework and abundant geological storage resources to fuel market growth
- 11.6.2 ARGENTINA
- 11.6.2.1 Growing industrial initiatives and supportive regulatory measures to propel market
- 11.6.3 REST OF SOUTH AMERICA
- 11.6.1 BRAZIL
12 COMPETITIVE LANDSCAPE
- 12.1 INTRODUCTION
- 12.2 KEY PLAYER STRATEGIES/RIGHT TO WIN
- 12.3 MARKET SHARE ANALYSIS
- 12.4 REVENUE ANALYSIS
- 12.5 BRAND/PRODUCT COMPARISON
- 12.6 COMPANY EVALUATION MATRIX: KEY PLAYERS, 2024
- 12.6.1 STARS
- 12.6.2 EMERGING LEADERS
- 12.6.3 PERVASIVE PLAYERS
- 12.6.4 PARTICIPANTS
- 12.6.5 COMPANY FOOTPRINT: KEY PLAYERS, 2024
- 12.6.5.1 Company footprint
- 12.6.5.2 Material footprint
- 12.6.5.3 Process footprint
- 12.6.5.4 End-user footprint
- 12.6.5.5 Region footprint
- 12.7 COMPANY EVALUATION MATRIX: STARTUPS/SMES, 2024
- 12.7.1 PROGRESSIVE COMPANIES
- 12.7.2 RESPONSIVE COMPANIES
- 12.7.3 DYNAMIC COMPANIES
- 12.7.4 STARTING BLOCKS
- 12.7.5 COMPETITIVE BENCHMARKING: STARTUPS/SMES, 2024
- 12.7.5.1 Detailed list of key startups/SMEs
- 12.7.5.2 Competitive benchmarking of key startups/SMEs
- 12.8 COMPANY VALUATION AND FINANCIAL METRICS
- 12.9 COMPETITIVE SCENARIO
- 12.9.1 DEALS
- 12.9.2 EXPANSIONS
13 COMPANY PROFILES
- 13.1 KEY PLAYERS
- 13.1.1 BASF
- 13.1.1.1 Business overview
- 13.1.1.2 Products/Solutions/Services offered
- 13.1.1.3 Recent developments
- 13.1.1.3.1 Deals
- 13.1.1.4 MnM view
- 13.1.1.4.1 Key strengths/Right to win
- 13.1.1.4.2 Strategic choices
- 13.1.1.4.3 Weaknesses/Competitive threats
- 13.1.2 DOW
- 13.1.2.1 Business overview
- 13.1.2.2 Products/Solutions/Services offered
- 13.1.2.3 Recent developments
- 13.1.2.3.1 Expansions
- 13.1.2.4 MnM view
- 13.1.2.4.1 Key strengths/Right to win
- 13.1.2.4.2 Strategic choices
- 13.1.2.4.3 Weaknesses/Competitive threats
- 13.1.3 HONEYWELL INTERNATIONAL INC.
- 13.1.3.1 Business overview
- 13.1.3.2 Products/Solutions/Services offered
- 13.1.3.3 Recent developments
- 13.1.3.3.1 Deals
- 13.1.3.4 MnM view
- 13.1.3.4.1 Key strengths/Right to win
- 13.1.3.4.2 Strategic choices
- 13.1.3.4.3 Weaknesses/Competitive threats
- 13.1.4 MITSUBISHI HEAVY INDUSTRIES, LTD.
- 13.1.4.1 Business overview
- 13.1.4.2 Products/Solutions/Services offered
- 13.1.4.3 Recent developments
- 13.1.4.3.1 Deals
- 13.1.4.4 MnM view
- 13.1.4.4.1 Key strengths/Right to win
- 13.1.4.4.2 Strategic choices
- 13.1.4.4.3 Weaknesses/Competitive threats
- 13.1.5 TOSOH CORPORATION
- 13.1.5.1 Business overview
- 13.1.5.2 Products/Solutions/Services offered
- 13.1.5.3 MnM view
- 13.1.5.3.1 Key strengths/Right to win
- 13.1.5.3.2 Strategic choices
- 13.1.5.3.3 Weaknesses/Competitive threats
- 13.1.6 AIR PRODUCTS AND CHEMICALS, INC.
- 13.1.6.1 Business overview
- 13.1.6.2 Products/Solutions/Services offered
- 13.1.6.3 Recent developments
- 13.1.6.3.1 Expansions
- 13.1.7 ZEOCHEM AG
- 13.1.7.1 Business overview
- 13.1.7.2 Products/Solutions/Services offered
- 13.1.8 ECOLAB
- 13.1.8.1 Business overview
- 13.1.8.2 Products/Solutions/Services offered
- 13.1.8.3 Recent developments
- 13.1.8.3.1 Deals
- 13.1.9 SVANTE TECHNOLOGIES INC.
- 13.1.9.1 Business overview
- 13.1.9.2 Products/Solutions/Services offered
- 13.1.9.3 Recent developments
- 13.1.9.3.1 Deals
- 13.1.10 CALGON CARBON CORPORATION
- 13.1.10.1 Business overview
- 13.1.10.2 Products/Solutions/Services offered
- 13.1.1 BASF
- 13.2 OTHER PLAYERS
- 13.2.1 BOYCE CARBON
- 13.2.2 JALON
- 13.2.3 SPIRITUS
- 13.2.4 CARBON ACTIVATED CORPORATION
- 13.2.5 WARTSILA
- 13.2.6 CLARIANT AG
14 APPENDIX
- 14.1 DISCUSSION GUIDE
- 14.2 KNOWLEDGESTORE: MARKETSANDMARKETS' SUBSCRIPTION PORTAL
- 14.3 CUSTOMIZATION OPTIONS
- 14.4 RELATED REPORTS
- 14.5 AUTHOR DETAILS
List of Tables
- TABLE 1 AVERAGE SELLING PRICE TREND OF CARBON CAPTURE MATERIALS, BY REGION, 2021-2024 (USD/KILOTON)
- TABLE 2 AVERAGE SELLING PRICE TREND OF CARBON CAPTURE MATERIALS, BY MATERIAL, 2021-2024 (USD/KILOTON)
- TABLE 3 AVERAGE SELLING PRICE TREND OF CARBON CAPTURE MATERIALS OFFERED BY KEY PLAYERS, BY MATERIAL, 2024 (USD/KILOTON)
- TABLE 4 ROLES OF COMPANIES IN CARBON CAPTURE MATERIALS ECOSYSTEM
- TABLE 5 CARBON CAPTURE MATERIALS MARKET: KEY TECHNOLOGIES
- TABLE 6 CARBON CAPTURE MATERIALS MARKET: COMPLEMENTARY TECHNOLOGIES
- TABLE 7 CARBON CAPTURE MATERIALS MARKET: TOTAL NUMBER OF PATENTS, 2015-2024
- TABLE 8 CARBON CAPTURE MATERIALS: LIST OF MAJOR PATENT OWNERS, 2015-2024
- TABLE 9 CARBON CAPTURE MATERIALS: LIST OF MAJOR PATENTS, 2015-2024
- TABLE 10 EXPORT DATA RELATED TO HS CODE 380210-COMPLIANT PRODUCTS, BY KEY COUNTRY, 2021-2024 (USD THOUSAND)
- TABLE 11 IMPORT DATA RELATED TO HS CODE 380210-COMPLIANT PRODUCTS, BY KEY COUNTRY, 2021-2024 (USD THOUSAND)
- TABLE 12 CARBON CAPTURE MATERIALS MARKET: KEY CONFERENCES AND EVENTS, 2025-2027
- TABLE 13 TARIFFS RELATED TO CARBON CAPTURE MATERIALS, 2024
- TABLE 14 NORTH AMERICA: REGULATORY BODIES, GOVERNMENT AGENCIES, AND OTHER ORGANIZATIONS
- TABLE 15 EUROPE: REGULATORY BODIES, GOVERNMENT AGENCIES, AND OTHER ORGANIZATIONS
- TABLE 16 ASIA PACIFIC: REGULATORY BODIES, GOVERNMENT AGENCIES, AND OTHER ORGANIZATIONS
- TABLE 17 MIDDLE EAST & AFRICA: REGULATORY BODIES, GOVERNMENT AGENCIES, AND OTHER ORGANIZATIONS
- TABLE 18 SOUTH AMERICA: REGULATORY BODIES, GOVERNMENT AGENCIES, AND OTHER ORGANIZATIONS
- TABLE 19 CARBON CAPTURE MATERIALS MARKET: REGULATIONS AND STANDARDS
- TABLE 20 CARBON CAPTURE MATERIALS MARKET: PORTER'S FIVE FORCES ANALYSIS
- TABLE 21 INFLUENCE OF STAKEHOLDERS ON BUYING PROCESS FOR TOP THREE END USERS
- TABLE 22 KEY BUYING CRITERIA FOR TOP THREE END USERS
- TABLE 23 GDP TRENDS AND FORECASTS, BY COUNTRY, 2023-2025 (USD MILLION)
- TABLE 24 CARBON CAPTURE MATERIALS MARKET, BY PROCESS, 2021-2024 (USD MILLION)
- TABLE 25 CARBON CAPTURE MATERIALS MARKET, BY PROCESS, 2025-2030 (USD MILLION)
- TABLE 26 CARBON CAPTURE MATERIALS MARKET, BY PROCESS, 2021-2024 (KILOTON)
- TABLE 27 CARBON CAPTURE MATERIALS MARKET, BY PROCESS, 2025-2030 (KILOTON)
- TABLE 28 CARBON CAPTURE MATERIALS MARKET, BY MATERIAL, 2021-2024 (USD MILLION)
- TABLE 29 CARBON CAPTURE MATERIALS MARKET, BY MATERIAL, 2025-2030 (USD MILLION)
- TABLE 30 CARBON CAPTURE MATERIALS MARKET, BY MATERIAL, 2021-2024 (KILOTON)
- TABLE 31 CARBON CAPTURE MATERIALS MARKET, BY MATERIAL, 2025-2030 (KILOTON)
- TABLE 32 CARBON CAPTURE MATERIALS MARKET, BY TECHNIQUE, 2021-2024 (USD MILLION)
- TABLE 33 CARBON CAPTURE MATERIALS MARKET, BY TECHNIQUE, 2025-2030 (USD MILLION)
- TABLE 34 CARBON CAPTURE MATERIALS MARKET, BY TECHNIQUE, 2021-2024 (KILOTON)
- TABLE 35 CARBON CAPTURE MATERIALS MARKET, BY TECHNIQUE, 2025-2030 (KILOTON)
- TABLE 36 CARBON CAPTURE MATERIALS MARKET, BY END USER, 2021-2024 (USD MILLION)
- TABLE 37 CARBON CAPTURE MATERIALS MARKET, BY END USER, 2025-2030 (USD MILLION)
- TABLE 38 CARBON CAPTURE MATERIALS MARKET, BY END USER, 2021-2024 (KILOTON)
- TABLE 39 CARBON CAPTURE MATERIALS MARKET, BY END USER, 2025-2030 (KILOTON)
- TABLE 40 CARBON CAPTURE MATERIALS MARKET, BY REGION, 2021-2024 (USD MILLION)
- TABLE 41 CARBON CAPTURE MATERIALS MARKET, BY REGION, 2025-2030 (USD MILLION)
- TABLE 42 CARBON CAPTURE MATERIALS MARKET, BY REGION, 2021-2024 (KILOTON)
- TABLE 43 CARBON CAPTURE MATERIALS MARKET, BY REGION, 2025-2030 (KILOTON)
- TABLE 44 ASIA PACIFIC: CARBON CAPTURE MATERIALS MARKET, BY COUNTRY, 2021-2024 (USD MILLION)
- TABLE 45 ASIA PACIFIC: CARBON CAPTURE MATERIALS MARKET, BY COUNTRY, 2025-2030 (USD MILLION)
- TABLE 46 ASIA PACIFIC: CARBON CAPTURE MATERIALS MARKET, BY COUNTRY, 2021-2024 (KILOTON)
- TABLE 47 ASIA PACIFIC: CARBON CAPTURE MATERIALS MARKET, BY COUNTRY, 2025-2030 (KILOTON)
- TABLE 48 ASIA PACIFIC: CARBON CAPTURE MATERIALS MARKET, BY MATERIAL, 2021-2024 (USD MILLION)
- TABLE 49 ASIA PACIFIC: CARBON CAPTURE MATERIALS MARKET, BY MATERIAL, 2025-2030 (USD MILLION)
- TABLE 50 ASIA PACIFIC: CARBON CAPTURE MATERIALS MARKET, BY MATERIAL, 2021-2024 (KILOTON)
- TABLE 51 ASIA PACIFIC: CARBON CAPTURE MATERIALS MARKET, BY MATERIAL, 2025-2030 (KILOTON)
- TABLE 52 ASIA PACIFIC: CARBON CAPTURE MATERIALS MARKET, BY PROCESS, 2021-2024 (USD MILLION)
- TABLE 53 ASIA PACIFIC: CARBON CAPTURE MATERIALS MARKET, BY PROCESS, 2025-2030 (USD MILLION)
- TABLE 54 ASIA PACIFIC: CARBON CAPTURE MATERIALS MARKET, BY PROCESS, 2021-2024 (KILOTON)
- TABLE 55 ASIA PACIFIC: CARBON CAPTURE MATERIALS MARKET, BY PROCESS, 2025-2030 (KILOTON)
- TABLE 56 ASIA PACIFIC: CARBON CAPTURE MATERIALS MARKET, BY TECHNIQUE, 2021-2024 (USD MILLION)
- TABLE 57 ASIA PACIFIC: CARBON CAPTURE MATERIALS MARKET, BY TECHNIQUE, 2025-2030 (USD MILLION)
- TABLE 58 ASIA PACIFIC: CARBON CAPTURE MATERIALS MARKET, BY TECHNIQUE, 2021-2024 (KILOTON)
- TABLE 59 ASIA PACIFIC: CARBON CAPTURE MATERIALS MARKET, BY TECHNIQUE, 2025-2030 (KILOTON)
- TABLE 60 ASIA PACIFIC: CARBON CAPTURE MATERIALS MARKET, BY END USER, 2021-2024 (USD MILLION)
- TABLE 61 ASIA PACIFIC: CARBON CAPTURE MATERIALS MARKET, BY END USER, 2025-2030 (USD MILLION)
- TABLE 62 ASIA PACIFIC: CARBON CAPTURE MATERIALS MARKET, BY END USER, 2021-2024 (KILOTON)
- TABLE 63 ASIA PACIFIC: CARBON CAPTURE MATERIALS MARKET, BY END USER, 2025-2030 (KILOTON)
- TABLE 64 CHINA: CARBON CAPTURE MATERIALS MARKET, BY END USER, 2021-2024 (USD MILLION)
- TABLE 65 CHINA: CARBON CAPTURE MATERIALS MARKET, BY END USER, 2025-2030 (USD MILLION)
- TABLE 66 CHINA: CARBON CAPTURE MATERIALS MARKET, BY END USER, 2021-2024 (KILOTON)
- TABLE 67 CHINA: CARBON CAPTURE MATERIALS MARKET, BY END USER, 2025-2030 (KILOTON)
- TABLE 68 JAPAN: CARBON CAPTURE MATERIALS MARKET, BY END USER, 2021-2024 (USD MILLION)
- TABLE 69 JAPAN: CARBON CAPTURE MATERIALS MARKET, BY END USER, 2025-2030 (USD MILLION)
- TABLE 70 JAPAN: CARBON CAPTURE MATERIALS MARKET, BY END USER, 2021-2024 (KILOTON)
- TABLE 71 JAPAN: CARBON CAPTURE MATERIALS MARKET, BY END USER, 2025-2030 (KILOTON)
- TABLE 72 INDIA: CARBON CAPTURE MATERIALS MARKET, BY END USER, 2021-2024 (USD MILLION)
- TABLE 73 INDIA: CARBON CAPTURE MATERIALS MARKET, BY END USER, 2025-2030 (USD MILLION)
- TABLE 74 INDIA: CARBON CAPTURE MATERIALS MARKET, BY END USER, 2021-2024 (KILOTON)
- TABLE 75 INDIA: CARBON CAPTURE MATERIALS MARKET, BY END USER, 2025-2030 (KILOTON)
- TABLE 76 SOUTH KOREA: CARBON CAPTURE MATERIALS MARKET, BY END USER, 2021-2024 (USD MILLION)
- TABLE 77 SOUTH KOREA: CARBON CAPTURE MATERIALS MARKET, BY END USER, 2025-2030 (USD MILLION)
- TABLE 78 SOUTH KOREA: CARBON CAPTURE MATERIALS MARKET, BY END USER, 2021-2024 (KILOTON)
- TABLE 79 SOUTH KOREA: CARBON CAPTURE MATERIALS MARKET, BY END USER, 2025-2030 (KILOTON)
- TABLE 80 REST OF ASIA PACIFIC: CARBON CAPTURE MATERIALS MARKET, BY END USER, 2021-2024 (USD MILLION)
- TABLE 81 REST OF ASIA PACIFIC: CARBON CAPTURE MATERIALS MARKET, BY END USER, 2025-2030 (USD MILLION)
- TABLE 82 REST OF ASIA PACIFIC: CARBON CAPTURE MATERIALS MARKET, BY END USER, 2021-2024 (KILOTON)
- TABLE 83 REST OF ASIA PACIFIC: CARBON CAPTURE MATERIALS MARKET, BY END USER, 2025-2030 (KILOTON)
- TABLE 84 NORTH AMERICA: CARBON CAPTURE MATERIALS MARKET, BY COUNTRY, 2021-2024 (USD MILLION)
- TABLE 85 NORTH AMERICA: CARBON CAPTURE MATERIALS MARKET, BY COUNTRY, 2025-2030 (USD MILLION)
- TABLE 86 NORTH AMERICA: CARBON CAPTURE MATERIALS MARKET, BY COUNTRY, 2021-2024 (KILOTON)
- TABLE 87 NORTH AMERICA: CARBON CAPTURE MATERIALS MARKET, BY COUNTRY, 2025-2030 (KILOTON)
- TABLE 88 NORTH AMERICA: CARBON CAPTURE MATERIALS MARKET, BY MATERIAL, 2021-2024 (USD MILLION)
- TABLE 89 NORTH AMERICA: CARBON CAPTURE MATERIALS MARKET, BY MATERIAL, 2025-2030 (USD MILLION)
- TABLE 90 NORTH AMERICA: CARBON CAPTURE MATERIALS MARKET, BY MATERIAL, 2021-2024 (KILOTON)
- TABLE 91 NORTH AMERICA: CARBON CAPTURE MATERIALS MARKET, BY MATERIAL, 2025-2030 (KILOTON)
- TABLE 92 NORTH AMERICA: CARBON CAPTURE MATERIALS MARKET, BY PROCESS, 2021-2024 (USD MILLION)
- TABLE 93 NORTH AMERICA: CARBON CAPTURE MATERIALS MARKET, BY PROCESS, 2025-2030 (USD MILLION)
- TABLE 94 NORTH AMERICA: CARBON CAPTURE MATERIALS MARKET, BY PROCESS, 2021-2024 (KILOTON)
- TABLE 95 NORTH AMERICA: CARBON CAPTURE MATERIALS MARKET, BY PROCESS, 2025-2030 (KILOTON)
- TABLE 96 NORTH AMERICA: CARBON CAPTURE MATERIALS MARKET, BY TECHNIQUE, 2021-2024 (USD MILLION)
- TABLE 97 NORTH AMERICA: CARBON CAPTURE MATERIALS MARKET, BY TECHNIQUE, 2025-2030 (USD MILLION)
- TABLE 98 NORTH AMERICA: CARBON CAPTURE MATERIALS MARKET, BY TECHNIQUE, 2021-2024 (KILOTON)
- TABLE 99 NORTH AMERICA: CARBON CAPTURE MATERIALS MARKET, BY TECHNIQUE, 2025-2030 (KILOTON)
- TABLE 100 NORTH AMERICA: CARBON CAPTURE MATERIALS MARKET, BY END USER, 2021-2024 (USD MILLION)
- TABLE 101 NORTH AMERICA: CARBON CAPTURE MATERIALS MARKET, BY END USER, 2025-2030 (USD MILLION)
- TABLE 102 NORTH AMERICA: CARBON CAPTURE MATERIALS MARKET, BY END USER, 2021-2024 (KILOTON)
- TABLE 103 NORTH AMERICA: CARBON CAPTURE MATERIALS MARKET, BY END USER, 2025-2030 (KILOTON)
- TABLE 104 US: CARBON CAPTURE MATERIALS MARKET, BY END USER, 2021-2024 (USD MILLION)
- TABLE 105 US: CARBON CAPTURE MATERIALS MARKET, BY END USER, 2025-2030 (USD MILLION)
- TABLE 106 US: CARBON CAPTURE MATERIALS MARKET, BY END USER, 2021-2024 (KILOTON)
- TABLE 107 US: CARBON CAPTURE MATERIALS MARKET, BY END USER, 2025-2030 (KILOTON)
- TABLE 108 CANADA: CARBON CAPTURE MATERIALS MARKET, BY END USER, 2021-2024 (USD MILLION)
- TABLE 109 CANADA: CARBON CAPTURE MATERIALS MARKET, BY END USER, 2025-2030 (USD MILLION)
- TABLE 110 CANADA: CARBON CAPTURE MATERIALS MARKET, BY END USER, 2021-2024 (KILOTON)
- TABLE 111 CANADA: CARBON CAPTURE MATERIALS MARKET, BY END USER, 2025-2030 (KILOTON)
- TABLE 112 MEXICO: CARBON CAPTURE MATERIALS MARKET, BY END USER, 2021-2024 (USD MILLION)
- TABLE 113 MEXICO: CARBON CAPTURE MATERIALS MARKET, BY END USER, 2025-2030 (USD MILLION)
- TABLE 114 MEXICO: CARBON CAPTURE MATERIALS MARKET, BY END USER, 2021-2024 (KILOTON)
- TABLE 115 MEXICO: CARBON CAPTURE MATERIALS MARKET, BY END USER, 2025-2030 (KILOTON)
- TABLE 116 EUROPE: CARBON CAPTURE MATERIALS MARKET, BY COUNTRY, 2021-2024 (USD MILLION)
- TABLE 117 EUROPE: CARBON CAPTURE MATERIALS MARKET, BY COUNTRY, 2025-2030 (USD MILLION)
- TABLE 118 EUROPE: CARBON CAPTURE MATERIALS MARKET, BY COUNTRY, 2021-2024 (KILOTON)
- TABLE 119 EUROPE: CARBON CAPTURE MATERIALS MARKET, BY COUNTRY, 2025-2030 (KILOTON)
- TABLE 120 EUROPE: CARBON CAPTURE MATERIALS MARKET, BY MATERIAL, 2021-2024 (USD MILLION)
- TABLE 121 EUROPE: CARBON CAPTURE MATERIALS MARKET, BY MATERIAL, 2025-2030 (USD MILLION)
- TABLE 122 EUROPE: CARBON CAPTURE MATERIALS MARKET, BY MATERIAL, 2021-2024 (KILOTON)
- TABLE 123 EUROPE: CARBON CAPTURE MATERIALS MARKET, BY MATERIAL, 2025-2030 (KILOTON)
- TABLE 124 EUROPE: CARBON CAPTURE MATERIALS MARKET, BY PROCESS, 2021-2024 (USD MILLION)
- TABLE 125 EUROPE: CARBON CAPTURE MATERIALS MARKET, BY PROCESS, 2025-2030 (USD MILLION)
- TABLE 126 EUROPE: CARBON CAPTURE MATERIALS MARKET, BY PROCESS, 2021-2024 (KILOTON)
- TABLE 127 EUROPE: CARBON CAPTURE MATERIALS MARKET, BY PROCESS, 2025-2030 (KILOTON)
- TABLE 128 EUROPE: CARBON CAPTURE MATERIALS MARKET, BY TECHNIQUE, 2021-2024 (USD MILLION)
- TABLE 129 EUROPE: CARBON CAPTURE MATERIALS MARKET, BY TECHNIQUE, 2025-2030 (USD MILLION)
- TABLE 130 EUROPE CARBON CAPTURE MATERIALS MARKET, BY TECHNIQUE, 2021-2024 (KILOTON)
- TABLE 131 EUROPE CARBON CAPTURE MATERIALS MARKET, BY TECHNIQUE, 2025-2030 (KILOTON)
- TABLE 132 EUROPE CARBON CAPTURE MATERIALS MARKET, BY END USER, 2021-2024 (USD MILLION)
- TABLE 133 EUROPE CARBON CAPTURE MATERIALS MARKET, BY END USER, 2025-2030 (USD MILLION)
- TABLE 134 EUROPE CARBON CAPTURE MATERIALS MARKET, BY END USER, 2021-2024 (KILOTON)
- TABLE 135 EUROPE CARBON CAPTURE MATERIALS MARKET, BY END USER, 2025-2030 (KILOTON)
- TABLE 136 GERMANY: CARBON CAPTURE MATERIALS MARKET, BY END USER, 2021-2024 (USD MILLION)
- TABLE 137 GERMANY: CARBON CAPTURE MATERIALS MARKET, BY END USER, 2025-2030 (USD MILLION)
- TABLE 138 GERMANY: CARBON CAPTURE MATERIALS MARKET, BY END USER, 2021-2024 (KILOTON)
- TABLE 139 GERMANY: CARBON CAPTURE MATERIALS MARKET, BY END USER, 2025-2030 (KILOTON)
- TABLE 140 ITALY: CARBON CAPTURE MATERIALS MARKET, BY END USER, 2021-2024 (USD MILLION)
- TABLE 141 ITALY: CARBON CAPTURE MATERIALS MARKET, BY END USER, 2025-2030 (USD MILLION)
- TABLE 142 ITALY: CARBON CAPTURE MATERIALS MARKET, BY END USER, 2021-2024 (KILOTON)
- TABLE 143 ITALY: CARBON CAPTURE MATERIALS MARKET, BY END USER, 2025-2030 (KILOTON)
- TABLE 144 FRANCE: CARBON CAPTURE MATERIALS MARKET, BY END USER, 2021-2024 (USD MILLION)
- TABLE 145 FRANCE: CARBON CAPTURE MATERIALS MARKET, BY END USER, 2025-2030 (USD MILLION)
- TABLE 146 FRANCE: CARBON CAPTURE MATERIALS MARKET, BY END USER, 2021-2024 (KILOTON)
- TABLE 147 FRANCE: CARBON CAPTURE MATERIALS MARKET, BY END USER, 2025-2030 (KILOTON)
- TABLE 148 UK: CARBON CAPTURE MATERIALS MARKET, BY END USER, 2021-2024 (USD MILLION)
- TABLE 149 UK: CARBON CAPTURE MATERIALS MARKET, BY END USER, 2025-2030 (USD MILLION)
- TABLE 150 UK: CARBON CAPTURE MATERIALS MARKET, BY END USER, 2021-2024 (KILOTON)
- TABLE 151 UK: CARBON CAPTURE MATERIALS MARKET, BY END USER, 2025-2030 (KILOTON)
- TABLE 152 SPAIN: CARBON CAPTURE MATERIALS MARKET, BY END USER, 2021-2024 (USD MILLION)
- TABLE 153 SPAIN: CARBON CAPTURE MATERIALS MARKET, BY END USER, 2025-2030 (USD MILLION)
- TABLE 154 SPAIN: CARBON CAPTURE MATERIALS MARKET, BY END USER, 2021-2024 (KILOTON)
- TABLE 155 SPAIN: CARBON CAPTURE MATERIALS MARKET, BY END USER, 2025-2030 (KILOTON)
- TABLE 156 RUSSIA: CARBON CAPTURE MATERIALS MARKET, BY END USER, 2021-2024 (USD MILLION)
- TABLE 157 RUSSIA: CARBON CAPTURE MATERIALS MARKET, BY END USER, 2025-2030 (USD MILLION)
- TABLE 158 RUSSIA: CARBON CAPTURE MATERIALS MARKET, BY END USER, 2021-2024 (KILOTON)
- TABLE 159 RUSSIA: CARBON CAPTURE MATERIALS MARKET, BY END USER, 2025-2030 (KILOTON)
- TABLE 160 REST OF EUROPE: CARBON CAPTURE MATERIALS MARKET, BY END USER, 2021-2024 (USD MILLION)
- TABLE 161 REST OF EUROPE: CARBON CAPTURE MATERIALS MARKET, BY END USER, 2025-2030 (USD MILLION)
- TABLE 162 REST OF EUROPE: CARBON CAPTURE MATERIALS MARKET, BY END USER, 2021-2024 (KILOTON)
- TABLE 163 REST OF EUROPE: CARBON CAPTURE MATERIALS MARKET, BY END USER, 2025-2030 (KILOTON)
- TABLE 164 MIDDLE EAST & AFRICA: CARBON CAPTURE MATERIALS MARKET, BY COUNTRY, 2021-2024 (USD MILLION)
- TABLE 165 MIDDLE EAST & AFRICA: CARBON CAPTURE MATERIALS MARKET, BY COUNTRY, 2025-2030 (USD MILLION)
- TABLE 166 MIDDLE EAST & AFRICA: CARBON CAPTURE MATERIALS MARKET, BY COUNTRY, 2021-2024 (KILOTON)
- TABLE 167 MIDDLE EAST & AFRICA: CARBON CAPTURE MATERIALS MARKET, BY COUNTRY, 2025-2030 (KILOTON)
- TABLE 168 MIDDLE EAST & AFRICA: CARBON CAPTURE MATERIALS MARKET, BY MATERIAL, 2021-2024 (USD MILLION)
- TABLE 169 MIDDLE EAST & AFRICA: CARBON CAPTURE MATERIALS MARKET, BY MATERIAL, 2025-2030 (USD MILLION)
- TABLE 170 MIDDLE EAST & AFRICA: CARBON CAPTURE MATERIALS MARKET, BY MATERIAL, 2021-2024 (KILOTON)
- TABLE 171 MIDDLE EAST & AFRICA: CARBON CAPTURE MATERIALS MARKET, BY MATERIAL, 2025-2030 (KILOTON)
- TABLE 172 MIDDLE EAST & AFRICA: CARBON CAPTURE MATERIALS MARKET, BY PROCESS, 2021-2024 (USD MILLION)
- TABLE 173 MIDDLE EAST & AFRICA: CARBON CAPTURE MATERIALS MARKET, BY PROCESS, 2025-2030 (USD MILLION)
- TABLE 174 MIDDLE EAST & AFRICA: CARBON CAPTURE MATERIALS MARKET, BY PROCESS, 2021-2024 (KILOTON)
- TABLE 175 MIDDLE EAST & AFRICA: CARBON CAPTURE MATERIALS MARKET, BY PROCESS, 2025-2030 (KILOTON)
- TABLE 176 MIDDLE EAST & AFRICA: CARBON CAPTURE MATERIALS MARKET, BY TECHNIQUE, 2021-2024 (USD MILLION)
- TABLE 177 MIDDLE EAST & AFRICA: CARBON CAPTURE MATERIALS MARKET, BY TECHNIQUE, 2025-2030 (USD MILLION)
- TABLE 178 MIDDLE EAST & AFRICA CARBON CAPTURE MATERIALS MARKET, BY TECHNIQUE, 2021-2024 (KILOTON)
- TABLE 179 MIDDLE EAST & AFRICA: CARBON CAPTURE MATERIALS MARKET, BY TECHNIQUE, 2025-2030 (KILOTON)
- TABLE 180 MIDDLE EAST & AFRICA: CARBON CAPTURE MATERIALS MARKET, BY END USER, 2021-2024 (USD MILLION)
- TABLE 181 MIDDLE EAST & AFRICA: CARBON CAPTURE MATERIALS MARKET, BY END USER, 2025-2030 (USD MILLION)
- TABLE 182 MIDDLE EAST & AFRICA: CARBON CAPTURE MATERIALS MARKET, BY END USER, 2021-2024 (KILOTON)
- TABLE 183 MIDDLE EAST & AFRICA: CARBON CAPTURE MATERIALS MARKET, BY END USER, 2025-2030 (KILOTON)
- TABLE 184 SAUDI ARABIA: CARBON CAPTURE MATERIALS MARKET, BY END USER, 2021-2024 (USD MILLION)
- TABLE 185 SAUDI ARABIA: CARBON CAPTURE MATERIALS MARKET, BY END USER, 2025-2030 (USD MILLION)
- TABLE 186 SAUDI ARABIA: CARBON CAPTURE MATERIALS MARKET, BY END USER, 2021-2024 (KILOTON)
- TABLE 187 SAUDI ARABIA: CARBON CAPTURE MATERIALS MARKET, BY END USER, 2025-2030 (KILOTON)
- TABLE 188 UAE: CARBON CAPTURE MATERIALS MARKET, BY END USER, 2021-2024 (USD MILLION)
- TABLE 189 UAE: CARBON CAPTURE MATERIALS MARKET, BY END USER, 2025-2030 (USD MILLION)
- TABLE 190 UAE: CARBON CAPTURE MATERIALS MARKET, BY END USER, 2021-2024 (KILOTON)
- TABLE 191 UAE: CARBON CAPTURE MATERIALS MARKET, BY END USER, 2025-2030 (KILOTON)
- TABLE 192 REST OF GCC COUNTRIES: CARBON CAPTURE MATERIALS MARKET, BY END USER, 2021-2024 (USD MILLION)
- TABLE 193 REST OF GCC COUNTRIES: CARBON CAPTURE MATERIALS MARKET, BY END USER, 2025-2030 (USD MILLION)
- TABLE 194 REST OF GCC COUNTRIES: CARBON CAPTURE MATERIALS MARKET, BY END USER, 2021-2024 (KILOTON)
- TABLE 195 REST OF GCC COUNTRIES: CARBON CAPTURE MATERIALS MARKET, BY END USER, 2025-2030 (KILOTON)
- TABLE 196 SOUTH AFRICA: CARBON CAPTURE MATERIALS MARKET, BY END USER, 2021-2024 (USD MILLION)
- TABLE 197 SOUTH AFRICA: CARBON CAPTURE MATERIALS MARKET, BY END USER, 2025-2030 (USD MILLION)
- TABLE 198 SOUTH AFRICA: CARBON CAPTURE MATERIALS MARKET, BY END USER, 2021-2024 (KILOTON)
- TABLE 199 SOUTH AFRICA: CARBON CAPTURE MATERIALS MARKET, BY END USER, 2025-2030 (KILOTON)
- TABLE 200 REST OF MIDDLE EAST & AFRICA: CARBON CAPTURE MATERIALS MARKET, BY END USER, 2021-2024 (USD MILLION)
- TABLE 201 REST OF MIDDLE EAST & AFRICA: CARBON CAPTURE MATERIALS MARKET, BY END USER, 2025-2030 (USD MILLION)
- TABLE 202 REST OF MIDDLE EAST & AFRICA: CARBON CAPTURE MATERIALS MARKET, BY END USER, 2021-2024 (KILOTON)
- TABLE 203 REST OF MIDDLE EAST & AFRICA: CARBON CAPTURE MATERIALS MARKET, BY END USER, 2025-2030 (KILOTON)
- TABLE 204 SOUTH AMERICA: CARBON CAPTURE MATERIALS MARKET, BY COUNTRY, 2021-2024 (USD MILLION)
- TABLE 205 SOUTH AMERICA: CARBON CAPTURE MATERIALS MARKET, BY COUNTRY, 2025-2030 (USD MILLION)
- TABLE 206 SOUTH AMERICA: CARBON CAPTURE MATERIALS MARKET, BY COUNTRY, 2021-2024 (KILOTON)
- TABLE 207 SOUTH AMERICA: CARBON CAPTURE MATERIALS MARKET, BY COUNTRY, 2025-2030 (KILOTON)
- TABLE 208 SOUTH AMERICA: CARBON CAPTURE MATERIALS MARKET, BY MATERIAL, 2021-2024 (USD MILLION)
- TABLE 209 SOUTH AMERICA: CARBON CAPTURE MATERIALS MARKET, BY MATERIAL, 2025-2030 (USD MILLION)
- TABLE 210 SOUTH AMERICA: CARBON CAPTURE MATERIALS MARKET, BY MATERIAL, 2021-2024 (KILOTON)
- TABLE 211 SOUTH AMERICA: CARBON CAPTURE MATERIALS MARKET, BY MATERIAL, 2025-2030 (KILOTON)
- TABLE 212 SOUTH AMERICA: CARBON CAPTURE MATERIALS MARKET, BY PROCESS, 2021-2024 (USD MILLION)
- TABLE 213 SOUTH AMERICA: CARBON CAPTURE MATERIALS MARKET, BY PROCESS, 2025-2030 (USD MILLION)
- TABLE 214 SOUTH AMERICA: CARBON CAPTURE MATERIALS MARKET, BY PROCESS, 2021-2024 (KILOTON)
- TABLE 215 SOUTH AMERICA: CARBON CAPTURE MATERIALS MARKET, BY PROCESS, 2025-2030 (KILOTON)
- TABLE 216 SOUTH AMERICA: CARBON CAPTURE MATERIALS MARKET, BY TECHNIQUE, 2021-2024 (USD MILLION)
- TABLE 217 SOUTH AMERICA: CARBON CAPTURE MATERIALS MARKET, BY TECHNIQUE, 2025-2030 (USD MILLION)
- TABLE 218 SOUTH AMERICA: CARBON CAPTURE MATERIALS MARKET, BY TECHNIQUE, 2021-2024 (KILOTON)
- TABLE 219 SOUTH AMERICA: CARBON CAPTURE MATERIALS MARKET, BY TECHNIQUE, 2025-2030 (KILOTON)
- TABLE 220 SOUTH AMERICA: CARBON CAPTURE MATERIALS MARKET, BY END USER, 2021-2024 (USD MILLION)
- TABLE 221 SOUTH AMERICA: CARBON CAPTURE MATERIALS MARKET, BY END USER, 2025-2030 (USD MILLION)
- TABLE 222 SOUTH AMERICA: CARBON CAPTURE MATERIALS MARKET, BY END USER, 2021-2024 (KILOTON)
- TABLE 223 SOUTH AMERICA: CARBON CAPTURE MATERIALS MARKET, BY END USER, 2025-2030 (KILOTON)
- TABLE 224 BRAZIL: CARBON CAPTURE MATERIALS MARKET, BY END USER, 2021-2024 (USD MILLION)
- TABLE 225 BRAZIL: CARBON CAPTURE MATERIALS MARKET, BY END USER, 2025-2030 (USD MILLION)
- TABLE 226 BRAZIL: CARBON CAPTURE MATERIALS MARKET, BY END USER, 2021-2024 (KILOTON)
- TABLE 227 BRAZIL: CARBON CAPTURE MATERIALS MARKET, BY END USER, 2025-2030 (KILOTON)
- TABLE 228 ARGENTINA: CARBON CAPTURE MATERIALS MARKET, BY END USER, 2021-2024 (USD MILLION)
- TABLE 229 ARGENTINA: CARBON CAPTURE MATERIALS MARKET, BY END USER, 2025-2030 (USD MILLION)
- TABLE 230 ARGENTINA: CARBON CAPTURE MATERIALS MARKET, BY END USER, 2021-2024 (KILOTON)
- TABLE 231 ARGENTINA: CARBON CAPTURE MATERIALS MARKET, BY END USER, 2025-2030 (KILOTON)
- TABLE 232 REST OF SOUTH AMERICA: CARBON CAPTURE MATERIALS MARKET, BY END USER, 2021-2024 (USD MILLION)
- TABLE 233 REST OF SOUTH AMERICA: CARBON CAPTURE MATERIALS MARKET, BY END USER, 2025-2030 (USD MILLION)
- TABLE 234 REST OF SOUTH AMERICA: CARBON CAPTURE MATERIALS MARKET, BY END USER, 2021-2024 (KILOTON)
- TABLE 235 REST OF SOUTH AMERICA: CARBON CAPTURE MATERIALS MARKET, BY END USER, 2025-2030 (KILOTON)
- TABLE 236 CARBON CAPTURE MATERIALS MARKET: OVERVIEW OF STRATEGIES ADOPTED BY KEY PLAYERS, JANUARY 2021-MAY 2025
- TABLE 237 CARBON CAPTURE MATERIALS MARKET: DEGREE OF COMPETITION, 2024
- TABLE 238 CARBON CAPTURE MATERIALS MARKET: MATERIAL FOOTPRINT
- TABLE 239 CARBON CAPTURE MATERIALS MARKET: PROCESS FOOTPRINT
- TABLE 240 CARBON CAPTURE MATERIALS MARKET: END-USER FOOTPRINT
- TABLE 241 CARBON CAPTURE MATERIALS MARKET: REGION FOOTPRINT
- TABLE 242 CARBON CAPTURE MATERIALS MARKET: LIST OF KEY STARTUPS/SMES
- TABLE 243 CARBON CAPTURE MATERIALS MARKET: COMPETITIVE BENCHMARKING OF KEY STARTUPS/SMES (1/2)
- TABLE 244 CARBON CAPTURE MATERIALS MARKET: COMPETITIVE BENCHMARKING OF KEY STARTUPS/SMES (2/2)
- TABLE 245 CARBON CAPTURE MATERIALS MARKET: DEALS, JANUARY 2021-MAY 2025
- TABLE 246 CARBON CAPTURE MATERIALS MARKET: EXPANSIONS, JANUARY 2021-MAY 2025
- TABLE 247 BASF: COMPANY OVERVIEW
- TABLE 248 BASF: PRODUCTS/SOLUTIONS/SERVICES OFFERED
- TABLE 249 BASF: DEALS
- TABLE 250 DOW: COMPANY OVERVIEW
- TABLE 251 DOW: PRODUCTS/SOLUTIONS/SERVICES OFFERED
- TABLE 252 BASF: EXPANSIONS
- TABLE 253 HONEYWELL INTERNATIONAL INC.: COMPANY OVERVIEW
- TABLE 254 HONEYWELL INTERNATIONAL INC.: PRODUCTS/SOLUTIONS/SERVICES OFFERED
- TABLE 255 HONEYWELL INTERNATIONAL INC.: DEALS
- TABLE 256 MITSUBISHI HEAVY INDUSTRIES, LTD.: COMPANY OVERVIEW
- TABLE 257 MITSUBISHI HEAVY INDUSTRIES, LTD.: PRODUCTS/SOLUTIONS/ SERVICES OFFERED
- TABLE 258 MITSUBISHI HEAVY INDUSTRIES, LTD.: DEALS
- TABLE 259 TOSOH CORPORATION: COMPANY OVERVIEW
- TABLE 260 TOSOH CORPORATION: PRODUCTS/SOLUTIONS/SERVICES OFFERED
- TABLE 261 AIR PRODUCTS AND CHEMICALS, INC.: COMPANY OVERVIEW
- TABLE 262 AIR PRODUCTS AND CHEMICALS, INC.: PRODUCTS/SOLUTIONS/ SERVICES OFFERED
- TABLE 263 AIR PRODUCTS AND CHEMICALS, INC.: EXPANSIONS
- TABLE 264 ZEOCHEM: COMPANY OVERVIEW
- TABLE 265 ZEOCHEM: PRODUCTS/SOLUTIONS/SERVICES OFFERED
- TABLE 266 ECOLAB: COMPANY OVERVIEW
- TABLE 267 ECOLAB: PRODUCTS/SOLUTIONS/SERVICES OFFERED
- TABLE 268 ECOLAB: DEALS
- TABLE 269 SVANTE TECHNOLOGIES INC.: COMPANY OVERVIEW
- TABLE 270 SVANTE TECHNOLOGIES INC.: PRODUCTS/SOLUTIONS/SERVICES OFFERED
- TABLE 271 SVANTE TECHNOLOGIES INC.: DEALS
- TABLE 272 CALGON CARBON CORPORATION: COMPANY OVERVIEW
- TABLE 273 CALGON CARBON CORPORATION: PRODUCTS/SOLUTIONS/SERVICES OFFERED
- TABLE 274 BOYCE CARBON: COMPANY OVERVIEW
- TABLE 275 JALON: COMPANY OVERVIEW
- TABLE 276 SPIRITUS: COMPANY OVERVIEW
- TABLE 277 CARBON ACTIVATED CORPORATION: COMPANY OVERVIEW
- TABLE 278 WARTSILA: COMPANY OVERVIEW
- TABLE 279 CLARIANT AG: COMPANY OVERVIEW
List of Figures
- FIGURE 1 CARBON CAPTURE MATERIALS MARKET: SEGMENTATION AND REGIONAL SCOPE
- FIGURE 2 CARBON CAPTURE MATERIALS MARKET: RESEARCH DESIGN
- FIGURE 3 MARKET SIZE ESTIMATION METHODOLOGY: SUPPLY-SIDE APPROACH
- FIGURE 4 MARKET SIZE ESTIMATION METHODOLOGY: DEMAND-SIDE APPROACH
- FIGURE 5 MARKET SIZE ESTIMATION METHODOLOGY: REVENUE OF MARKET PLAYERS, 2024
- FIGURE 6 MARKET SIZE ESTIMATION METHODOLOGY: BOTTOM-UP APPROACH
- FIGURE 7 MARKET SIZE ESTIMATION METHODOLOGY: TOP-DOWN APPROACH
- FIGURE 8 CARBON CAPTURE MATERIALS MARKET: DATA TRIANGULATION
- FIGURE 9 MEMBRANES SEGMENT TO DOMINATE MARKET IN 2030
- FIGURE 10 ABSORPTION SEGMENT TO EXHIBIT HIGHER CAGR DURING FORECAST PERIOD
- FIGURE 11 POST-COMBUSTION SEGMENT TO RECORD HIGHEST GROWTH BETWEEN 2025 AND 2030
- FIGURE 12 OIL & GAS SEGMENT TO REGISTER HIGHEST CAGR BETWEEN 2025 AND 2030
- FIGURE 13 ASIA PACIFIC TO REGISTER HIGHEST CAGR DURING FORECAST PERIOD
- FIGURE 14 GROWING USE OF CARBON CAPTURE MATERIALS IN OIL & GAS AND POWER INDUSTRIES TO CREATE LUCRATIVE OPPORTUNITIES FOR MARKET PLAYERS
- FIGURE 15 SOLID SOLVENTS SEGMENT TO REGISTER FASTEST GROWTH DURING FORECAST PERIOD
- FIGURE 16 ABSORPTION SEGMENT TO REGISTER FAST GROWTH DURING FORECAST PERIOD
- FIGURE 17 POST-COMBUSTION SEGMENT TO REGISTER FASTEST GROWTH FROM 2025 TO 2030
- FIGURE 18 OIL & GAS SEGMENT TO REGISTER FASTEST GROWTH FROM 2025 TO 2030
- FIGURE 19 CHINA TO REGISTER HIGHEST GROWTH DURING FORECAST PERIOD
- FIGURE 20 CARBON CAPTURE MATERIALS MARKET: DRIVERS, RESTRAINTS, OPPORTUNITIES, AND CHALLENGES
- FIGURE 21 USE OF GENERATIVE AI IN CARBON CAPTURE MATERIALS MARKET
- FIGURE 22 TRENDS/DISRUPTIONS INFLUENCING CUSTOMER BUSINESS
- FIGURE 23 CARBON CAPTURE MATERIALS MARKET: SUPPLY CHAIN ANALYSIS
- FIGURE 24 AVERAGE SELLING PRICE TREND OF CARBON CAPTURE MATERIALS, BY REGION, 2021-2024 (USD/KILOTON)
- FIGURE 25 AVERAGE SELLING PRICE TREND OF CARBON CAPTURE MATERIALS OFFERED BY KEY PLAYERS, BY MATERIAL, 2024 (USD/KILOTON)
- FIGURE 26 CARBON CAPTURE MATERIALS MARKET: INVESTMENT AND FUNDING SCENARIO, 2023-2025 (USD BILLION)
- FIGURE 27 CARBON CAPTURE MATERIALS: ECOSYSTEM ANALYSIS
- FIGURE 28 NUMBER OF PATENTS GRANTED, 2015-2024
- FIGURE 29 CARBON CAPTURE MATERIALS MARKET: LEGAL STATUS OF PATENTS
- FIGURE 30 PATENT ANALYSIS FOR CARBON CAPTURE MATERIALS, BY JURISDICTION, 2015-2024
- FIGURE 31 TOP COMPANIES WITH HIGHEST NUMBER OF PATENTS IN LAST 10 YEARS
- FIGURE 32 EXPORT DATA OF HS CODE 380210-COMPLIANT PRODUCTS, BY COUNTRY, 2021-2024 (USD THOUSAND)
- FIGURE 33 IMPORT DATA OF HS CODE 380210-COMPLIANT PRODUCTS, BY COUNTRY, 2021-2024 (USD THOUSAND)
- FIGURE 34 CARBON CAPTURE MATERIALS MARKET: PORTER'S FIVE FORCES ANALYSIS
- FIGURE 35 INFLUENCE OF STAKEHOLDERS ON BUYING PROCESS FOR TOP THREE END USERS
- FIGURE 36 KEY BUYING CRITERIA FOR TOP THREE END-USE INDUSTRIES
- FIGURE 37 ABSORPTION SEGMENT TO HOLD LARGER SHARE OF CARBON CAPTURE MATERIALS MARKET IN 2025
- FIGURE 38 MEMBRANES SEGMENT TO LEAD CARBON CAPTURE MATERIALS MARKET IN 2025
- FIGURE 39 POST-COMBUSTION SEGMENT TO HOLD LARGEST SHARE OF CARBON CAPTURE MATERIALS MARKET IN 2025
- FIGURE 40 OIL & GAS SEGMENT TO HOLD LARGEST SHARE OF CARBON CAPTURE MATERIALS MARKET IN 2025
- FIGURE 41 ASIA PACIFIC TO BE FASTEST-GROWING MARKET DURING FORECAST PERIOD
- FIGURE 42 ASIA PACIFIC: CARBON CAPTURE MATERIALS MARKET SNAPSHOT
- FIGURE 43 NORTH AMERICA: CARBON CAPTURE MATERIALS MARKET SNAPSHOT
- FIGURE 44 EUROPE: CARBON CAPTURE MATERIALS MARKET SNAPSHOT
- FIGURE 45 CARBON CAPTURE MATERIALS MARKET SHARE ANALYSIS, 2024
- FIGURE 46 CARBON CAPTURE MATERIALS MARKET: REVENUE ANALYSIS OF KEY PLAYERS, 2021-2024 (USD BILLION)
- FIGURE 47 CARBON CAPTURE MATERIALS MARKET: BRAND/PRODUCT COMPARATIVE ANALYSIS
- FIGURE 48 CARBON CAPTURE MATERIALS MARKET: COMPANY EVALUATION MATRIX (KEY PLAYERS), 2024
- FIGURE 49 CARBON CAPTURE MATERIALS MARKET: COMPANY FOOTPRINT
- FIGURE 50 CARBON CAPTURE MATERIALS MARKET: COMPANY EVALUATION MATRIX (STARTUPS/SMES), 2024
- FIGURE 51 CARBON CAPTURE MATERIALS MARKET: EV/EBITDA OF KEY VENDORS
- FIGURE 52 CARBON CAPTURE MATERIALS MARKET: YEAR-TO-DATE (YTD) PRICE TOTAL RETURN, 2020-2024
- FIGURE 53 BASF: COMPANY SNAPSHOT
- FIGURE 54 DOW: COMPANY SNAPSHOT
- FIGURE 55 HONEYWELL INTERNATIONAL INC.: COMPANY SNAPSHOT
- FIGURE 56 MITSUBISHI HEAVY INDUSTRIES, LTD.: COMPANY SNAPSHOT
- FIGURE 57 AIR PRODUCTS AND CHEMICALS, INC.: COMPANY SNAPSHOT
 先進碳材料市場預測至2034年—按產品類型、形態、應用、最終用戶和地區分類的全球分析
 先進碳材料市場規模、佔有率和成長分析:按類型、應用、最終用途和地區分類-2026-2033年產業預測
 全球碳捕獲利用衍生碳材料市場(2026-2036 年)捕碳封存(CCS)材料市場預測至2034年-按材料、技術、應用、儲存方法、最終用戶和地區分類的全球分析
 先進碳材料市場:按材料類型、形狀、製造技術、應用和分銷管道分類-2026-2032年全球市場預測
 2026年全球二氧化碳捕集材料市場報告
 先進碳材料市場規模、佔有率和趨勢分析報告:按產品、應用、地區和細分市場預測(2026-2033 年)
 碳材料酚醛樹脂市場-全球產業規模、佔有率、趨勢、機會和預測,按類型(酚醛樹脂和碳樹脂)、應用(陶瓷、水泥、金屬、石墨)、地區和競爭格局分類,2020-2030年預測輪胎橡膠酚醛樹脂市場規模、佔有率和趨勢分析報告:按產品、性能/功能、原料、最終用途、地區和細分市場預測(2025-2033 年)全球碳捕獲材料市場:預測至2032年-按材料、製程、技術、最終用戶和地區分類的分析