


 |
市場調查報告書
商品編碼
1819107
全球 NOC 即服務市場(按服務類型、支援模式和行業垂直分類)- 預測至 2030 年NOC as a Service Market by Service Type, Support Model, and Vertical (BFSI, Healthcare & Life Sciences, IT & ITES, Government & Public Sector) - Global Forecast to 2030 |
||||||
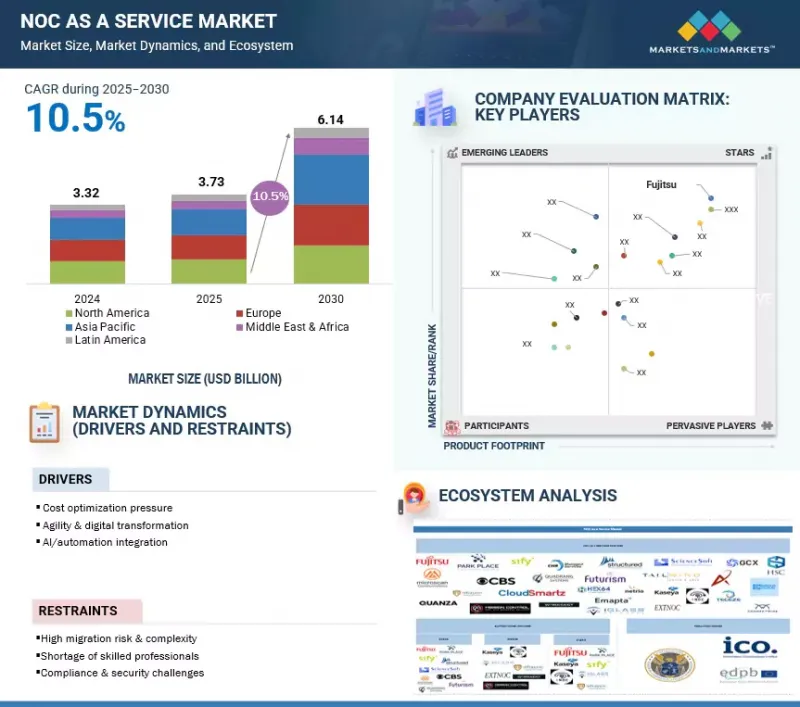
預計 2025 年全球 NOC 即服務市場價值將達到 37.3 億美元,到 2030 年將達到 61.4 億美元,2025 年至 2030 年的複合年成長率為 10.5%。
隨著不間斷的數位管道、遠端工作和廣泛的邊緣足跡擴大了事件面並加強了審核審查,NOC 即服務正在從人員擴充部分發展成為混合/多重雲端企業的營運主幹。
| 調查範圍 | |
|---|---|
| 調查年份 | 2019-2030 |
| 基準年 | 2024 |
| 預測期 | 2025-2030 |
| 單元 | 百萬美元/十億美元 |
| 部分 | 服務類型、支援模式、產業、區域 |
| 目標區域 | 北美、歐洲、亞太地區、中東和非洲、拉丁美洲 |
按服務類型分類,預計心臟事件記錄器和管理部門將在預測期內引領市場。
心臟事件記錄器和管理預計將佔據最大的市場規模,因為它是最頻繁、始終存在的工作負載,並管理所有下游 NOC 即服務交付成果的訊號保真度。這需要跨多供應商資產收集全天候遙測數據,進行關聯分析以將警報風暴分解為單一可操作的事件,並透過拓撲結構和最新變更資料豐富上下文,使工單能夠立即執行,而非診斷佔位符。提供者可以透過工程化的事件管道和 AIOps 大規模地實現這一點,直接減少警報到工單的延遲,壓縮平均等待時間 (MTTA)/平均修復時間 (MTTR),並透過自動關閉瞬態狀態並在重複資料到達人工層之前進行抑制來減少每個受監控端點的工單數量。預算集中於此的原因很簡單:只有當監控平面提供高品質、去重的事件並包含豐富的變更上下文時,事件和問題管理、服務報告和分析以及容量和變更管理才能按合約規定執行。因此,採購應從心臟事件記錄器和管理入手,並在相關性改善後再擴展範圍。一些案例有力地證明了這一點:ConnectWise 將其 NOC 定位為一項服務,專注於持續監控,整合了補丁程序和 BDR 監控,並發布從警報到工單再到修復的報告,供合作夥伴用來證明噪音降低和 SLA 合規性;富士通推出了經 ISO認證的多供應商監控服務,該服務可處理極高的事件量,並直接從運行手冊執行預定義的營運商升級,這充分錶明高保真監控和關聯性在受監管的營運商級環境中對商業性價值至關重要。
從垂直角度來看,BFSI 部門預計將在預測期內佔據最大的市場佔有率。
預計BFSI領域將佔據最大的市場佔有率,因為企業會購買證據優先、具有明確審核要求的NOC即服務解決方案,從而擴大合約的範圍和期限。 BFSI購買異地或混合營運結構,其中心臟事件記錄器和管理與運行主導驅動的事件和問題管理相結合,並提供月度服務報告和分析包,包括平均修復時間(異地) 、警報到工單的延遲、補丁合規性以及適合內部審核和監管機構的備份測試和恢復證明。供應商透過提供符合ISO標準的流程、嚴格的職責分類以及預先定義的升級路徑(包括營運商升級)以及可追溯的核准和回溯證據來贏得BFSI的青睞。從偵測到變更,所有操作都對應到運作手冊,並反映在可抽樣和審查的報告中。 BFSI的高網路關鍵性和多層合規性要求使得維持內部全天候人員配置不經濟,這反過來又會因需要合理的證據而導致巨額費用。
本報告分析了全球 NOC 即服務市場,提供了關鍵促進因素和限制因素、競爭格局和未來趨勢的資訊。
目錄
第1章 引言
第2章調查方法
第3章執行摘要
第4章 主要發現
- NOC 即服務市場主要企業的誘人機會
- 按服務類型分類的 NOC 市場
- 按支援模式分類的 NOC 即服務市場
- NOC即服務市場:依行業分類
- 北美 NOC 即服務市場(按服務類型和支援模式)
第5章市場概況及產業趨勢
- 介紹
- 市場動態
- 驅動程式
- 抑制因素
- 機會
- 任務
- NOC即服務的演變
- NOC即服務市場:生態系分析/市場地圖
- 案例研究分析
- 供應鏈分析
- 監管格局
- 監管機構、政府機構和其他組織
- 主要法規
- 定價分析
- 技術分析
- 主要技術
- 鄰近技術
- 互補技術
- 專利分析
- 波特五力分析
- 影響客戶業務的趨勢/中斷
- 主要相關利益者和採購標準
- 大型會議及活動
- NOC即服務市場的技術藍圖
- 短期藍圖(2023-2025)
- 中期藍圖(2026-2028)
- 長期藍圖(2029-2030)
- NOC即服務市場的最佳實踐
- 投資金籌措場景
- 生成式人工智慧對 NOC 即服務市場的影響
- 主要用例和市場潛力
- 最佳實踐
- 生成式人工智慧實施案例研究
- 客戶準備和影響評估
- 2025年美國關稅的影響—概述
- 主要關稅稅率
- 價格影響分析
- 對國家的影響
- 北美洲
- 歐洲
- 亞太地區
- 對產業的影響
第6章 NOC 即服務市場(依服務類型)
- 介紹
- 心臟事件記錄器與管理
- 事件和問題管理
- 服務報告和分析
- 容量和變更管理
- 其他服務類型
第7章 NOC 即服務市場(依支援模式)
- 介紹
- 現場
- 異地
- 混合
第 8 章 NOC 即服務市場:按行業
- 介紹
- BFSI
- 醫學與生命科學
- 政府/公共部門
- 通訊/CSV
- 資訊科技/資訊科技服務
- 零售與電子商務
- 能源與公共產業
- 運輸和物流
- 其他行業
第9章 NOC 即服務市場:按地區
- 介紹
- 北美洲
- 北美宏觀經濟展望
- 美國
- 加拿大
- 歐洲
- 歐洲宏觀經濟展望
- 德國
- 英國
- 法國
- 西班牙
- 義大利
- 其他歐洲國家
- 亞太地區
- 亞太宏觀經濟展望
- 中國
- 日本
- 印度
- 韓國
- 澳洲和紐西蘭
- 新加坡
- 其他亞太地區
- 中東和非洲
- 中東和非洲的宏觀經濟展望
- 沙烏地阿拉伯
- 阿拉伯聯合大公國
- 南非
- 其他中東和非洲地區
- 拉丁美洲
- 拉丁美洲宏觀經濟展望
- 巴西
- 墨西哥
- 其他拉丁美洲
第10章 競爭格局
- 介紹
- 主要參與企業的策略/優勢(2022-2025)
- 市佔率分析(2024年)
- 收益分析(2020-2024)
- 品牌/產品比較
- 公司估值及財務指標
- 企業評估矩陣:主要企業(2024年)
- 公司評估矩陣:Start-Ups/中小企業(2024 年)
- 競爭場景
第 11 章:公司簡介
- 主要企業
- FUJITSU
- KASEYA
- SIFY TECHNOLOGIES
- PARK PLACE TECHNOLOGIES
- CONNECTWISE (THOMA BRAVO)
- IGLASS NETWORKS (20 SOUTH PARTNERS)
- TAILWIND VOICE & DATA
- GCX (3I INFRASTRUCTURE PLC)
- STRUCTURED COMMUNICATION SYSTEMS
- 其他主要企業
- INFRASSIST TECHNOLOGIES
- EXTNOC (EXTERNETWORKS)
- MISSION CONTROL NOC
- WORKSENT
- CHR MANAGED SERVICES
- SCIENCESOFT
- MICROSCAN COMMUNICATIONS
- CBS (COSMOS BUSINESS SYSTEMS)
- QUADRANG SYSTEMS
- FUTURISM TECHNOLOGIES
- EMAPTA
- Start-Ups/中小型企業
- NETRIO
- QUANZA
- CLOUDSMARTZ
- HSC (HUGHES SYSTIQUE CORPORATION)
- MEDHA CLOUD
- TECEZE
- HEX64
第12章:相鄰市場與相關市場
- 介紹
- 資料中心網路市場
- SOC即服務(SOCaaS)市場
第13章 附錄
The NOC as a Service market is estimated to be USD 3.73 billion in 2025 and is projected to reach USD 6.14 billion by 2030 at a CAGR of 10.5% from 2025 to 2030. NOC as a Service is evolving from a staff-augmentation line item to the operational backbone for hybrid and multi-cloud enterprises, as nonstop digital channels, remote work, and sprawling edge footprints expand incident surfaces and intensify audit scrutiny.
| Scope of the Report | |
|---|---|
| Years Considered for the Study | 2019-2030 |
| Base Year | 2024 |
| Forecast Period | 2025-2030 |
| Units Considered | Value (USD) Million/Billion |
| Segments | Service Type, Support Model, Vertical, and Region |
| Regions covered | North America, Europe, Asia Pacific, Middle East & Africa, and Latin America |
What buyers now procure are [outcomes across four scoped capabilities: Event Monitoring & Management that collapses alarm storms into a single actionable incident with change and topology context; Incident & Problem Management that executes runbooked diagnostics, carrier or provider escalations, and safe rollback to compress MTTR; Service Reporting & Analysis that delivers audit-ready MTTA/MTTR, alarm-to-ticket latency, patch adherence, and backup test-restore evidence; and Capacity & Change Management that governs patch windows, configuration baselines, and separation of duties. Providers differentiate themselves by activating Offsite coverage in weeks instead of quarters. They also extend Hybrid services for key Onsite changes and publish high-quality evidence packs suitable for executive review, ensuring they can withstand internal audits and regulator sampling. This approach is reflected in their platform-attached offerings, which combine 24/7 monitoring with patch management and backup disaster recovery (BDR) oversight. Additionally, they implement ISO-compliant multivendor programs that establish predefined escalation paths for regulated networks.
At the same time, adoption exposes execution gaps that separate leaders from the field: runbook immaturity, unclear RACI between Offsite and Onsite teams, and weak evidence discipline can stall transitions and jeopardize renewals in BFSI, healthcare & life sciences, and government & public sector. What high-performing programs do differently is industrialize correlation and suppression during the first sprints to cut duplicate noise double-digits, codify escalation timers and rollback in machine-readable playbooks, and tie renewals to measurable hygiene outcomes, patch adherence, and test-restore success, alongside MTTR ratchets. How this shapes the market is visible in contracting patterns: Offsite models capture the largest share due to 24/7 scale economics, Hybrid grows where privileged change control is non-negotiable, North America leads on platform attachment and audit culture, and Asia Pacific posts the fastest growth as multi-country estates standardize on Offsite operations with local Onsite benches. Why this persists is simple: evidence-first delivery converts uptime and compliance into budgeted outcomes, turning NOC as a Service from an optional cost takeout into a long-horizon resilience investment.
By service type, the event monitoring & management segment is estimated to lead the market during the forecast period
Event Monitoring & Management will anchor the largest market size because it is the highest-frequency, always-on workload that governs signal fidelity for every downstream NOC as a Service deliverable. What this entails is 24/7 telemetry ingestion across multivendor estates, correlation that collapses alarm storms into a single actionable incident, and context enrichment with topology and recent change data so that tickets are immediately actionable rather than diagnostic placeholders. Providers operationalize this at scale through engineered event pipelines and AIOps that auto-close transient conditions and suppress duplicates before they hit human tiers, which directly reduces alarm-to-ticket latency, compresses MTTA/MTTR, and lowers ticket volume per monitored endpoint. Why budgets concentrate here is straightforward: Incident & Problem Management, Service Reporting & Analysis, and Capacity & Change Management only perform to contract if the monitoring plane delivers high-quality, deduplicated incidents with change context attached; hence, procurement lands first on Event Monitoring & Management and then expands scope after correlation gains are evidenced. Instances underscore this primacy: ConnectWise positions NOC as a Service around continuous monitoring with integrated patch and BDR oversight, publishing alarm-to-ticket-to-fix reporting that partners use to prove noise reduction and SLA adherence; this evidence-first approach drives initial contract value to the monitoring layer before layered runbooks expand remediation scope. Fujitsu markets ISO-certified, multivendor monitoring that handles very large event volumes and executes predefined carrier escalations directly from runbooks, illustrating how high-fidelity monitoring and correlation sit at the center of commercial value in regulated and carrier-class environments.
By vertical, the BFSI segment is estimated to account for the largest market share during the forecast period
The BFSI (Banking, Financial Services, & Insurance) segment is expected to command the largest market share because it purchases evidence-first NOC as a Service with explicit audit requirements that expand contract scope and term. BFSI buys an Offsite or Hybrid operating construct where Event Monitoring & Management are paired with runbook-driven Incident & Problem Management and monthly Service Reporting & Analysis packs containing MTTR, alarm-to-ticket latency, patch adherence, and backup test-restore proofs suitable for internal audit and regulators. Providers win BFSI by delivering ISO-anchored processes, strict separation of duties, and predefined escalation paths (including carrier escalations) with traceable approvals and rollback evidence. Thus, every action, from detection through change, is mapped to a runbook and reflected in reports that stand up to sampling and review. This translates to outsized spending as BFSI blends high network criticality with layered compliance, making it uneconomic to staff 24/7 internally while simultaneously requiring defensible evidence; subscription NOC as a Service with Hybrid change windows addresses both constraints and supports multi-year renewals. Instances show the pattern: Fujitsu's managed NOC emphasizes multivendor monitoring from ISO-certified facilities and runbooked carrier escalations with compliance-grade artifacts, a posture aligned to BFSI control expectations and board-level reporting cycles. Similarly, ConnectWise's reporting that maps alarm to ticket to fix gives MSPs serving financial institutions a repeatable evidence trail to pass customer audits and justify expanding the Offsite scope.
North America will lead in market share, while Asia Pacific is projected to witness the fastest growth during the forecast period
North America leads in market share while Asia Pacific delivers the highest growth because mature platform ecosystems and strict evidence expectations anchor current spend in North America, whereas rapid hybrid connectivity build-outs and co-sourcing models propel accelerated adoption in Asia Pacific. What characterizes North America is heavy reliance on productized Offsite NOC as a Service bundled with RMM and BCDR, executive-grade Service Reporting & Analysis, and standardized runbooks suited to compliance-sensitive sectors, which collectively translate into larger initial contracts and higher net retention across MSP and enterprise buyers. Asia Pacific will outgrow other regions through rapid SD-WAN and cloud-edge rollouts across multi-country enterprises that need 24/7 Event Monitoring & Management immediately and Hybrid models for privileged Onsite changes, enabling providers to activate coverage in weeks rather than quarters while aligning spend to MTTR and hygiene outcomes instead of headcount. Why this split persists is ecosystem maturity and governance: North America's deep MSP channels, platform attachment, and audit culture sustain the largest revenue base, while Asia Pacific's expansion and skills constraints create the steepest slope for NOC as a Service subscription as organizations standardize on Offsite operations with local Onsite benches. Instances reflect these dynamics: ConnectWise's North America-centric partner network attaches NOC as a Service to reduce overnight ticket loads and prove patch and backup hygiene in executive reviews, reinforcing regional share, while providers building Asia Pacific hubs leverage standardized monitoring and Hybrid change windows to win multi-country expansions across India, ASEAN, Japan, and ANZ at a faster clip than other regions.
Breakdown of Primary Interviews
The study contains insights from various industry experts, from solution vendors to Tier 1 companies. The breakdown of the primary interviews is as follows:
- By Company Type: Tier 1 - 35%, Tier 2 - 40%, and Tier 3 - 25%
- By Designation: C-level - 20%, Directors - 30%, and Others - 50%
- By Region: North America - 40%, Europe - 35%, Asia Pacific - 20%, Rest of the World - 5%
The major players in the NOC as a Service market are Fujitsu (Japan), Park Place Technologies (US), Kaseya (US), Sify Technologies (India), INOC (US), iGlass Networks (US), Infrassist Technologies (India), EXTNOC (US), Mission Control NOC (Canada), Worksent (US), ConnectWise (US), CHR Managed Services (US), Structured (US), Science Soft (US), Microscan Communications (India), CBS (US), Quadrang Systems (India), Futurism Technologies (US), Tailwind Voice & Data (US), Emapta (Philippines), and GCX (US). These players have adopted various growth strategies, such as partnerships, agreements, collaborations, product launches, product enhancements, and acquisitions, to expand their footprint in the NOC as a Service market.
Research Coverage
This study covers the NOC as a Service market size and the growth potential across different segments, including service type (Event Monitoring & Management, Incident & Problem Management, Service Reporting & Analysis, Capacity & Change Management), support model (Onsite, Offsite, Hybrid), vertical (Banking, Financial Services, & Insurance; Healthcare & Life Sciences; Government & Public Sector; Telecom & CSVS; IT & ITeS; Retail & E-commerce; Energy & Utilities; Transportation & Logistics), and region. The study includes an in-depth competitive analysis of the leading market players, their company profiles, key observations related to product and business offerings, recent developments, and market strategies.
Key Benefits of Buying the Report
The report will help market leaders and new entrants with information on the closest approximations of the global NOC as a Service market's revenue numbers and subsegments. It will also help stakeholders understand the competitive landscape and gain more insights to position their businesses better and plan suitable go-to-market strategies. Moreover, the report will provide insights for stakeholders to understand the market's pulse and provide them with information on key market drivers, restraints, challenges, and opportunities.
The report provides insights into the following points:
- Analysis of key drivers (Cost savings, scalability, 24/7 monitoring, access to expertise, reduced operational overhead, improved service quality, enhanced network security, focus on core business activities, rapid deployment, flexibility in service offerings), restraints (Data privacy concerns, dependency on third-party providers, integration complexities, potential service disruptions, limited control over operations, communication barriers, lack of customization, security risks, vendor lock-in, regulatory compliance issues), opportunities (Integration of AI and automation, expansion into emerging markets, demand from SMEs, convergence of NOC and SOC services, growth in remote work environments, adoption of cloud-based solutions, partnerships with MSPs, development of specialized NOCaaS offerings, increasing reliance on IoT, advancements in cybersecurity), and challenges (Maintaining service quality, managing multivendor environments, ensuring data security, addressing skill shortages, adapting to technological advancements, handling large-scale deployments, meeting compliance requirements, managing customer expectations, ensuring service continuity, adapting to market dynamics) influencing the growth of the NOC as a Service market.
- Product Development/Innovation: Detailed insights into upcoming technologies, research & development activities, and product & service launches in the NOC as a Service market
- Market Development: Comprehensive information about lucrative markets - analyzing the NOC as a Service market across various regions
- Market Diversification: Exhaustive information about new products & services, untapped geographies, recent developments, and investments in the NOC as a Service market
- Competitive Assessment: In-depth assessment of market shares, growth strategies, and service offerings of leading players such as Fujitsu (Japan), Park Place Technologies (US), Kaseya (US), Sify Technologies (India), INOC (US), iGlass Networks (US), Infrassist Technologies (India), EXTNOC (US), Mission Control NOC (Canada), Worksent (US), ConnectWise (US), CHR Managed Services (US), Structured (US), Science Soft (US), Microscan Communications (India), CBS (US), Quadrang Systems (India), Futurism Technologies (US), Tailwind Voice & Data (US), Emapta (Philippines), and GCX (US).
TABLE OF CONTENTS
1 INTRODUCTION
- 1.1 STUDY OBJECTIVES
- 1.2 MARKET DEFINITION
- 1.3 STUDY SCOPE
- 1.3.1 MARKET SEGMENTATION AND REGIONS COVERED
- 1.3.2 INCLUSIONS & EXCLUSIONS
- 1.4 YEARS CONSIDERED
- 1.5 CURRENCY CONSIDERED
- 1.6 STAKEHOLDERS
- 1.7 SUMMARY OF CHANGES
2 RESEARCH METHODOLOGY
- 2.1 RESEARCH DATA
- 2.1.1 SECONDARY DATA
- 2.1.2 PRIMARY DATA
- 2.1.2.1 Primary interviews with experts
- 2.1.2.2 Breakdown of primary profiles
- 2.1.2.3 Key insights from industry experts
- 2.2 MARKET SIZE ESTIMATION
- 2.2.1 TOP-DOWN APPROACH
- 2.2.2 BOTTOM-UP APPROACH
- 2.2.3 NOC AS A SERVICE MARKET ESTIMATION: DEMAND-SIDE ANALYSIS
- 2.3 DATA TRIANGULATION
- 2.4 RISK ASSESSMENT
- 2.5 RESEARCH ASSUMPTIONS
- 2.6 RESEARCH LIMITATIONS
3 EXECUTIVE SUMMARY
4 PREMIUM INSIGHTS
- 4.1 ATTRACTIVE OPPORTUNITIES FOR KEY PLAYERS IN NOC AS A SERVICE MARKET
- 4.2 NOC AS A SERVICE MARKET, BY SERVICE TYPE
- 4.3 NOC AS A SERVICE MARKET, BY SUPPORT MODEL
- 4.4 NOC AS A SERVICE MARKET, BY VERTICAL
- 4.5 NORTH AMERICA: NOC AS A SERVICE MARKET, BY SERVICE TYPE AND SUPPORT MODEL
5 MARKET OVERVIEW AND INDUSTRY TRENDS
- 5.1 INTRODUCTION
- 5.2 MARKET DYNAMICS
- 5.2.1 DRIVERS
- 5.2.1.1 Adoption of AI & AIOps for network automation and efficiency
- 5.2.1.2 Growing demand for cybersecurity and 24/7 threat monitoring
- 5.2.1.3 Expansion of cloud and hybrid infrastructure requiring scalable NOC solutions
- 5.2.2 RESTRAINTS
- 5.2.2.1 Regulatory and data sovereignty constraints in sensitive industries
- 5.2.2.2 Integration of complexity with legacy and proprietary systems
- 5.2.2.3 High cost of deployment and ROI concerns among SMBs
- 5.2.3 OPPORTUNITIES
- 5.2.3.1 Industry-specific and compliance-focused NOCaaS solutions for regulated sectors
- 5.2.3.2 Growing potential for SMB and mid-market tailored service packages
- 5.2.3.3 Rising adoption of 5G, Edge, and IoT networks requiring advanced NOC capabilities
- 5.2.4 CHALLENGES
- 5.2.4.1 Alert fatigue and noisy telemetry impacting incident management
- 5.2.4.2 Tool fragmentation and data silos limiting unified visibility
- 5.2.4.3 Shortage of skilled engineers for automation and AIOps integration
- 5.2.1 DRIVERS
- 5.3 EVOLUTION OF NOC AS A SERVICE
- 5.4 NOC AS A SERVICE MARKET: ECOSYSTEM ANALYSIS/ MARKET MAP
- 5.5 CASE STUDY ANALYSIS
- 5.5.1 OIL & GAS CLIENT MODERNIZES REMOTE OPERATIONS WITH EXTERNETWORKS' MANAGED NOC MONITORING SERVICES
- 5.5.2 ADTRAN STRENGTHENS ITS NOC SERVICE WITH INOC'S STRUCTURED ONBOARDING, TRAINING, AND QUALITY ASSURANCE
- 5.5.3 ADVANCED NETWORK PRODUCTS (ANP) ACCELERATES AUTOMATION AND SCALABILITY WITH CONNECTWISE RMM AND NOC SERVICES
- 5.6 SUPPLY CHAIN ANALYSIS
- 5.7 REGULATORY LANDSCAPE
- 5.7.1 REGULATORY BODIES, GOVERNMENT AGENCIES, AND OTHER ORGANIZATIONS
- 5.7.1.1 European Data Protection Board (EDPB)
- 5.7.1.2 OECD Privacy Framework (Organization for Economic Co-operation and Development)
- 5.7.1.3 US Federal Trade Commission (FTC)
- 5.7.2 KEY REGULATIONS
- 5.7.2.1 North America
- 5.7.2.1.1 US
- 5.7.2.2 Europe
- 5.7.2.2.1 UK
- 5.7.2.3 Asia Pacific
- 5.7.2.3.1 India
- 5.7.2.3.2 Japan
- 5.7.2.4 Middle East & Africa
- 5.7.2.4.1 Saudi Arabia
- 5.7.2.5 Latin America
- 5.7.2.5.1 Brazil
- 5.7.2.1 North America
- 5.7.1 REGULATORY BODIES, GOVERNMENT AGENCIES, AND OTHER ORGANIZATIONS
- 5.8 PRICING ANALYSIS
- 5.8.1 INDICATIVE PRICING ANALYSIS, BY SERVICE TYPE, 2024
- 5.9 TECHNOLOGY ANALYSIS
- 5.9.1 KEY TECHNOLOGIES
- 5.9.1.1 Network performance monitoring
- 5.9.1.2 Log parsing and indexing
- 5.9.1.3 Complex event processing (CEP)
- 5.9.2 ADJACENT TECHNOLOGIES
- 5.9.2.1 Machine learning (anomaly detection)
- 5.9.2.2 Automated incident remediation
- 5.9.3 COMPLEMENTARY TECHNOLOGIES
- 5.9.3.1 Synthetic transaction monitoring
- 5.9.3.2 Configuration automation
- 5.9.3.3 Threat intelligence ingestion
- 5.9.1 KEY TECHNOLOGIES
- 5.10 PATENT ANALYSIS
- 5.11 PORTER'S FIVE FORCES ANALYSIS
- 5.11.1 THREAT OF NEW ENTRANTS
- 5.11.2 THREAT OF SUBSTITUTES
- 5.11.3 BARGAINING POWER OF SUPPLIERS
- 5.11.4 BARGAINING POWER OF BUYERS
- 5.11.5 INTENSITY OF COMPETITIVE RIVALRY
- 5.12 TRENDS/DISRUPTIONS IMPACTING CUSTOMER BUSINESS
- 5.13 KEY STAKEHOLDERS AND BUYING CRITERIA
- 5.13.1 KEY STAKEHOLDERS IN BUYING PROCESS
- 5.13.2 BUYING CRITERIA
- 5.14 KEY CONFERENCES AND EVENTS
- 5.15 TECHNOLOGY ROADMAP FOR NOC AS A SERVICE MARKET
- 5.15.1 SHORT-TERM ROADMAP (2023-2025)
- 5.15.2 MID-TERM ROADMAP (2026-2028)
- 5.15.3 LONG-TERM ROADMAP (2029-2030)
- 5.16 BEST PRACTICES IN NOC AS A SERVICE MARKET
- 5.16.1 CODIFY RUNBOOKS AND SHIFT LEFT
- 5.16.2 CORRELATE BEFORE YOU TICKET
- 5.16.3 AUTOMATE FIRST-LINE DIAGNOSTICS AND SAFE REMEDIATION
- 5.16.4 INTEGRATE ITSM BIDIRECTIONALLY AND REPORT WHAT MATTERS
- 5.16.5 MAINTAIN ACCURATE TOPOLOGY/CMDB FOR IMPACT AND ESCALATION
- 5.17 INVESTMENT & FUNDING SCENARIO
- 5.18 IMPACT OF GENERATIVE AI ON NOC AS A SERVICE MARKET
- 5.18.1 TOP USE CASES AND MARKET POTENTIAL
- 5.18.1.1 Key use cases
- 5.18.2 BEST PRACTICES
- 5.18.2.1 BFSI industry
- 5.18.2.2 IT & ITES industry
- 5.18.2.3 Healthcare & life sciences industry
- 5.18.3 CASE STUDIES OF GENERATIVE AI IMPLEMENTATION
- 5.18.3.1 GenAI assisted correlation and RCA in a global financial services NOC
- 5.18.3.2 Closed loop GenAI remediation for a cloud commerce portfolio
- 5.18.3.3 Internet-aware experience protection with GenAI insights for a SaaS estate
- 5.18.4 CLIENT READINESS AND IMPACT ASSESSMENT
- 5.18.4.1 Client A: Global financial services enterprise
- 5.18.4.2 Client B: Regional e commerce portfolio
- 5.18.4.3 Client C: Multinational SaaS provider
- 5.18.1 TOP USE CASES AND MARKET POTENTIAL
- 5.19 IMPACT OF 2025 US TARIFF - OVERVIEW
- 5.19.1 INTRODUCTION
- 5.20 KEY TARIFF RATES
- 5.21 PRICE IMPACT ANALYSIS
- 5.22 IMPACT ON COUNTRY/REGION
- 5.22.1 NORTH AMERICA
- 5.22.2 EUROPE
- 5.22.3 ASIA PACIFIC
- 5.23 IMPACT ON INDUSTRY
6 NOC AS A SERVICE MARKET, BY SERVICE TYPE
- 6.1 INTRODUCTION
- 6.1.1 SERVICE TYPE: NOC AS A SERVICE MARKET DRIVERS
- 6.2 EVENT MONITORING & MANAGEMENT
- 6.2.1 EFFECTIVE MONITORING SUPPRESSES NOISE, CORRELATES DEPENDENCIES, AND DELIVERS ENRICHED, ITSM-READY TICKETS
- 6.3 INCIDENT & PROBLEM MANAGEMENT
- 6.3.1 GROWING ADOPTION OF AUTOMATED, ITIL-ALIGNED, AND INTEGRATED INCIDENT/PROBLEM MANAGEMENT TO DRIVE MARKET EXPANSION
- 6.4 SERVICE REPORTING & ANALYSIS
- 6.4.1 DEMAND FOR REPORTING LINKING MTTR, CHANGES, AND PREVENTIVE WORK TO MEASURABLE OUTCOMES TO DRIVE MARKET
- 6.5 CAPACITY & CHANGE MANAGEMENT
- 6.5.1 RISING FOCUS ON CAPACITY & CHANGE AS INSTITUTIONAL CONTROLS TO DRIVE DEMAND FOR GOVERNED, MEASURABLE STABILITY IN OPERATIONS
- 6.6 OTHER SERVICE TYPES
7 NOC AS A SERVICE MARKET, BY SUPPORT MODEL
- 7.1 INTRODUCTION
- 7.1.1 SUPPORT MODEL: NOC AS A SERVICE MARKET DRIVERS
- 7.2 ONSITE
- 7.2.1 GROWING DEMAND FOR SECURE, LOW-LATENCY, HANDS-ON OPERATIONS TO DRIVE ADOPTION OF ONSITE MODELS
- 7.3 OFFSITE
- 7.3.1 RISING NEED FOR SCALABLE, AUTOMATED, AND COST-EFFICIENT 24X7 MONITORING AND INCIDENT HANDLING TO DRIVE OFFSITE MODEL GROWTH
- 7.4 HYBRID
- 7.4.1 INCREASING PREFERENCE FOR BALANCED MODELS COMBINING ONSITE PROXIMITY WITH CENTRALIZED SCALABILITY TO BOOST HYBRID ADOPTION
8 NOC AS A SERVICE MARKET, BY VERTICAL
- 8.1 INTRODUCTION
- 8.1.1 VERTICALS: NOC AS A SERVICE MARKET DRIVERS
- 8.2 BANKING, FINANCIAL SERVICES, & INSURANCE (BFSI)
- 8.2.1 BFSI DEMANDS ALWAYS-ON, AUDIT-READY NOC OPERATIONS MINIMIZING MTTR ACROSS COMPLEX, MULTI-PARTY NETWORKS WITH DISCIPLINED CHANGE GOVERNANCE
- 8.3 HEALTHCARE & LIFE SCIENCES
- 8.3.1 HEALTHCARE REQUIRES CONTINUOUS, CLINICALLY AWARE NOC OPERATIONS PRESERVING UPTIME AND EVIDENCE FOR STRINGENT PRIVACY AND ACCREDITATION CONTROLS
- 8.4 GOVERNMENT & PUBLIC SECTOR
- 8.4.1 PUBLIC-SECTOR BUYERS EXPECT NOCAAS WITH COMPLIANCE-FIRST MONITORING, AUDITABLE CHANGE/INCIDENT EVIDENCE, AND ALIGNMENT TO MODERNIZED FEDRAMP-STYLE CONTINUOUS MONITORING
- 8.5 TELECOM & CSVS
- 8.5.1 TELECOM/CSV ADOPTION CENTERS ON GNOC-STYLE SCALE, FIELD COORDINATION, AND POLICY-DRIVEN SERVICE ASSURANCE SPANNING CARRIER WAN AND ENTERPRISE ACCESS
- 8.6 IT & ITES
- 8.6.1 IT/ITES FAVORS SCALABLE, AUTOMATION-RICH OFFSITE NOCAAS TIGHTLY INTEGRATED WITH ITSM TO SUSTAIN UPTIME AND CUSTOMER COMMITMENTS
- 8.7 RETAIL & E-COMMERCE
- 8.7.1 RETAIL/E-COMMERCE RELIES ON NOCAAS TO PREVENT AND RAPIDLY RESOLVE OUTAGES DURING PEAK TRADING, PAIRING OBSERVABILITY WITH STRICT CHANGE DISCIPLINE
- 8.8 ENERGY & UTILITIES
- 8.8.1 ENERGY NOCAAS BLENDS REAL-TIME MONITORING OF DISTRIBUTED ASSETS WITH PERFORMANCE MANAGEMENT AND FIELD COORDINATION TO MAINTAIN AVAILABILITY AND SAFETY
- 8.9 TRANSPORTATION & LOGISTICS
- 8.9.1 TRANSPORTATION/LOGISTICS USES NOCAAS TO DETECT AND REMEDIATE EDGE ISSUES EARLY, COORDINATING FIELD ACTIONS TO AVOID COSTLY, CASCADING DISRUPTIONS
- 8.10 OTHER VERTICALS
9 NOC AS A SERVICE MARKET, BY REGION
- 9.1 INTRODUCTION
- 9.2 NORTH AMERICA
- 9.2.1 NORTH AMERICA: MACROECONOMIC OUTLOOK
- 9.2.2 US
- 9.2.2.1 Automation-first, compliance-driven NOCaaS adoption to drive demand
- 9.2.3 CANADA
- 9.2.3.1 Cloud growth, privacy needs, and hybrid work to drive NOCaaS adoption
- 9.3 EUROPE
- 9.3.1 EUROPE: MACROECONOMIC OUTLOOK
- 9.3.2 GERMANY
- 9.3.2.1 Strict data protection, industrial uptime, and EU-resident operations to drive NOCaaS growth
- 9.3.3 UK
- 9.3.3.1 Outcome-driven SLAs, disciplined governance, and executive-ready reporting to drive NOCaaS adoption
- 9.3.4 FRANCE
- 9.3.4.1 Sovereignty, compliance, and localized reporting to drive NOCaaS demand
- 9.3.5 SPAIN
- 9.3.5.1 Cost discipline, EU compliance, and distributed estates to drive NOCaaS market
- 9.3.6 ITALY
- 9.3.6.1 Legacy interconnects, modernization needs, and sector compliance to drive NOCaaS uptake
- 9.3.7 REST OF EUROPE
- 9.4 ASIA PACIFIC
- 9.4.1 ASIA PACIFIC: MACROECONOMIC OUTLOOK
- 9.4.2 CHINA
- 9.4.2.1 Cloud growth, 5G expansion, and strict data rules make China largest NOCaaS market in Asia Pacific
- 9.4.3 JAPAN
- 9.4.3.1 High uptime demands in telecom, manufacturing, and finance to drive Japan's NOCaaS growth
- 9.4.4 INDIA
- 9.4.4.1 Cloud expansion, fintech growth, and telecom modernization to drive India's NOCaaS market
- 9.4.5 SOUTH KOREA
- 9.4.5.1 Dense 5G/edge networks and media/gaming demand push South Korea's NOCaaS growth
- 9.4.6 AUSTRALIA & NEW ZEALAND
- 9.4.6.1 Banking, mining, and utilities spread across vast geographies to drive ANZ's NOCaaS adoption
- 9.4.7 SINGAPORE
- 9.4.7.1 Singapore's role as a financial and cloud hub to drive NOCaaS demand
- 9.4.8 REST OF ASIA PACIFIC
- 9.5 MIDDLE EAST & AFRICA
- 9.5.1 MIDDLE EAST & AFRICA: MACROECONOMIC OUTLOOK
- 9.5.2 KSA
- 9.5.2.1 Vision 2030 digitalization, cloud-first policies, and hyperscaler expansions to drive rapid NOCaaS growth in KSA
- 9.5.3 UAE
- 9.5.3.1 Cloud adoption, cyber resilience, and outcome-based managed services to drive UAE's NOCaaS demand
- 9.5.4 SOUTH AFRICA
- 9.5.4.1 Hybrid networks, data center hubs, and power reliability challenges to drive South Africa's NOCaaS adoption
- 9.5.5 REST OF MIDDLE EAST & AFRICA
- 9.6 LATIN AMERICA
- 9.6.1 LATIN AMERICA: MACROECONOMIC OUTLOOK
- 9.6.2 BRAZIL
- 9.6.2.1 Centralized NOC operations across multiple providers to drive demand
- 9.6.3 MEXICO
- 9.6.3.1 Integration of hybrid cloud and application monitoring with local field support to ensure continuous operational stability
- 9.6.4 REST OF LATIN AMERICA
10 COMPETITIVE LANDSCAPE
- 10.1 INTRODUCTION
- 10.2 KEY PLAYER STRATEGIES/RIGHT TO WIN, 2022-2025
- 10.3 MARKET SHARE ANALYSIS, 2024
- 10.3.1 MARKET RANKING ANALYSIS
- 10.4 REVENUE ANALYSIS, 2020-2024
- 10.5 BRAND/PRODUCT COMPARISON
- 10.6 COMPANY VALUATION AND FINANCIAL METRICS
- 10.7 COMPANY EVALUATION MATRIX: KEY PLAYERS, 2024
- 10.7.1 STARS
- 10.7.2 EMERGING LEADERS
- 10.7.3 PERVASIVE PLAYERS
- 10.7.4 PARTICIPANTS
- 10.7.5 COMPANY FOOTPRINT: KEY PLAYERS, 2024
- 10.7.5.1 Company footprint
- 10.7.5.2 Region footprint
- 10.7.5.3 Service type footprint
- 10.7.5.4 Support model footprint
- 10.7.5.5 Vertical footprint
- 10.8 COMPANY EVALUATION MATRIX: STARTUPS/SMES, 2024
- 10.8.1 PROGRESSIVE COMPANIES
- 10.8.2 RESPONSIVE COMPANIES
- 10.8.3 DYNAMIC COMPANIES
- 10.8.4 STARTING BLOCKS
- 10.8.5 COMPETITIVE BENCHMARKING: STARTUPS/SMES, 2024
- 10.8.5.1 Detailed list of key startups/SMEs
- 10.8.5.2 Competitive benchmarking of key startups/SMEs
- 10.9 COMPETITIVE SCENARIO
- 10.9.1 PRODUCT LAUNCHES
- 10.9.2 DEALS
11 COMPANY PROFILES
- 11.1 KEY PLAYERS
- 11.1.1 FUJITSU
- 11.1.1.1 Business overview
- 11.1.1.2 Products/Solutions/Services offered
- 11.1.1.3 Recent developments
- 11.1.1.3.1 Product launches
- 11.1.1.3.2 Deals
- 11.1.1.4 MnM view
- 11.1.1.4.1 Right to win
- 11.1.1.4.2 Strategic choices
- 11.1.1.4.3 Weaknesses and competitive threats
- 11.1.2 KASEYA
- 11.1.2.1 Business overview
- 11.1.2.2 Products/Solutions/Services offered
- 11.1.2.3 Recent developments
- 11.1.2.3.1 Product launches
- 11.1.2.4 MnM view
- 11.1.2.4.1 Right to win
- 11.1.2.4.2 Strategic choices
- 11.1.2.4.3 Weaknesses and competitive threats
- 11.1.3 SIFY TECHNOLOGIES
- 11.1.3.1 Business overview
- 11.1.3.2 Products/Solutions/Services offered
- 11.1.3.3 MnM view
- 11.1.3.3.1 Right to win
- 11.1.3.3.2 Strategic choices
- 11.1.3.3.3 Weaknesses and competitive threats
- 11.1.4 PARK PLACE TECHNOLOGIES
- 11.1.4.1 Business overview
- 11.1.4.2 Products/Solutions/Services offered
- 11.1.4.3 Recent developments
- 11.1.4.3.1 Product launches
- 11.1.4.4 MnM view
- 11.1.4.4.1 Right to win
- 11.1.4.4.2 Strategic choices
- 11.1.4.4.3 Weaknesses and competitive threats
- 11.1.5 CONNECTWISE (THOMA BRAVO)
- 11.1.5.1 Business overview
- 11.1.5.2 Products/Solutions/Services offered
- 11.1.5.3 Recent developments
- 11.1.5.3.1 Deals
- 11.1.5.4 MnM view
- 11.1.5.4.1 Right to win
- 11.1.5.4.2 Strategic choices
- 11.1.5.4.3 Weaknesses and competitive threats
- 11.1.6 INOC (A GENNX360 PORTFOLIO COMPANY)
- 11.1.6.1 Business overview
- 11.1.6.2 Products/Solutions/Services offered
- 11.1.6.3 Recent developments
- 11.1.6.3.1 Deals
- 11.1.7 IGLASS NETWORKS (20 SOUTH PARTNERS)
- 11.1.7.1 Business overview
- 11.1.7.2 Products/Solutions/Services offered
- 11.1.7.3 Recent developments
- 11.1.7.3.1 Deals
- 11.1.8 TAILWIND VOICE & DATA
- 11.1.8.1 Business overview
- 11.1.8.2 Products/Solutions/Services offered
- 11.1.9 GCX (3I INFRASTRUCTURE PLC)
- 11.1.9.1 Business overview
- 11.1.9.2 Products/Solutions/Services offered
- 11.1.9.3 Recent developments
- 11.1.9.3.1 Deals
- 11.1.10 STRUCTURED COMMUNICATION SYSTEMS
- 11.1.10.1 Business overview
- 11.1.10.2 Products/Solutions/Services offered
- 11.1.1 FUJITSU
- 11.2 OTHER KEY PLAYERS
- 11.2.1 INFRASSIST TECHNOLOGIES
- 11.2.2 EXTNOC (EXTERNETWORKS)
- 11.2.3 MISSION CONTROL NOC
- 11.2.4 WORKSENT
- 11.2.5 CHR MANAGED SERVICES
- 11.2.6 SCIENCESOFT
- 11.2.7 MICROSCAN COMMUNICATIONS
- 11.2.8 CBS (COSMOS BUSINESS SYSTEMS)
- 11.2.9 QUADRANG SYSTEMS
- 11.2.10 FUTURISM TECHNOLOGIES
- 11.2.11 EMAPTA
- 11.3 STARTUPS/SMES
- 11.3.1 NETRIO
- 11.3.2 QUANZA
- 11.3.3 CLOUDSMARTZ
- 11.3.4 HSC (HUGHES SYSTIQUE CORPORATION)
- 11.3.5 MEDHA CLOUD
- 11.3.6 TECEZE
- 11.3.7 HEX64
12 ADJACENT AND RELATED MARKETS
- 12.1 INTRODUCTION
- 12.2 DATA CENTER NETWORKING MARKET
- 12.2.1 MARKET DEFINITION
- 12.3 SOC AS A SERVICE (SOCAAS) MARKET
- 12.3.1 MARKET DEFINITION
13 APPENDIX
- 13.1 DISCUSSION GUIDE
- 13.2 KNOWLEDGESTORE: MARKETSANDMARKETS' SUBSCRIPTION PORTAL
- 13.3 CUSTOMIZATION OPTIONS
- 13.4 RELATED REPORTS
- 13.5 AUTHOR DETAILS
List of Tables
- TABLE 1 USD EXCHANGE RATES, 2020-2024
- TABLE 2 NOC AS A SERVICE MARKET: ECOSYSTEM
- TABLE 3 NORTH AMERICA: LIST OF REGULATORY BODIES, GOVERNMENT AGENCIES, AND OTHER ORGANIZATIONS
- TABLE 4 EUROPE: LIST OF REGULATORY BODIES, GOVERNMENT AGENCIES, AND OTHER ORGANIZATIONS
- TABLE 5 ASIA PACIFIC: LIST OF REGULATORY BODIES, GOVERNMENT AGENCIES, AND OTHER ORGANIZATIONS
- TABLE 6 ROW: LIST OF REGULATORY BODIES, GOVERNMENT AGENCIES, AND OTHER ORGANIZATIONS
- TABLE 7 INDICATIVE PRICING ANALYSIS, BY SERVICE TYPE, 2024
- TABLE 8 LIST OF KEY PATENTS
- TABLE 9 PORTER'S FIVE FORCES' IMPACT ON NOC AS A SERVICE MARKET
- TABLE 10 INFLUENCE OF STAKEHOLDERS ON BUYING PROCESS FOR TOP VERTICALS
- TABLE 11 KEY BUYING CRITERIA FOR TOP VERTICALS
- TABLE 12 NOC AS A SERVICE MARKET: DETAILED LIST OF KEY CONFERENCES AND EVENTS, 2025-2026
- TABLE 13 US-ADJUSTED RECIPROCAL TARIFF RATES
- TABLE 14 EXPECTED CHANGE IN PRICES AND LIKELY IMPACT ON END-USE MARKET DUE TO TARIFF IMPACT
- TABLE 15 NOC AS A SERVICE MARKET, BY SERVICE TYPE, 2019-2024 (USD MILLION)
- TABLE 16 NOC AS A SERVICE MARKET, BY SERVICE TYPE, 2025-2030 (USD MILLION)
- TABLE 17 EVENT MONITORING & MANAGEMENT: NOC AS A SERVICE MARKET, BY REGION, 2019-2024 (USD MILLION)
- TABLE 18 EVENT MONITORING & MANAGEMENT: NOC AS A SERVICE MARKET, BY REGION, 2025-2030 (USD MILLION)
- TABLE 19 INCIDENT & PROBLEM MANAGEMENT: NOC AS A SERVICE MARKET, BY REGION, 2019-2024 (USD MILLION)
- TABLE 20 INCIDENT & PROBLEM MANAGEMENT: NOC AS A SERVICE MARKET, BY REGION, 2025-2030 (USD MILLION)
- TABLE 21 SERVICE REPORTING & ANALYSIS: NOC AS A SERVICE MARKET, BY REGION, 2019-2024 (USD MILLION)
- TABLE 22 SERVICE REPORTING & ANALYSIS: NOC AS A SERVICE MARKET, BY REGION, 2025-2030 (USD MILLION)
- TABLE 23 CAPACITY & CHANGE MANAGEMENT: NOC AS A SERVICE MARKET, BY REGION, 2019-2024 (USD MILLION)
- TABLE 24 CAPACITY & CHANGE MANAGEMENT: NOC AS A SERVICE MARKET, BY REGION, 2025-2030 (USD MILLION)
- TABLE 25 OTHER SERVICE TYPES: NOC AS A SERVICE MARKET, BY REGION, 2019-2024 (USD MILLION)
- TABLE 26 OTHER SERVICE TYPES: NOC AS A SERVICE MARKET, BY REGION, 2025-2030 (USD MILLION)
- TABLE 27 NOC AS A SERVICE MARKET, BY SUPPORT MODEL, 2019-2024 (USD MILLION)
- TABLE 28 NOC AS A SERVICE MARKET, BY SUPPORT MODEL, 2025-2030 (USD MILLION)
- TABLE 29 ONSITE: NOC AS A SERVICE MARKET, BY REGION, 2019-2024 (USD MILLION)
- TABLE 30 ONSITE: NOC AS A SERVICE MARKET, BY REGION, 2025-2030 (USD MILLION)
- TABLE 31 OFFSITE: NOC AS A SERVICE MARKET, BY REGION, 2019-2024 (USD MILLION)
- TABLE 32 OFFSITE: NOC AS A SERVICE MARKET, BY REGION, 2025-2030 (USD MILLION)
- TABLE 33 HYBRID: NOC AS A SERVICE MARKET, BY REGION, 2019-2024 (USD MILLION)
- TABLE 34 HYBRID: NOC AS A SERVICE MARKET, BY REGION, 2025-2030 (USD MILLION)
- TABLE 35 NOC AS A SERVICE MARKET, BY VERTICAL, 2019-2024 (USD MILLION)
- TABLE 36 NOC AS A SERVICE MARKET, BY VERTICAL, 2025-2030 (USD MILLION)
- TABLE 37 BFSI: NOC AS A SERVICE MARKET, BY REGION, 2019-2024 (USD MILLION)
- TABLE 38 BFSI: NOC AS A SERVICE MARKET, BY REGION, 2025-2030 (USD MILLION)
- TABLE 39 HEALTHCARE & LIFE SCIENCES: NOC AS A SERVICE MARKET, BY REGION, 2019-2024 (USD MILLION)
- TABLE 40 HEALTHCARE & LIFE SCIENCES: NOC AS A SERVICE MARKET, BY REGION, 2025-2030 (USD MILLION)
- TABLE 41 GOVERNMENT & PUBLIC SECTOR: NOC AS A SERVICE MARKET, BY REGION, 2019-2024 (USD MILLION)
- TABLE 42 GOVERNMENT & PUBLIC SECTOR: NOC AS A SERVICE MARKET, BY REGION, 2025-2030 (USD MILLION)
- TABLE 43 TELECOM & CSVS: NOC AS A SERVICE MARKET, BY REGION, 2019-2024 (USD MILLION)
- TABLE 44 TELECOM & CSVS: NOC AS A SERVICE MARKET, BY REGION, 2025-2030 (USD MILLION)
- TABLE 45 IT & ITES: NOC AS A SERVICE MARKET, BY REGION, 2019-2024 (USD MILLION)
- TABLE 46 IT & ITES: NOC AS A SERVICE MARKET, BY REGION, 2025-2030 (USD MILLION)
- TABLE 47 RETAIL & E-COMMERCE: NOC AS A SERVICE MARKET, BY REGION, 2019-2024 (USD MILLION)
- TABLE 48 RETAIL & E-COMMERCE: NOC AS A SERVICE MARKET, BY REGION, 2025-2030 (USD MILLION)
- TABLE 49 ENERGY & UTILITIES: NOC AS A SERVICE MARKET, BY REGION, 2019-2024 (USD MILLION)
- TABLE 50 ENERGY & UTILITIES: NOC AS A SERVICE MARKET, BY REGION, 2025-2030 (USD MILLION)
- TABLE 51 TRANSPORTATION & LOGISTICS: NOC AS A SERVICE MARKET, BY REGION, 2019-2024 (USD MILLION)
- TABLE 52 TRANSPORTATION & LOGISTICS: NOC AS A SERVICE MARKET, BY REGION, 2025-2030 (USD MILLION)
- TABLE 53 OTHER VERTICALS: NOC AS A SERVICE MARKET, BY REGION, 2019-2024 (USD MILLION)
- TABLE 54 OTHER VERTICALS: NOC AS A SERVICE MARKET, BY REGION, 2025-2030 (USD MILLION)
- TABLE 55 NOC AS A SERVICE MARKET, BY REGION, 2019-2024 (USD MILLION)
- TABLE 56 NOC AS A SERVICE MARKET, BY REGION, 2025-2030 (USD MILLION)
- TABLE 57 NORTH AMERICA: NOC AS A SERVICE MARKET, BY SERVICE TYPE, 2019-2024 (USD MILLION)
- TABLE 58 NORTH AMERICA: NOC AS A SERVICE MARKET, BY SERVICE TYPE, 2025-2030 (USD MILLION)
- TABLE 59 NORTH AMERICA: NOC AS A SERVICE MARKET, BY SUPPORT MODEL, 2019-2024 (USD MILLION)
- TABLE 60 NORTH AMERICA: NOC AS A SERVICE MARKET, BY SUPPORT MODEL, 2025-2030 (USD MILLION)
- TABLE 61 NORTH AMERICA: NOC AS A SERVICE MARKET, BY VERTICAL, 2019-2024 (USD MILLION)
- TABLE 62 NORTH AMERICA: NOC AS A SERVICE MARKET, BY VERTICAL, 2025-2030 (USD MILLION)
- TABLE 63 NORTH AMERICA: NOC AS A SERVICE MARKET, BY COUNTRY, 2019-2024 (USD MILLION)
- TABLE 64 NORTH AMERICA: NOC AS A SERVICE MARKET, BY COUNTRY, 2025-2030 (USD MILLION)
- TABLE 65 US: NOC AS A SERVICE MARKET, BY SERVICE TYPE, 2019-2024 (USD MILLION)
- TABLE 66 US: NOC AS A SERVICE MARKET, BY SERVICE TYPE, 2025-2030 (USD MILLION)
- TABLE 67 US: NOC AS A SERVICE MARKET, BY SUPPORT MODEL, 2019-2024 (USD MILLION)
- TABLE 68 US: NOC AS A SERVICE MARKET, BY SUPPORT MODEL, 2025-2030 (USD MILLION)
- TABLE 69 US: NOC AS A SERVICE MARKET, BY VERTICAL, 2019-2024 (USD MILLION)
- TABLE 70 US: NOC AS A SERVICE MARKET, BY VERTICAL, 2025-2030 (USD MILLION)
- TABLE 71 CANADA: NOC AS A SERVICE MARKET, BY SERVICE TYPE, 2019-2024 (USD MILLION)
- TABLE 72 CANADA: NOC AS A SERVICE MARKET, BY SERVICE TYPE, 2025-2030 (USD MILLION)
- TABLE 73 CANADA: NOC AS A SERVICE MARKET, BY SUPPORT MODEL, 2019-2024 (USD MILLION)
- TABLE 74 CANADA: NOC AS A SERVICE MARKET, BY SUPPORT MODEL, 2025-2030 (USD MILLION)
- TABLE 75 CANADA: NOC AS A SERVICE MARKET, BY VERTICAL, 2019-2024 (USD MILLION)
- TABLE 76 CANADA: NOC AS A SERVICE MARKET, BY VERTICAL, 2025-2030 (USD MILLION)
- TABLE 77 EUROPE: NOC AS A SERVICE MARKET, BY SERVICE TYPE, 2019-2024 (USD MILLION)
- TABLE 78 EUROPE: NOC AS A SERVICE MARKET, BY SERVICE TYPE, 2025-2030 (USD MILLION)
- TABLE 79 EUROPE: NOC AS A SERVICE MARKET, BY SUPPORT MODEL, 2019-2024 (USD MILLION)
- TABLE 80 EUROPE: NOC AS A SERVICE MARKET, BY SUPPORT MODEL, 2025-2030 (USD MILLION)
- TABLE 81 EUROPE: NOC AS A SERVICE MARKET, BY VERTICAL, 2019-2024 (USD MILLION)
- TABLE 82 EUROPE: NOC AS A SERVICE MARKET, BY VERTICAL, 2025-2030 (USD MILLION)
- TABLE 83 EUROPE: NOC AS A SERVICE MARKET, BY COUNTRY, 2019-2024 (USD MILLION)
- TABLE 84 EUROPE: NOC AS A SERVICE MARKET, BY COUNTRY, 2025-2030 (USD MILLION)
- TABLE 85 GERMANY: NOC AS A SERVICE MARKET, BY SERVICE TYPE, 2019-2024 (USD MILLION)
- TABLE 86 GERMANY: NOC AS A SERVICE MARKET, BY SERVICE TYPE, 2025-2030 (USD MILLION)
- TABLE 87 GERMANY: NOC AS A SERVICE MARKET, BY SUPPORT MODEL, 2019-2024 (USD MILLION)
- TABLE 88 GERMANY: NOC AS A SERVICE MARKET, BY SUPPORT MODEL, 2025-2030 (USD MILLION)
- TABLE 89 GERMANY: NOC AS A SERVICE MARKET, BY VERTICAL, 2019-2024 (USD MILLION)
- TABLE 90 GERMANY: NOC AS A SERVICE MARKET, BY VERTICAL, 2025-2030 (USD MILLION)
- TABLE 91 UK: NOC AS A SERVICE MARKET, BY SERVICE TYPE, 2019-2024 (USD MILLION)
- TABLE 92 UK: NOC AS A SERVICE MARKET, BY SERVICE TYPE, 2025-2030 (USD MILLION)
- TABLE 93 UK: NOC AS A SERVICE MARKET, BY SUPPORT MODEL, 2019-2024 (USD MILLION)
- TABLE 94 UK: NOC AS A SERVICE MARKET, BY SUPPORT MODEL, 2025-2030 (USD MILLION)
- TABLE 95 UK: NOC AS A SERVICE MARKET, BY VERTICAL, 2019-2024 (USD MILLION)
- TABLE 96 UK: NOC AS A SERVICE MARKET, BY VERTICAL, 2025-2030 (USD MILLION)
- TABLE 97 ASIA PACIFIC: NOC AS A SERVICE MARKET, BY SERVICE TYPE, 2019-2024 (USD MILLION)
- TABLE 98 ASIA PACIFIC: NOC AS A SERVICE MARKET, BY SERVICE TYPE, 2025-2030 (USD MILLION)
- TABLE 99 ASIA PACIFIC: NOC AS A SERVICE MARKET, BY SUPPORT MODEL, 2019-2024 (USD MILLION)
- TABLE 100 ASIA PACIFIC: NOC AS A SERVICE MARKET, BY SUPPORT MODEL, 2025-2030 (USD MILLION)
- TABLE 101 ASIA PACIFIC: NOC AS A SERVICE MARKET, BY VERTICAL, 2019-2024 (USD MILLION)
- TABLE 102 ASIA PACIFIC: NOC AS A SERVICE MARKET, BY VERTICAL, 2025-2030 (USD MILLION)
- TABLE 103 ASIA PACIFIC: NOC AS A SERVICE MARKET, BY COUNTRY, 2019-2024 (USD MILLION)
- TABLE 104 ASIA PACIFIC: NOC AS A SERVICE MARKET, BY COUNTRY, 2025-2030 (USD MILLION)
- TABLE 105 CHINA: NOC AS A SERVICE MARKET, BY SERVICE TYPE, 2019-2024 (USD MILLION)
- TABLE 106 CHINA: NOC AS A SERVICE MARKET, BY SERVICE TYPE, 2025-2030 (USD MILLION)
- TABLE 107 CHINA: NOC AS A SERVICE MARKET, BY SUPPORT MODEL, 2019-2024 (USD MILLION)
- TABLE 108 CHINA: NOC AS A SERVICE MARKET, BY SUPPORT MODEL, 2025-2030 (USD MILLION)
- TABLE 109 CHINA: NOC AS A SERVICE MARKET, BY VERTICAL, 2019-2024 (USD MILLION)
- TABLE 110 CHINA: NOC AS A SERVICE MARKET, BY VERTICAL, 2025-2030 (USD MILLION)
- TABLE 111 MIDDLE EAST & AFRICA: NOC AS A SERVICE MARKET, BY SERVICE TYPE, 2019-2024 (USD MILLION)
- TABLE 112 MIDDLE EAST & AFRICA: NOC AS A SERVICE MARKET, BY SERVICE TYPE, 2025-2030 (USD MILLION)
- TABLE 113 MIDDLE EAST & AFRICA: NOC AS A SERVICE MARKET, BY SUPPORT MODEL, 2019-2024 (USD MILLION)
- TABLE 114 MIDDLE EAST & AFRICA: NOC AS A SERVICE MARKET, BY SUPPORT MODEL, 2025-2030 (USD MILLION)
- TABLE 115 MIDDLE EAST & AFRICA: NOC AS A SERVICE MARKET, BY VERTICAL, 2019-2024 (USD MILLION)
- TABLE 116 MIDDLE EAST & AFRICA: NOC AS A SERVICE MARKET, BY VERTICAL, 2025-2030 (USD MILLION)
- TABLE 117 MIDDLE EAST & AFRICA: NOC AS A SERVICE MARKET, BY COUNTRY, 2019-2024 (USD MILLION)
- TABLE 118 MIDDLE EAST & AFRICA: NOC AS A SERVICE MARKET, BY COUNTRY, 2025-2030 (USD MILLION)
- TABLE 119 KSA: NOC AS A SERVICE MARKET, BY SERVICE TYPE, 2019-2024 (USD MILLION)
- TABLE 120 KSA: NOC AS A SERVICE MARKET, BY SERVICE TYPE, 2025-2030 (USD MILLION)
- TABLE 121 KSA: NOC AS A SERVICE MARKET, BY SUPPORT MODEL, 2019-2024 (USD MILLION)
- TABLE 122 KSA: NOC AS A SERVICE MARKET, BY SUPPORT MODEL, 2025-2030 (USD MILLION)
- TABLE 123 KSA: NOC AS A SERVICE MARKET, BY VERTICAL, 2019-2024 (USD MILLION)
- TABLE 124 KSA: NOC AS A SERVICE MARKET, BY VERTICAL, 2025-2030 (USD MILLION)
- TABLE 125 LATIN AMERICA: NOC AS A SERVICE MARKET, BY SERVICE TYPE, 2019-2024 (USD MILLION)
- TABLE 126 LATIN AMERICA: NOC AS A SERVICE MARKET, BY SERVICE TYPE, 2025-2030 (USD MILLION)
- TABLE 127 LATIN AMERICA: NOC AS A SERVICE MARKET, BY SUPPORT MODEL, 2019-2024 (USD MILLION)
- TABLE 128 LATIN AMERICA: NOC AS A SERVICE MARKET, BY SUPPORT MODEL, 2025-2030 (USD MILLION)
- TABLE 129 LATIN AMERICA: NOC AS A SERVICE MARKET, BY VERTICAL, 2019-2024 (USD MILLION)
- TABLE 130 LATIN AMERICA: NOC AS A SERVICE MARKET, BY VERTICAL, 2025-2030 (USD MILLION)
- TABLE 131 LATIN AMERICA: NOC AS A SERVICE MARKET, BY COUNTRY, 2019-2024 (USD MILLION)
- TABLE 132 LATIN AMERICA: NOC AS A SERVICE MARKET, BY COUNTRY, 2025-2030 (USD MILLION)
- TABLE 133 BRAZIL: NOC AS A SERVICE MARKET, BY SERVICE TYPE, 2019-2024 (USD MILLION)
- TABLE 134 BRAZIL: NOC AS A SERVICE MARKET, BY SERVICE TYPE, 2025-2030 (USD MILLION)
- TABLE 135 BRAZIL: NOC AS A SERVICE MARKET, BY SUPPORT MODEL, 2019-2024 (USD MILLION)
- TABLE 136 BRAZIL: NOC AS A SERVICE MARKET, BY SUPPORT MODEL, 2025-2030 (USD MILLION)
- TABLE 137 BRAZIL: NOC AS A SERVICE MARKET, BY VERTICAL, 2019-2024 (USD MILLION)
- TABLE 138 BRAZIL: NOC AS A SERVICE MARKET, BY VERTICAL, 2025-2030 (USD MILLION)
- TABLE 139 OVERVIEW OF STRATEGIES DEPLOYED BY KEY NOC AS A SERVICE MARKET PLAYERS, JANUARY 2022-JULY 2025
- TABLE 140 NOC AS A SERVICE MARKET: DEGREE OF COMPETITION
- TABLE 141 NOC AS A SERVICE MARKET: REGION FOOTPRINT
- TABLE 142 NOC AS A SERVICE MARKET: SERVICE TYPE FOOTPRINT
- TABLE 143 NOC AS A SERVICE MARKET: SUPPORT MODEL FOOTPRINT
- TABLE 144 NOC AS A SERVICE MARKET: VERTICAL FOOTPRINT
- TABLE 145 NOC AS A SERVICE MARKET: LIST OF KEY STARTUPS/SMES
- TABLE 146 NOC AS A SERVICE MARKET: COMPETITIVE BENCHMARKING OF KEY STARTUPS/SMES
- TABLE 147 NOC AS A SERVICE MARKET: PRODUCT LAUNCHES, SEPTEMBER 2024-JUNE 2025
- TABLE 148 NOC AS A SERVICE MARKET: DEALS, SEPTEMBER 2022-FEBRUARY 2024
- TABLE 149 FUJITSU: COMPANY OVERVIEW
- TABLE 150 FUJITSU: PRODUCTS/SOLUTIONS/SERVICES OFFERED
- TABLE 151 FUJITSU: PRODUCT LAUNCHES
- TABLE 152 FUJITSU: DEALS
- TABLE 153 KASEYA: COMPANY OVERVIEW
- TABLE 154 KASEYA: PRODUCTS/SOLUTIONS/SERVICES OFFERED
- TABLE 155 KASEYA: PRODUCT LAUNCHES
- TABLE 156 SIFY TECHNOLOGIES: COMPANY OVERVIEW
- TABLE 157 SIFY TECHNOLOGIES: PRODUCTS/SOLUTIONS/SERVICES OFFERED
- TABLE 158 PARK PLACE TECHNOLOGIES: COMPANY OVERVIEW
- TABLE 159 PARK PLACE TECHNOLOGIES: PRODUCTS/SOLUTIONS/SERVICES OFFERED
- TABLE 160 PARK PLACE TECHNOLOGIES: PRODUCT LAUNCHES
- TABLE 161 CONNECTWISE: COMPANY OVERVIEW
- TABLE 162 CONNECTWISE: PRODUCTS/SOLUTIONS/SERVICES OFFERED
- TABLE 163 CONNECTWISE: DEALS
- TABLE 164 INOC: COMPANY OVERVIEW
- TABLE 165 INOC: PRODUCTS/SOLUTIONS/SERVICES OFFERED
- TABLE 166 INOC: DEALS
- TABLE 167 IGLASS NETWORKS: COMPANY OVERVIEW
- TABLE 168 IGLASS NETWORKS: PRODUCTS/SOLUTIONS/SERVICES OFFERED
- TABLE 169 IGLASS NETWORKS: DEALS
- TABLE 170 TAILWIND VOICE & DATA: COMPANY OVERVIEW
- TABLE 171 TAILWIND VOICE & DATA: PRODUCTS/SOLUTIONS/SERVICES OFFERED
- TABLE 172 GCX: COMPANY OVERVIEW
- TABLE 173 GCX: PRODUCTS/SOLUTIONS/SERVICES OFFERED
- TABLE 174 GCX: DEALS
- TABLE 175 STRUCTURED COMMUNICATION SYSTEMS: COMPANY OVERVIEW
- TABLE 176 STRUCTURED COMMUNICATION SYSTEMS: PRODUCTS/SOLUTIONS/ SERVICES OFFERED
- TABLE 177 DATA CENTER NETWORKING MARKET, BY OFFERING, 2019-2023 (USD MILLION)
- TABLE 178 DATA CENTER NETWORKING MARKET, BY OFFERING, 2024-2029 (USD MILLION)
- TABLE 179 DATA CENTER NETWORKING MARKET, BY HARDWARE, 2019-2023 (USD MILLION)
- TABLE 180 DATA CENTER NETWORKING MARKET, BY HARDWARE, 2024-2029 (USD MILLION)
- TABLE 181 DATA CENTER NETWORKING MARKET, BY SOFTWARE, 2019-2023 (USD MILLION)
- TABLE 182 DATA CENTER NETWORKING MARKET, BY SOFTWARE, 2024-2029 (USD MILLION)
- TABLE 183 DATA CENTER NETWORKING MARKET, BY SERVICE, 2019-2023 (USD MILLION)
- TABLE 184 DATA CENTER NETWORKING MARKET, BY SERVICE, 2024-2029 (USD MILLION)
- TABLE 185 DATA CENTER NETWORKING MARKET, BY END USER, 2019-2023 (USD MILLION)
- TABLE 186 DATA CENTER NETWORKING MARKET, BY END USER, 2024-2029 (USD MILLION)
- TABLE 187 ENTERPRISES: DATA CENTER NETWORKING MARKET, BY REGION, 2019-2023 (USD MILLION)
- TABLE 188 ENTERPRISES: DATA CENTER NETWORKING MARKET, BY REGION, 2024-2029 (USD MILLION)
- TABLE 189 TELECOM SERVICE PROVIDERS: DATA CENTER NETWORKING MARKET, BY REGION, 2019-2023 (USD MILLION)
- TABLE 190 TELECOM SERVICE PROVIDERS: DATA CENTER NETWORKING MARKET, BY REGION, 2024-2029 (USD MILLION)
- TABLE 191 CLOUD SERVICE PROVIDERS: DATA CENTER NETWORKING MARKET, BY REGION, 2019-2023 (USD MILLION)
- TABLE 192 CLOUD SERVICE PROVIDERS: DATA CENTER NETWORKING MARKET, BY REGION, 2024-2029 (USD MILLION)
- TABLE 193 DATA CENTER NETWORKING MARKET, BY REGION, 2019-2023 (USD MILLION)
- TABLE 194 DATA CENTER NETWORKING MARKET, BY REGION, 2024-2029 (USD MILLION)
- TABLE 195 SOC-AS-A-SERVICE MARKET, BY SERVICE TYPE, 2018-2023 (USD MILLION)
- TABLE 196 SOC-AS-A-SERVICE MARKET, BY SERVICE TYPE, 2024-2030 (USD MILLION)
- TABLE 197 MANAGED SIEM & LOG MANAGEMENT: SOC-AS-A-SERVICE MARKET, BY REGION, 2018-2023 (USD MILLION)
- TABLE 198 MANAGED SIEM & LOG MANAGEMENT: SOC-AS-A-SERVICE MARKET, BY REGION, 2024-2030 (USD MILLION)
- TABLE 199 VULNERABILITY SCANNING & ASSESSMENT: SOC-AS-A-SERVICE MARKET, BY REGION, 2018-2023 (USD MILLION)
- TABLE 200 VULNERABILITY SCANNING & ASSESSMENT: SOC-AS-A-SERVICE MARKET, BY REGION, 2024-2030 (USD MILLION)
- TABLE 201 THREAT DETECTION & REMEDIATION: SOC-AS-A-SERVICE MARKET, BY REGION, 2018-2023 (USD MILLION)
- TABLE 202 THREAT DETECTION & REMEDIATION: SOC-AS-A-SERVICE MARKET, BY REGION, 2024-2030 (USD MILLION)
- TABLE 203 INCIDENT RESPONSE SERVICES: SOC-AS-A-SERVICE MARKET, BY REGION, 2018-2023 (USD MILLION)
- TABLE 204 INCIDENT RESPONSE SERVICES: SOC-AS-A-SERVICE MARKET, BY REGION, 2024-2030 (USD MILLION)
- TABLE 205 GOVERNANCE, RISK, & COMPLIANCE: SOC-AS-A-SERVICE MARKET, BY REGION, 2018-2023 (USD MILLION)
- TABLE 206 GOVERNANCE, RISK, & COMPLIANCE: SOC-AS-A-SERVICE MARKET, BY REGION, 2024-2030 (USD MILLION)
- TABLE 207 SOC-AS-A-SERVICE MARKET, BY OFFERING, 2018-2023 (USD MILLION)
- TABLE 208 SOC-AS-A-SERVICE MARKET, BY OFFERING, 2024-2030 (USD MILLION)
- TABLE 209 FULLY MANAGED: SOC-AS-A-SERVICE MARKET, BY REGION, 2018-2023 (USD MILLION)
- TABLE 210 FULLY MANAGED: SOC-AS-A-SERVICE MARKET, BY REGION, 2024-2030 (USD MILLION)
- TABLE 211 CO-MANAGED: SOC-AS-A-SERVICE MARKET, BY REGION, 2018-2023 (USD MILLION)
- TABLE 212 CO-MANAGED: SOC-AS-A-SERVICE MARKET, BY REGION, 2024-2030 (USD MILLION)
- TABLE 213 SOC-AS-A-SERVICE MARKET, BY ORGANIZATION SIZE, 2018-2023 (USD MILLION)
- TABLE 214 SOC-AS-A-SERVICE MARKET, BY ORGANIZATION SIZE, 2024-2030 (USD MILLION)
- TABLE 215 SMALL AND MEDIUM-SIZED ENTERPRISES: SOC-AS-A-SERVICE MARKET, BY REGION, 2018-2023 (USD MILLION)
- TABLE 216 SMALL AND MEDIUM-SIZED ENTERPRISES: SOC-AS-A-SERVICE MARKET, BY REGION, 2024-2030 (USD MILLION)
- TABLE 217 LARGE ENTERPRISES: SOC-AS-A-SERVICE MARKET, BY REGION, 2018-2023 (USD MILLION)
- TABLE 218 LARGE ENTERPRISES: SOC-AS-A-SERVICE MARKET, BY REGION, 2024-2030 (USD MILLION)
- TABLE 219 SOC-AS-A-SERVICE MARKET, BY SECURITY TYPE, 2018-2023 (USD MILLION)
- TABLE 220 SOC-AS-A-SERVICE MARKET, BY SECURITY TYPE, 2024-2030 (USD MILLION)
- TABLE 221 NETWORK SECURITY: SOC-AS-A-SERVICE MARKET, BY REGION, 2018-2023 (USD MILLION)
- TABLE 222 NETWORK SECURITY: SOC-AS-A-SERVICE MARKET, BY REGION, 2024-2030 (USD MILLION)
- TABLE 223 CLOUD SECURITY: SOC-AS-A-SERVICE MARKET, BY REGION, 2018-2023 (USD MILLION)
- TABLE 224 CLOUD SECURITY: SOC-AS-A-SERVICE MARKET, BY REGION, 2024-2030 (USD MILLION)
- TABLE 225 ENDPOINT SECURITY: SOC-AS-A-SERVICE MARKET, BY REGION, 2018-2023 (USD MILLION)
- TABLE 226 ENDPOINT SECURITY: SOC-AS-A-SERVICE MARKET, BY REGION, 2024-2030 (USD MILLION)
- TABLE 227 APPLICATION SECURITY: SOC-AS-A-SERVICE MARKET, BY REGION, 2018-2023 (USD MILLION)
- TABLE 228 APPLICATION SECURITY: SOC-AS-A-SERVICE MARKET, BY REGION, 2024-2030 (USD MILLION)
- TABLE 229 SOC-AS-A-SERVICE MARKET, BY SECTOR, 2018-2023 (USD MILLION)
- TABLE 230 SOC-AS-A-SERVICE MARKET, BY SECTOR, 2024-2030 (USD MILLION)
- TABLE 231 PUBLIC SECTOR: SOC-AS-A-SERVICE MARKET, BY REGION, 2018-2023 (USD MILLION)
- TABLE 232 PUBLIC SECTOR: SOC-AS-A-SERVICE MARKET, BY REGION, 2024-2030 (USD MILLION)
- TABLE 233 PRIVATE SECTOR: SOC-AS-A-SERVICE MARKET, BY REGION, 2018-2023 (USD MILLION)
- TABLE 234 PRIVATE SECTOR: SOC-AS-A-SERVICE MARKET, BY REGION, 2024-2030 (USD MILLION)
- TABLE 235 SOC-AS-A-SERVICE MARKET, BY VERTICAL, 2018-2023 (USD MILLION)
- TABLE 236 SOC-AS-A-SERVICE MARKET, BY VERTICAL, 2024-2030 (USD MILLION)
- TABLE 237 BFSI: SOC-AS-A-SERVICE MARKET, BY REGION, 2018-2023 (USD MILLION)
- TABLE 238 BFSI: SOC-AS-A-SERVICE MARKET, BY REGION, 2024-2030 (USD MILLION)
- TABLE 239 HEALTHCARE: SOC-AS-A-SERVICE MARKET, BY REGION, 2018-2023 (USD MILLION)
- TABLE 240 HEALTHCARE: SOC-AS-A-SERVICE MARKET, BY REGION, 2024-2030 (USD MILLION)
- TABLE 241 GOVERNMENT: SOC-AS-A-SERVICE MARKET, BY REGION, 2018-2023 (USD MILLION)
- TABLE 242 GOVERNMENT: SOC-AS-A-SERVICE MARKET, BY REGION, 2024-2030 (USD MILLION)
- TABLE 243 MANUFACTURING: SOC-AS-A-SERVICE MARKET, BY REGION, 2018-2023 (USD MILLION)
- TABLE 244 MANUFACTURING: SOC-AS-A-SERVICE MARKET, BY REGION, 2024-2030 (USD MILLION)
- TABLE 245 ENERGY & UTILITIES: SOC-AS-A-SERVICE MARKET, BY REGION, 2018-2023 (USD MILLION)
- TABLE 246 ENERGY & UTILITIES: SOC-AS-A-SERVICE MARKET, BY REGION, 2024-2030 (USD MILLION)
- TABLE 247 IT & ITES: SOC-AS-A-SERVICE MARKET, BY REGION, 2018-2023 (USD MILLION)
- TABLE 248 IT & ITES: SOC-AS-A-SERVICE MARKET, BY REGION, 2024-2030 (USD MILLION)
- TABLE 249 TELECOMMUNICATIONS: SOC-AS-A-SERVICE MARKET, BY REGION, 2018-2023 (USD MILLION)
- TABLE 250 TELECOMMUNICATIONS: SOC-AS-A-SERVICE MARKET, BY REGION, 2024-2030 (USD MILLION)
- TABLE 251 TRANSPORTATION & LOGISTICS: SOC-AS-A-SERVICE MARKET, BY REGION, 2018-2023 (USD MILLION)
- TABLE 252 TRANSPORTATION & LOGISTICS: SOC-AS-A-SERVICE MARKET, BY REGION, 2024-2030 (USD MILLION)
- TABLE 253 SOC-AS-A-SERVICE MARKET, BY REGION, 2018-2023 (USD MILLION)
- TABLE 254 SOC-AS-A-SERVICE MARKET, BY REGION, 2024-2030 (USD MILLION)
List of Figures
- FIGURE 1 NOC AS A SERVICE MARKET: RESEARCH DESIGN
- FIGURE 2 BREAKDOWN OF PRIMARY INTERVIEWS, BY COMPANY TYPE, DESIGNATION, AND REGION
- FIGURE 3 NOC AS A SERVICE MARKET: TOP-DOWN AND BOTTOM-UP APPROACHES
- FIGURE 4 MARKET SIZE ESTIMATION METHODOLOGY-APPROACH 1 (SUPPLY SIDE): REVENUE OF VENDORS IN NOC AS A SERVICE MARKET
- FIGURE 5 MARKET SIZE ESTIMATION METHODOLOGY-APPROACH 2 (DEMAND SIDE): NOC AS A SERVICE MARKET
- FIGURE 6 MARKET SIZE ESTIMATION METHODOLOGY: DEMAND-SIDE ANALYSIS
- FIGURE 7 BOTTOM-UP APPROACH USING COMPANY REVENUES
- FIGURE 8 NOC AS A SERVICE MARKET: DATA TRIANGULATION
- FIGURE 9 NOC AS A SERVICE MARKET, 2023-2030 (USD MILLION)
- FIGURE 10 NOC AS A SERVICE MARKET, BY REGION (2025)
- FIGURE 11 RISING COMPLEXITY OF HYBRID IT ENVIRONMENTS AND GROWING NEED FOR 24X7 AUTOMATED NETWORK MONITORING AND INCIDENT MANAGEMENT TO DRIVE MARKET
- FIGURE 12 EVENT MONITORING & MANAGEMENT SEGMENT TO LEAD MARKET DURING FORECAST PERIOD
- FIGURE 13 ONSITE SEGMENT TO DOMINATE MARKET DURING FORECAST PERIOD
- FIGURE 14 BFSI SEGMENT TO ACCOUNT FOR LARGEST MARKET SHARE DURING FORECAST PERIOD
- FIGURE 15 EVENT MONITORING & MANAGEMENT AND ONSITE SEGMENTS TO ACCOUNT FOR SIGNIFICANT MARKET SHARES IN 2025
- FIGURE 16 NOC AS A SERVICE MARKET: DRIVERS, RESTRAINTS, OPPORTUNITIES, AND CHALLENGES
- FIGURE 17 EVOLUTION: NOC AS A SERVICE
- FIGURE 18 KEY PLAYERS IN NOC AS A SERVICE MARKET ECOSYSTEM
- FIGURE 19 NOC AS A SERVICE MARKET: SUPPLY CHAIN ANALYSIS
- FIGURE 20 INDICATIVE PRICING ANALYSIS, BY SERVICE TYPE, 2024
- FIGURE 21 LIST OF KEY PATENTS FOR NOC AS A SERVICE, 2014-2025
- FIGURE 22 NOC AS A SERVICE MARKET: PORTER'S FIVE FORCES ANALYSIS
- FIGURE 23 NOC AS A SERVICE MARKET: DISRUPTIONS IMPACTING CUSTOMER BUSINESS
- FIGURE 24 INFLUENCE OF STAKEHOLDERS ON BUYING PROCESS FOR TOP VERTICALS
- FIGURE 25 KEY BUYING CRITERIA FOR TOP VERTICALS
- FIGURE 26 INVESTMENT & FUNDING SCENARIO, 2019-2024 (USD MILLION)
- FIGURE 27 MARKET POTENTIAL OF GENERATIVE AI IN ENHANCING NOC AS A SERVICE
- FIGURE 28 GENERATIVE AI BEST PRACTICES ACROSS MAJOR INDUSTRIES
- FIGURE 29 INCIDENT & PROBLEM MANAGEMENT SEGMENT TO GROW AT HIGHEST CAGR DURING FORECAST PERIOD
- FIGURE 30 HYBRID TO GROW AT HIGHEST CAGR DURING FORECAST PERIOD
- FIGURE 31 HEALTHCARE & LIFE SCIENCES SEGMENT TO GROW AT HIGHEST CAGR DURING FORECAST PERIOD
- FIGURE 32 NORTH AMERICA: NOC AS A SERVICE MARKET SNAPSHOT
- FIGURE 33 ASIA PACIFIC: NOC AS A SERVICE MARKET SNAPSHOT
- FIGURE 34 SHARES OF LEADING COMPANIES IN NOC AS A SERVICE MARKET, 2024
- FIGURE 35 NOC AS A SERVICE MARKET: RANKING ANALYSIS OF TOP FIVE PLAYERS
- FIGURE 36 REVENUE ANALYSIS OF KEY PLAYERS IN NOC AS A SERVICE MARKET, 2020-2024 (USD MILLION)
- FIGURE 37 NOC AS A SERVICE MARKET: BRAND/PRODUCT COMPARISON
- FIGURE 38 COMPANY VALUATION: 2025
- FIGURE 39 NOC AS A SERVICE MARKET: COMPANY EVALUATION MATRIX (KEY PLAYERS), 2024
- FIGURE 40 NOC AS A SERVICE MARKET: COMPANY FOOTPRINT
- FIGURE 41 NOC AS A SERVICE MARKET: COMPANY EVALUATION MATRIX (STARTUPS/SMES), 2024
- FIGURE 42 FUJITSU: COMPANY SNAPSHOT
- FIGURE 43 SIFY TECHNOLOGIES: COMPANY SNAPSHOT
 現場服務管理市場:按組件、應用、最終用戶產業、部署類型和組織規模分類-2026-2032年全球市場預測
 2026年全球現場服務管理解決方案市場報告
 2026-2030年全球現場服務管理(FSM)軟體市場2026年全球現場服務管理市場報告
 現場服務管理市場分析及預測(至2035年):依類型、產品類型、服務、技術、組件、應用、部署類型、最終用戶、模組及功能分類
 全球現場服務管理市場規模、佔有率、趨勢和成長分析報告(2026-2034年)
 現場服務管理市場 - 全球產業規模、佔有率、趨勢、機會及預測(按組件、部署模式、公司規模、產業垂直領域、地區和競爭格局分類,2021-2031 年)
 現場服務管理 (FSM) 市場規模、佔有率和成長分析(按軟體和服務類型、部署類型和地區分類)—2026-2033 年行業預測
 現場服務管理市場機會、成長促進因素、產業趨勢分析及預測(2026-2035年)
 現場服務管理市場依產品、部署模式、組織規模、產業及地區分類-預測至2030年