


 |
市場調查報告書
商品編碼
1777931
B2B付款市場:2025-2030年B2B Payments Market: 2025-2030 |
||||||
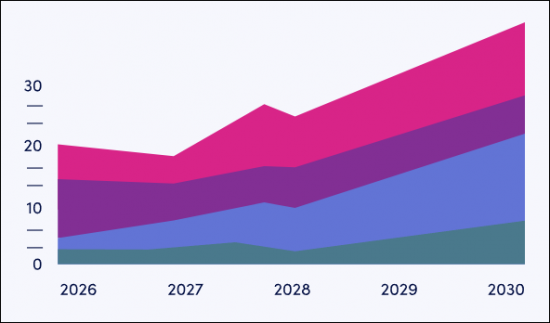
跨境貿易蓬勃發展,儘管受到關稅影響,但預計到2030年,跨境B2B支付規模仍將達180億美元。
| 主要統計 | |
|---|---|
| 2025年的整體交易額: | 1,870億美元 |
| 2030年的整體交易額: | 2,240億美元 |
| 從2025年~2030年的市場成長率: | 20% |
| 預測期間: | 2025-2030年 |
本研究資料包對 B2B 支付市場進行了全面而深入的分析,幫助從 B2B 支付平台提供者到監管機構和銀行等利害關係人了解未來成長、關鍵趨勢和競爭格局。
本研究套件提供多種個人購買選項。 "市場趨勢與策略" 部分包含對 B2B 支付關鍵發展的深入分析,包括新的支付類型和自動化系統。此外,Juniper Research 的國家準備指數提供了 61 個不同地區 B2B 支付現狀及未來機會的逐國分析。
"數據與預測" 部分提供未來五年 B2B 支付市場採用情況和未來成長的數據,並按跨境和國內交易、業務規模和支付方式進行細分。
此外, "競爭排行榜" 對 B2B 支付領域的 19 家市場領導者進行了全面分析, "未來領導者指數" 則重點介紹了 18 家有望成為市場重要參與者的創新公司。
報告為全英語版。
範例視圖
市場資料&預測報告
樣品
市場趨勢與策略報告
市場數據與預測報告
此研究套件包含 158 個表格和預測的完整集合,包含超過 61,000 個資料點。此研究套件包含以下指標:
- B2B付款的總數
- B2B付款的總額
- 進行跨境付款的企業數
這些指標針對以下主要市場提供:
- 國內B2B付款
- 跨境B2B付款
此數據也依支付方式分類:
- 現金
- 支票
- 卡
- 虛擬卡
- 電報匯款
- 即時支付
- 其他
此數據也按與小型、中型和大型公司的交易進行細分。
Juniper Research 的互動式預測 (Excel) 包含以下功能:
- 統計分析:統計分析:搜尋資料期間所有地區和國家顯示的特定指標。圖表易於編輯,並可匯出至剪貼簿。
- 國家/地區資料工具:此工具可讓您查看預測期間所有地區和國家的指標。您可以使用搜尋欄縮小顯示的指標範圍。
- 國家比較工具:讓您選擇和比較各國。此工具包含匯出圖表的功能。
- 假設分析:五個個互動式場景,讓使用者比較不同的預測假設。
競爭排行榜報告
競爭排行榜報告透過兩種供應商定位工具,對大型成熟供應商和新興顛覆性供應商進行了詳細的評估和市場定位。 Juniper Research 的競爭排行榜根據 19 家領先的 B2B 支付平台的能力,將其分為幾組。
目標供應商包括以下 19 家公司:
|
|
|
該報告還包含一個“功能領導者指數”,該指數以可視化的方式展現了課題B2B支付市場主導地位的公司的競爭定位。
|
|
|
目錄
市場趨勢·策略
第1章 重要點和策略性建議
- 重要點
- 策略性建議
第2章 市場形勢和市場區隔
- 定義和範圍
- 主要趨勢
- 課題
- 付款者,加盟店,PSP的一般性課題
- 資費帶來的課題
- 解決方案和機遇
- 嵌入式金融與金融科技集成
- 供應鏈金融與營運資本解決方案
- 即時數據與分析
- 數位錢包與身分識別
- 協作生態系統
- 詐欺防制與強化安全措施
- 合規即服務
- 跨國 B2B 和境內 B2B 支付
- 國內B2B付款
- 跨境B2B付款
- B2B付款流通管道
- 即時付款/即時付款
- 支票
- 卡
- 不是即時的銀行支付
- 區塊鏈付款網路
- 中央銀行數位貨幣(CBDC)
- 穩定幣
- 附加價值服務
- 付款通知單財政
- AP/AR自動化
- 貿易金融
- 附加價值技術
- AI
- 付款的自動化
- 違法行為檢測
- 外匯管理與全球結算
- 區塊鏈
- CBDC
第3章 各國準備指數
- 各國準備指數:簡介
- 地區分析
- 北美
- 美國
- 南美
- 阿根廷
- 巴西
- 西歐
- EU
- 英國
- 中歐·東歐
- 波蘭
- 遠東及中國
- 中國
- 日本
- 印度半島
- 印度
- 其他亞太地區
- 澳洲
- 馬來西亞
- 非洲和中東
- 奈及利亞
- 沙烏地阿拉伯
- 北美
競爭排行榜
第1章 Juniper Research的競爭的排行榜
第2章 競爭排行榜:企業簡介
- 業者簡介
- ACI Worldwide
- American Express
- Banking Circle
- CGI
- Discover
- ECS Fin
- Finastra
- FIS
- Fiserv
- Flutterwave
- IBM
- Mastercard
- Montran Corporation
- Ripple
- Spendesk
- Stripe
- SWIFT
- Visa
- Wise
- Juniper Research的排行榜評估手法
- 限制與解釋
第3章 Juniper Research的Future Leaders Index
第4章 未來的領導者目錄業者簡介
- 業者簡介
- 3S Money
- AccessPay
- Airwallex
- Apron
- Airwallex
- Apron
- Balance
- Billie
- Brex
- Hokodo
- Jeeves
- Jeeves
- Mondu
- Billie
- Pliant
- Routable
- Sila
- Spenmo
- Juniper Research的Future Leaders Index:評估手法
- 限制與解釋
- 相關調查
資料·預測
第1章 市場形勢
第2章 預測概要
- 總量
- 總合金額
- 支付流通管道
第3章 國內B2B付款預測
- 調查手法與假設
- 國內預測
- 國內B2B交易數量
- 國內B2B交易額
- 卡片付款
- 即時支付
- 國內付款流通管道
第4章 跨境B2B付款
- 調查手法與前提
- 跨國預測
- 交易數量
- 交易的價值
- 電報匯款
- 跨境付款流通管道
'B2B Payment Cross-border Transactions to Hit 18 Billion by 2030, as Cross-border Activity Intensifies Despite Tariffs'
| KEY STATISTICS | |
|---|---|
| Total transaction value in 2025: | $187tn |
| Total transaction value in 2030: | $224tn |
| 2025 to 2030 market growth: | 20% |
| Forecast period: | 2025-2030 |
Overview
Juniper Research's "B2B Payments" research suite provides a comprehensive and insightful analysis of this market; enabling stakeholders from B2B payment platform providers to regulators and banks, to understand future growth, key trends and the competitive environment.
The research suite includes several different options that can be purchased separately. The Market Trends & Strategies element includes an insightful analysis of the key areas of progress within B2B payments, including new payment types and automation systems. Additionally, it features Juniper Research's Country Readiness Index, which provides a country-level analysis of the current and future opportunities for B2B payments in 61 different geographies.
The Data & Forecasting element includes access to data mapping the adoption and future growth of the B2B payments market over the next five years, split by cross-border versus domestic transactions, by business size and by payment method.
Additionally, the Competitor Leaderboard document features two vendor positioning models: the Competitor Leaderboard, revealing an extensive analysis of the 19 market leaders in the B2B payments space, and a Future Leaders Index; covering the 18 leading innovators who are becoming important in the market.
The coverage can also be purchased as a full research suite containing the Market Trends & Strategies, Data & Forecasting, and Competitor Leaderboard & Future Leaders Index, and a substantial discount.
Collectively, these documents provide a critical tool for understanding this important market. They allow B2B payment platform providers and payments companies to shape their future strategy; capitalising on future growth opportunities. This research suite's extensive coverage makes it a valuable tool for navigating this market.
All report content is delivered in the English language.
Key Features
- Key Takeaways & Strategic Recommendations: In-depth analysis of key development opportunities, key findings and key strategic recommendations for B2B payment platforms, cross-border payment specialists, banks, and regulators.
- Market Outlook: A breakdown of the B2B payments market by its component segments, with insight into the relative challenges of domestic and cross-border payments. It also examines, in detail, a range of payment types. Value-added services are analysed; assessing their place in the market and what businesses are looking for from these services. The research examines key emerging technologies in the B2B payments market, how they are used in the market, and how they will affect the market in the future. A Country Readiness Index is also included; assessing growth prospects for B2B payments across 61 key countries.
- Benchmark Industry Forecasts: Extensive forecasts for the number and value of B2B payments, split by domestic and cross-border. This is further split by payment channel (cash, cheque, card, virtual card, wire transfer, instant payment, and other means) and by business size (small, medium, and large).
- Juniper Research Competitor Leaderboard & Future Leaders Index: Key player capability and capacity assessment for 19 B2B payment platforms, via the Juniper Research Competitor Leaderboard. The study also contains a Future Leaders Index; positioning 18 key emerging players shaking up the B2B payments market.
SAMPLE VIEW
Market Data & Forecasting Report
The numbers tell you what's happening, but our written report details why, alongside the methodologies.
SAMPLE VIEW
Market Trends & Strategies Report
A comprehensive analysis of the current market landscape, alongside strategic recommendations.
Market Data & Forecasting Report
The market-leading research suite for the "B2B Payments" market includes access to the full set of forecast data of 158 tables and over 61,000 datapoints. Metrics in the research suite include:
- Total Number of B2B Payments
- Total Value of B2B Payments
- Number of Businesses Making Cross-border Payments
These metrics are provided for the following key market verticals:
- Domestic B2B Payments
- Cross-border B2B Payments
This data is also split by the following payment methods:
- Cash
- Cheque
- Card
- Virtual Card
- Wire Transfer
- Instant Payment
- Other Means
The data is also split by transactions being made by small, medium, and large businesses.
Juniper Research Interactive Forecast Excel contains the following functionality:
- Statistics Analysis: Users benefit from the ability to search for specific metrics, displayed for all regions and countries across the data period. Graphs are easily modified and can be exported to the clipboard.
- Country Data Tool: This tool enables users to look at metrics for all regions and countries in the forecast period. Users can refine the metrics displayed via a search bar.
- Country Comparison Tool: Users can select and compare countries. The ability to export graphs is included in this tool.
- What-if Analysis: Here, users can compare forecast metrics against their own assumptions, via 5 interactive scenarios.
Market Trends & Strategies Report
This report examines the "B2B Payments" market landscape in detail; assessing market trends and factors shaping the evolution of this growing market. The report delivers comprehensive analysis of the strategic opportunities in the B2B payments landscape; assessing key market segments, including real-time payments, A2A payments, credit card and debit cards, virtual cards, and other digital payment methods. It also examines their challenges and opportunities, such as the impact of the Trump Administration's tariffs and other economic policies. The report includes evaluation of key country-level opportunities for B2B payments growth; looking at the unique nature of individual B2B payment markets, from new real-time payment rails to the emergence of stablecoins for cross-border transactions.
Competitor Leaderboard Report
The Competitor Leaderboard report provides a detailed evaluation and market positioning for both the larger, established vendors, as well as for the newer, emerging disruptors: via two different vendor positioning tools. The Juniper Research Competitor Leaderboard offers coverage of 19 leading B2B payment platforms; positioning them as established leaders, leading challengers, or disruptors and challengers, based on capacity and capability assessments.
The 19 vendors included are:
|
|
|
The document also features a Feature Leaders Index. The Juniper Research Future Leaders Index provides a visual representation of the competitive positioning of companies in the B2B payments market which are challenging dominant players.
The 18 innovators included are:
|
|
|
Together, the Competitor Leaderboard and the Future Leaders Index give a comprehensive guide to the competitive landscape within B2B payments; providing an important resource for stakeholders.
Table of Contents
Market Trends & Strategies
1. Key Takeaways & Strategic Recommendations
- 1.1. Key Takeaways
- 1.2. Strategic Recommendations
2. Market Landscape & Segmentation
- 2.1. Introduction
- 2.1.1. The Context
- 2.2. Definition & Scope
- 2.3 Key Trends
- 2.3.1. Electronic Payments Increasingly Replacing Paper Cheques
- 2.3.2. Embedded Finance Drives Efficiency and Growth
- 2.3.3. Shift to Real-time Payments
- 2.3.4. A2A (Account-to-account) Payments
- 2.3.5. Pay by Bank and Instant Payments
- 2.3.6. Rise of Virtual Cards
- 2.3.7. Rising Levels of Automation
- 2.4. Challenges
- 2.4.1. General Challenges for Payers, Merchants and PSPs
- i. Fragmented Payment Workflows & Reconciliation Complexity
- ii. Payment Delays
- iii. Lack of Transparency
- iv. Cybersecurity & Fraud Risk
- v. Regulatory Compliance
- vi. Resistance to Technology Adoption
- 2.4.1. General Challenges for Payers, Merchants and PSPs
- 2.5. Challenges Induced by Tariffs
- Table 2.1: Impact of Tariffs for B2B Payment Stakeholders
- Figure 2.2: Impact of Tariffs for B2B Payment Stakeholders
- i. The Domestic Impact of Tariffs
- ii. Cross-border Impact of Tariffs
- 2.6. Solutions & Opportunities
- 2.6.1. Embedded Finance & Fintech Integration
- 2.6.2. Supply Chain Financing & Working Capital Solutions
- i. Enhanced Cashflow Management
- ii. Flexible Payment Options
- 2.6.3. Real-time Data & Analytics
- i. Services Consolidation
- 2.6.4. Digital Wallets and Identity
- 2.6.5. Collaborative Ecosystems
- 2.6.6. Fraud Prevention & Enhanced Security Measures
- 2.6.7. Compliance-as-a-service
- 2.7. Cross-border Versus Domestic B2B Payments
- 2.7.1. Domestic B2B Payments
- i. Automation
- ii. Data-driven Payment Decisions
- 2.7.2. Cross-border B2B Payments
- i. Seamless Cross-border Transactions
- ii. Interoperability
- 2.7.1. Domestic B2B Payments
- 2.8. B2B Payments Channels
- 2.8.1. Real-time Payments/Instant Payments
- 2.8.2. Cheques
- 2.8.3. Cards
- i. Corporate Cards
- ii. Virtual Cards
- 2.8.4. Non-instant Bank Payments
- 2.8.5. Blockchain Payment Networks
- 2.8.6. Central Bank Digital Currencies (CBDCs)
- 2.8.7. Stablecoins
- 2.9. Value-added Services
- 2.9.1. Invoice Financing
- 2.9.2. AP/AR Automation
- 2.9.3. Trade Financing
- 2.10. Value-added Technologies
- 2.10.1. AI
- 2.10.2. Payment Automation
- 2.10.3. Fraud Detection
- 2.10.4. FX Management and Global Payments
- 2.10.5. Blockchain
- 2.10.6. CBDCs
3. Country Readiness Index
- 3.1. Introduction to the Country Readiness Index
- Figure 3.1: Juniper Research's Country Readiness Index Scoring Criteria: B2B Payments
- Figure 3.2: Juniper Research Country Readiness Index: B2B Payments
- Figure 3.3: B2B Payments Country Readiness Index: Market Segments
- 3.2. Regional Analysis
- 3.2.1. North America
- i. US
- 3.2.2. Latin America
- i. Argentina
- ii. Brazil
- 3.2.3. West Europe
- i. EU
- ii. UK
- 3.2.4. Central & East Europe
- i. Poland
- 3.2.5. Far East & China
- i. China
- ii. Japan
- 3.2.6. Indian Subcontinent
- i. India
- 3.2.7. Rest of Asia Pacific
- i. Australia
- ii. Malaysia
- 3.2.8. Africa & Middle East
- i. Nigeria
- ii. Saudi Arabia
- Figure 3.4: Juniper Research's Country Readiness Index Heatmap: North America
- Figure 3.5: Juniper Research's Country Readiness Index Heatmap: Latin America
- Figure 3.6: Juniper Research's Country Readiness Index Heatmap: West Europe60
- Figure 3.7: Juniper Research's Country Readiness Index Heatmap: Central and East Europe
- Figure 3.8: Juniper Research's Country Readiness Index Heatmap: Far East & China
- Figure 3.9: Juniper Research's Country Readiness Index Heatmap: Indian Subcontinent
- Figure 3.10: Juniper Research's Country Readiness Index Heatmap: Rest of Asia Pacific
- Figure 3.11: Juniper Research's Country Readiness Index Heatmap: Africa and Middle East
- 3.2.1. North America
Competitor Leaderboard
1. Juniper Research Competitor Leaderboard
- 1.1. Why Read This Report
- Table 1.1: Juniper Research's Competitor Leaderboard: B2B Payments Vendors Included & Product Portfolio
- Figure 1.2: Juniper Research's Competitor Leaderboard for B2B Payments
- Table 1.3: Juniper Research B2B Payments Vendors & Positioning
- Table 1.4: Juniper Research's Competitor Leaderboard Heatmap B2B Payments Vendors (Part 1 of 2)
- Table 1.4: Juniper Research's Competitor Leaderboard Heatmap B2B Payments Vendors (Part 2 of 2)
2. Competitor Leaderboard Company Profiles
- 2.1. Vendor Profiles
- 2.1.1. ACI Worldwide
- i. Corporate
- Table 2.1: ACI Worldwide's Financial Snapshot ($m), 2022-2024
- ii. Geographical Spread
- iii. Key Clients & Strategic Partnerships
- iv. High-level View of Offerings
- v. Juniper Research's View: Key Strengths & Strategic Development Opportunities
- i. Corporate
- 2.1.2. American Express
- i. Corporate
- Table 2.2: American Express' Financial Snapshot ($m), 2022-2024
- ii. Geographical Spread
- iii. Key Clients & Strategic Partnerships
- iv. High-level View of Offerings
- v. Juniper Research's View: Key Strengths & Strategic Development Opportunities
- i. Corporate
- 2.1.3. Banking Circle
- i. Corporate
- ii. Geographical Spread
- iii. Key Clients & Strategic Partnerships
- iv. High-level View of Offerings
- v. Juniper Research's View: Key Strengths & Strategic Development Opportunities
- 2.1.4. CGI
- i. Corporate
- Table 2.3: CGI's Financial Snapshot ($m), 2022-2024
- ii. Geographical Spread
- iii. Key Clients & Strategic Partnerships
- iv. High-level View of Offerings
- Figure 2.4: CGI's All Payments Solution
- v. Juniper Research's View: Key Strengths & Strategic Development Opportunities
- i. Corporate
- 2.1.5. Discover
- i. Corporate
- Table 2.5: Discover's Financial Snapshot ($m), 2022-2024
- ii. Geographical Spread
- iii. Key Clients & Strategic Partnerships
- iv. High-level View of Offerings
- v. Juniper Research's View: Key Strengths & Strategic Development Opportunities
- i. Corporate
- 2.1.6. ECS Fin
- i. Corporate
- ii. Geographical Spread
- iii. Key Clients & Strategic Partnerships
- iv. High-level View of Offerings
- v. Juniper Research's View: Key Strengths & Strategic Development Opportunities
- 2.1.7. Finastra
- i. Corporate
- ii. Geographical Spread
- iii. Key Clients & Strategic Partnerships
- iv. High-level View of Offerings
- v. Juniper Research's View: Key Strengths & Strategic Development Opportunities
- 2.1.8. FIS
- i. Corporate
- Figure 2.6: FIS' Financial Snapshot ($m), 2022-2024
- ii. Geographical Spread
- iii. Key Clients & Strategic Partnerships
- iv. High-level View of Offerings
- v. Juniper Research's View: Key Strengths & Strategic Development Opportunities
- i. Corporate
- 2.1.9. Fiserv
- i. Corporate
- Table 2.7: Fiserv's Financial Snapshot ($m), 2022-2024
- ii. Geographical Spread
- iii. Key Clients & Strategic Partnerships
- iv. High-level View of Offerings
- v. Juniper Research's View: Key Strengths & Strategic Development Opportunities
- i. Corporate
- 2.1.10. Flutterwave
- i. Corporate
- Table 2.8: Flutterwave's Rounds of Funding ($m), 2017-2022
- ii. Geographical Spread
- iii. Key Clients & Strategic Partnerships
- iv. High-level View of Offerings
- v. Juniper Research's View: Key Strengths & Strategic Development Opportunities
- i. Corporate
- 2.1.11. IBM
- i. Corporate
- Table 2.9: IBM's Financial Snapshot ($m), 2022-2024
- ii. Geographical Spread
- iii. Key Clients & Strategic Partnerships
- iv. High-level View of Offerings
- v. Juniper Research's View: Key Strengths & Strategic Development Opportunities
- i. Corporate
- 2.1.12. Mastercard
- i. Corporate
- Table 2.10: Mastercard's Financial Snapshot ($m), 2022-2024
- ii. Geographical Spread
- iii. Key Clients & Strategic Partnerships
- iv. High-level View of Offerings
- v. Juniper Research's View: Key Strengths & Strategic Development Opportunities
- i. Corporate
- 2.1.13. Montran Corporation
- i. Corporate
- ii. Geographical Spread
- iii. Key Clients & Strategic Partnerships
- iv. High-level View of Offerings
- v. Juniper Research's View: Key Strengths & Strategic Development Opportunities
- 2.1.14. Ripple
- i. Corporate
- Figure 2.11: Ripple's Funding Rounds ($m), 2015-2019
- ii. Geographical Spread
- iii. Key Clients & Strategic Partnerships
- iv. High-level View of Offerings
- Figure 2.12: How Ripple's Cross-border Payments Work
- v. Juniper Research's View: Key Strengths & Strategic Development Opportunities
- i. Corporate
- 2.1.15. Spendesk
- i. Corporate
- Table 2.13: Spendesk's Funding Rounds ($m), 2017-2022
- ii. Geographical Spread
- iii. Key Clients & Strategic Partnerships
- iv. High-level View of Offerings
- v. Juniper Research's View: Key Strengths & Strategic Development Opportunities
- i. Corporate
- 2.1.16. Stripe
- i. Corporate
- Table 2.14: Stripe's Funding Rounds ($m), 2019-2023
- ii. Geographical Spread
- iii. Key Clients & Strategic Partnerships
- iv. High-level View of Offerings
- v. Juniper Research's View: Key Strengths & Strategic Development Opportunities
- i. Corporate
- 2.1.17. SWIFT
- i. Corporate
- Table 2.15: SWIFT's Financial Snapshot ($m), 2021-2023
- ii. Geographical Spread
- iii. Key Clients & Strategic Partnerships
- iv. High-level View of Offerings
- v. Juniper Research's View: Key Strengths & Strategic Development Opportunities
- i. Corporate
- 2.1.18. Visa
- i. Corporate
- Table 2.16: Visa's Financial Snapshot ($m), 2022-2024
- ii. Geographical Spread
- iii. Key Clients & Strategic Partnerships
- iv. High-level View of Offerings
- Figure 2.17: How Visa B2B Connect Works
- v. Juniper Research's View: Key Strengths & Strategic Development Opportunities
- i. Corporate
- 2.1.19. Wise
- i. Corporate
- Figure 2.18: Wise's Financial Snapshot ($m), 2022-2024
- ii. Geographical Spread
- iii. Key Clients & Strategic Partnerships
- iv. High-level View of Offerings
- v. Juniper Research's View: Key Strengths & Strategic Development Opportunities
- i. Corporate
- 2.1.1. ACI Worldwide
- 2.2. Juniper Research Competitor Leaderboard Assessment Methodology
- 2.2.1. Limitations & Interpretations
- Table 2.19: Juniper Research's Competitor Leaderboard Scoring Criteria - B2B Payments
- 2.2.1. Limitations & Interpretations
3. Juniper Research Future Leaders Index
- Table 3.1: Juniper Research Future Leaders Index - B2B Payments Vendors & Product Portfolio
- Figure 3.2: Juniper Research Future Leaders Index - B2B Payments
- Table 3.3: Juniper Research Future Leaders Index Ranking - B2B Payments
- Table 3.4: Juniper Research Future Leaders Index - B2B Payments Heatmap
4. Future Leaders Index Vendor Profiles
- 4.1. Vendor Profiles
- 4.1.1. 3S Money
- i. Corporate
- ii. Geographical Spread
- iii. Key Clients & Strategic Partnerships
- iv. High-level View of Offerings
- v. Juniper Research's View: Key Strengths & Strategic Development Opportunities
- 4.1.2. AccessPay
- i. Corporate
- ii. Geographical Spread
- iii. Key Clients & Strategic Partnerships
- iv. High-level View of Offerings
- v. Juniper Research's View: Key Strengths & Strategic Development Opportunities
- 4.1.3. Airwallex
- i. Corporate
- Table 4.1: Airwallex's Rounds of Funding ($m), 2018-2025
- ii. Geographical Spread
- iii. Key Clients & Strategic Partnerships
- iv. High level View of Offerings
- v. Juniper Research's View: Key Strengths & Strategic Development Opportunities
- i. Corporate
- 4.1.4. Apron
- i. Corporate
- ii. Geographical Spread
- iii. Key Clients & Strategic Partnerships
- iv. High-level View of Offerings
- v. Juniper Research's View: Key Strengths & Strategic Development Opportunities
- 4.1.5. Aria
- i. Corporate
- ii. Geographical Spread
- iii. Key Clients & Strategic Partnerships
- iv. High-level View of Offerings
- v. Juniper Research's View: Key Strengths & Strategic Development Opportunities
- 4.1.6. Autobooks
- i. Corporate
- ii. Geographical Spread
- iii. Key Clients & Strategic Partnerships
- iv. High-level View of Offerings
- v. Juniper Research's View: Key Strengths & Strategic Development Opportunities
- 4.1.7. Balance
- i. Corporate
- ii. Geographical Spread
- iii. Key Clients & Strategic Partnerships
- iv. High-level View of Offerings
- v. Juniper Research's View: Key Strengths & Strategic Development Opportunities
- 4.1.8. Billie
- i. Corporate
- ii. Geographical Spread
- iii. Key Clients & Strategic Partnerships
- iv. High-level View of Offerings
- v. Juniper Research's View: Key Strengths & Strategic Development Opportunities
- 4.1.9. Brex
- i. Corporate
- Table 4.2: Brex's Funding Rounds ($m), 2018-2022
- ii. Geographical Spread
- iii. Key Clients & Strategic Partnerships
- iv. High-level View of Offerings
- v. Juniper Research's View: Key Strengths & Strategic Development Opportunities
- i. Corporate
- 4.1.10. Hokodo
- i. Corporate
- ii. Geographical Spread
- iii. Key Clients & Strategic Partnerships
- iv. High-level View of Offerings
- v. Juniper Research's View: Key Strengths & Strategic Development Opportunities
- 4.1.11. Jeeves
- i. Corporate
- ii. Geographical Spread
- iii. Key Clients & Strategic Partnerships
- iv. High-level View of Offerings
- v. Juniper Research's View: Key Strengths & Strategic Development Opportunities
- 4.1.12. Modulr
- i. Corporate
- ii. Geographical Spread
- iii. Key Clients & Strategic Partnerships
- iv. High-level View of Offerings
- v. Juniper Research's View: Key Strengths & Strategic Development Opportunities
- 4.1.13. Mondu
- i. Corporate
- ii. Geographical Spread
- iii. Key Clients & Strategic Partnerships
- iv. High-level View of Offerings
- v. Juniper Research's View: Key Strengths & Strategic Development Opportunities
- 4.1.14. Paytron
- i. Corporate
- ii. Geographical Spread
- iii. Key Clients & Strategic Partnerships
- iv. High-level View of Offerings
- v. Juniper Research's View: Key Strengths & Strategic Development Opportunities
- 4.1.15. Pliant
- i. Corporate
- Table 4.3: Pliant's Rounds of Funding ($m), 2021-2025
- ii. Geographical Spread
- iii. Key Clients & Strategic Partnerships
- High-level View of Offerings
- iv. Juniper Research's View: Key Strengths & Strategic Development Opportunities
- i. Corporate
- 4.1.16. Routable
- i. Corporate
- ii. Geographical Spread
- iii. Key Clients & Strategic Partnerships
- iv. High-level View of Offerings
- v. Juniper Research's View: Key Strengths & Strategic Development Opportunities
- 4.1.17. Sila
- i. Corporate
- ii. Geographical Spread
- iii. Key Clients & Strategic Partnerships
- iv. High-level View of Offerings
- v. Juniper Research's View: Key Strengths & Strategic Development Opportunities
- 4.1.18. Spenmo
- i. Corporate
- ii. Geographical Spread
- iii. Key Clients & Strategic Partnerships
- iv. High-level View of Offerings
- v. Juniper Research's View: Key Strengths & Strategic Development Opportunities
- 4.1.1. 3S Money
- 4.2. Juniper Research Future Leaders Index Assessment Methodology
- 4.3. Limitations & Interpretations
- Table 4.5: Juniper Research Future Leaders Index: B2B Payments Criteria
- 4.4. Related Research
Data & Forecasting
1. Market Landscape
- 1.1. Introduction
- 1.2. Definitions
- Figure 1.1: Juniper Research's 8 Key Regions - Definition
2. Forecast Overview
- 2.1. Total Volume
- Figure & Table 2.1: Total Volume of B2B Payments (m), Split by 8 Key Regions, 2025-2030
- 2.2. Total Value
- Figure & Table 2.2: Total Value of B2B Payments ($m), Split by 8 Key Regions, 2025-2030
- 2.3. Payment Channel
- Figure & Table 2.3: Total Value of B2B Payments ($m), Split by Payment Channel, 2025-2030
3. Domestic B2B Payments Forecast
- 3.1. Introduction
- 3.2. Methodology and Assumptions
- Figure 3.1: B2B Domestic Payments Market - Forecast Methodology
- 3.3. Domestic Forecasts
- 3.3.1. Number of Domestic B2B Transactions
- Figure & Table 3.2: Number of Domestic B2B Payments per annum (m), Split by 8 Key Regions, 2025-2030
- 3.3.2. Value of Domestic B2B Transactions
- Figure & Table 3.3: Total Value of B2B Domestic Payments ($m), Split by 8 Key Regions, 2025-2030
- 3.3.3. Card Payments
- Figure & Table 3.4: Total Value of Domestic B2B Payments via Card ($m), Split by 8 Key Regions, 2025-2030
- 3.3.4. Instant Payments
- Figure & Table 3.5: Total Value of Domestic B2B Payments via Instant Payments ($m), Split by 8 Key Regions, 2025-2030
- 3.3.5. Domestic Payment Channels
- Figure & Table 3.6: Total Value of Domestic B2B Payments ($m), Split by Payment Channel, 2025-2030
- 3.3.1. Number of Domestic B2B Transactions
4. Cross-border B2B Payments
- 4.1. Introduction
- 4.2. Methodology & Assumptions
- Figure 4.1: B2B Cross-border B2B Payments - Forecast Methodology
- 4.3. Cross-border Forecasts
- 4.3.1. Number of Transactions
- Figure & Table 4.2: Total Number of Outflow Cross-border B2B Payments per annum (m), Split by 8 Key Regions, 2025-2030
- 4.3.2. Value of Transactions
- Figure & Table 4.3: Total Value of Cross-border Outflow Payments ($m), Split by 8 Key Regions, 2025-2030
- 4.3.3. Wire Transfer
- Figure & Table 4.4: Total Value of Cross-border Payments via Wire Transfer ($m), Split by 8 Key Regions, 2024-2030
- 4.3.4. Cross-border Payments Channels
- Figure & Table 4.5: Total Value of Cross-border B2B Payments ($m), Split by Payments Channel, 2025-2030
- 4.3.1. Number of Transactions
 B2B支付市場-全球產業規模、佔有率、趨勢、機會與預測:按支付類型、公司規模、支付方式、產業橫斷面、區域和競爭格局分類,2021-2031年
 B2B支付:市場佔有率分析、產業趨勢與統計、成長預測(2026-2031年)
 2026年全球全平台遊戲手把市場報告
 B2B支付交易市場:按支付類型、支付方式、公司類型、行業和地區分類
 B2B支付市場:按類型、支付方式、公司規模及最終用戶產業分類-2026-2032年全球市場預測
 B2B支付市場規模、佔有率、成長及全球產業分析:按類型、應用和地區分類的洞察,以及2026-2034年的預測
 B2B支付市場規模、佔有率、趨勢和預測(按支付類型、支付方式、公司規模、行業和地區分類,2026-2034年)全方位金融服務平台市場(按服務類型、客戶類型、組織規模、部署類型和分銷管道分類)-2026-2032年全球預測出口保證平台市場按產品類型、保固期、風險類別、最終用戶產業和通路分類,全球預測(2026-2032年)全球B2B支付市場(2024-2030年)