


 |
市場調查報告書
商品編碼
2121194
2026 年至 2035 年控制閥的市場機會、成長促進因素、產業趨勢分析與預測。Control Valve Market Opportunity, Growth Drivers, Industry Trend Analysis, and Forecast 2026 - 2035 |
||||||

2025年全球控制閥市場價值為93億美元,預計到2035年將以5%的複合年成長率成長至152億美元。
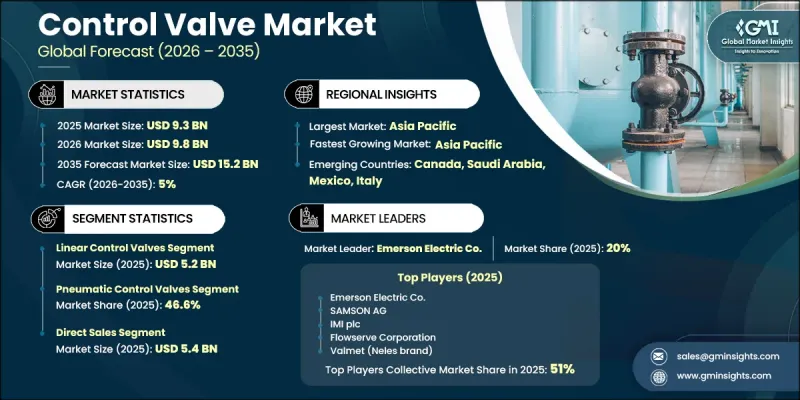
在流程工業領域,由於對先進流量控制技術的依賴性日益增強,市場持續擴張,以提高操作精度、生產效率和流程可靠性。控制閥仍然是工業設施中不可或缺的組件,因為精確控制流體流量對於維持穩定運作和最佳化能源消耗至關重要。工業製程控制系統的不斷現代化正在推動採用配備先進執行器、智慧定位器和即時監控功能的數位化控制閥。這些技術使操作人員能夠提高系統效能、減輕維護負擔並保持長期運作效率,同時增強流程視覺性。同時,日益嚴格的環境法規和不斷成長的企業永續發展措施正在影響採購決策,促使終端用戶投資於低排放量閥門技術、節能驅動系統和智慧診斷解決方案。從傳統閥門系統向先進數位控制平台的轉變正在加速閥門更換需求,同時也提高了已安裝閥門組件的整體價值。這些因素將持續支撐全球控制閥市場的持續成長。
| 市場範圍 | |
|---|---|
| 開始年份 | 2025 |
| 預測期 | 2026-2035 |
| 起始金額 | 93億美元 |
| 預測金額 | 152億美元 |
| 複合年成長率 | 5% |
預計到2025年,線性控制閥市場銷售額將達到52億美元。該市場持續保持主導地位,因為線性控制閥能夠提供精確的流量控制、可靠的關閉性能以及在各種工業製程條件下的穩定運作。它們能夠提供穩定的製程控制並支援高效的系統性能,這是其在連續加工環境中廣泛應用的關鍵因素,因為在這些環境中,操作精度和可靠的流量管理至關重要。
到2025年,氣動控制閥市佔率將達到46.6%。強勁的市場需求持續受到氣壓基礎設施的廣泛應用以及氣壓驅動技術在工業設施中久經考驗的卓越性能的支撐。許多營運商正在升級現有的氣動控制系統,採用先進的執行器和定位技術,以提高製程效率、增強控制精度、延長設備壽命並最大限度地減少資本投資,同時保持與現有氣壓基礎設施的兼容性。
預計2025年,美國控制閥市佔率將達到74.3%,市場規模將達22億美元。美國龐大的工業基礎,以及對工業現代化和製程自動化的持續投資,不斷推動對先進控制閥技術的需求。此外,對提高營運效率、增強生產可靠性、加強環保合規以及工業設施現代化的日益重視,也進一步促進了美國控制閥市場的全國性擴張。
目錄
第1章:調查方法和範圍
第2章執行摘要
第3章 行業洞察
- 產業生態系分析
- 供應商情況
- 利潤率
- 每個階段增加的價值
- 影響價值鏈的因素
- 影響產業的因素
- 成長促進因素
- 工業自動化技術的進步
- 人們越來越關注企業效率
- 規章制度和安全要求
- 產業潛在風險與挑戰
- 高昂的初始成本和維修成本
- 供應鏈和原物料價格波動
- 機會
- 智慧控制閥
- 用水和污水產業的擴張
- 成長促進因素
- 成長潛力分析
- 監理框架
- 美國環保署 (EPA) 甲烷減量與排放標準
- 符合歐盟工業排放指令和ATEX標準。
- 控制閥設計和測試的API、ANSI/ISA和IEC標準
- 區域監管情勢(亞太地區、中東和非洲)
- 價格分析
- 2022-2025年歷史價格趨勢分析
- 依球員類型分類的定價策略(高級球員、超值球員、成本加成球員)
- 貿易數據分析
- 依HS編碼分類的進出口量和進口額趨勢(8481)
- 主要貿易路線及關稅的影響
- 人工智慧和生成式人工智慧對市場的影響
- 利用人工智慧改造現有經營模式
- 按細分市場分類的生成式人工智慧用例和部署藍圖
- 風險、限制和監管考量
- 生產能力和生產情況
- 按地區和主要生產商分類的已安裝製造能力
- 運轉率和擴張計劃
第4章 競爭情勢
- 介紹
- 企業市佔率分析
- 按地區
- 企業矩陣分析
- 主要市場公司的競爭分析
- 競爭定位矩陣
- 主要進展
- 併購
- 夥伴關係和聯盟
- 新產品發布
- 業務拓展計劃
第5章 市場估價與預測:依閥門類型分類,2022-2035年
- 線性控制閥
- 旋轉控制閥
第6章 市場估算與預測:依驅動技術分類,2022-2035年
- 氣動控制閥
- 電動控制閥
- 電液控制閥
- 液壓控制閥
- 手動控制閥
第7章 市場估計與預測:依組件分類,2022-2035年
- 閥體
- 執行器
- 氣壓執行器
- 電動執行器
- 液壓執行器
- 定位器
- 氣動定位器
- 數位/智慧定位器
- 其他零件(限位開關、電磁閥先導裝置、密封組件、配件)
第8章 市場估算與預測:依材料分類,2022-2035年
- 不銹鋼
- 鑄鐵
- 碳鋼和鉻鉬合金
- 低溫材料
- 特殊合金
- 其他
第9章 市場規模估算與預測(2022-2035年)
- 小於1英寸
- 1英寸至6英寸
- 6英寸至25英寸
- 25英寸至50英寸
- 50吋或更大
第10章 市場估計與預測:依壓力範圍分類,2022-2035年
- 小於 50 巴
- 50~350 Bar
- 351~700 Bar
- 701~1,000 Bar
- 超過 1,000 巴
第11章 市場估計與預測:依應用領域分類,2022-2035年
- 流量控制
- 壓力控制
- 溫度控制
- 液位控制
- 其他
第12章 市場估計與預測:依最終用戶產業分類,2022-2035年
- 石油和天然氣
- 能源與電力
- 水和污水處理
- 化工/石油化工
- 食品/飲料
- 製藥
- 金屬和採礦
- 紙漿和造紙
- 建築/施工
- 其他
第13章 市場估計與預測:依通路分類,2022-2035年
- 直銷
- 間接銷售
第14章 市場估計與預測:依地區分類,2022-2035年
- 北美洲
- 美國
- 加拿大
- 歐洲
- 德國
- 英國
- 法國
- 義大利
- 西班牙
- 亞太地區
- 中國
- 日本
- 印度
- 澳洲
- 韓國
- 拉丁美洲
- 巴西
- 墨西哥
- 阿根廷
- 中東和非洲
- 南非
- 沙烏地阿拉伯
- UAE
第15章:公司簡介
- 世界公司
- Emerson Electric Co.
- Flowserve Corporation
- Valmet(Neles brand)
- Baker Hughes(Masoneilan)
- SAMSON AG
- IMI plc
- KSB SE & Co. KGaA
- 當地公司
- CEPAI Group
- Bray International
- Neway Valve(Suzhou)Co.
- Kitz Corporation
- ARI-Armaturen
- CIRCOR International
- ARCA Regler GmbH
- 新興企業
- Burkert Fluid Control Systems
- Azbil Corporation
- Zhejiang SUPCON Fluid Technology
- GEMU Group
- Mokveld Valves BV
- Curtiss-Wright Corporation
- Velan Inc.
The Global Control Valve Market was valued at USD 9.3 billion in 2025 and is estimated to grow at a CAGR of 5% to reach USD 15.2 billion by 2035.
The market continues to expand as process industries increasingly rely on advanced flow control technologies to improve operational accuracy, production efficiency, and process reliability. Control valves remain an essential component across industrial facilities where precise regulation of fluid flow is critical for maintaining stable operations and optimizing energy consumption. Ongoing modernization of industrial process control systems is encouraging greater adoption of digitally enabled control valves equipped with advanced actuators, intelligent positioners, and real-time monitoring capabilities. These technologies allow operators to improve system performance, reduce maintenance requirements, and enhance process visibility while supporting long-term operational efficiency. At the same time, tightening environmental regulations and growing corporate sustainability initiatives are influencing purchasing decisions, prompting end users to invest in low-emission valve technologies, energy-efficient actuation systems, and smart diagnostic solutions. The transition from conventional valve systems to advanced digital control platforms is accelerating replacement demand while increasing the overall value of installed valve assemblies. These factors continue to support sustained growth across the global Control Valve Market.
| Market Scope | |
|---|---|
| Start Year | 2025 |
| Forecast Year | 2026-2035 |
| Start Value | $9.3 Billion |
| Forecast Value | $15.2 Billion |
| CAGR | 5% |
The linear control valves segment generated USD 5.2 billion in 2025. The segment continues to maintain its leading position because linear control valves provide accurate flow regulation, dependable shut-off performance, and consistent operation across a broad range of industrial process conditions. Their ability to deliver stable process control and support efficient system performance has contributed to widespread adoption across continuous processing environments where operational precision and reliable flow management remain essential.
The pneumatic control valves segment accounted for 46.6% share in 2025. Strong market demand continues to be supported by the widespread availability of pneumatic infrastructure and the proven performance of pneumatic actuation technologies in industrial facilities. Many operators are upgrading existing pneumatic control systems with advanced actuator and positioning technologies to improve process efficiency, enhance control accuracy, extend equipment life, and maintain compatibility with established plant infrastructure while minimizing capital investment.
United States Control Valve Market held a 74.3% share generating USD 2.2 billion in 2025. The country's extensive industrial manufacturing base, combined with continued investments in industrial modernization and process automation, continues to drive demand for advanced control valve technologies. Growing emphasis on improving operational efficiency, increasing production reliability, strengthening environmental compliance, and modernizing industrial facilities further supports the expansion of the Control Valve Market across the United States.
Major companies operating in the Global Control Valve Market include Emerson Electric Co., Flowserve Corporation, Valmet (Neles brand), Baker Hughes (Masoneilan), SAMSON AG, IMI plc, KSB SE & Co. KGaA, CEPAI Group, Bray International, Neway Valve (Suzhou) Co., Kitz Corporation, ARI-Armaturen, CIRCOR International, ARCA Regler GmbH, Burkert Fluid Control Systems, Azbil Corporation, Zhejiang SUPCON Fluid Technology, GEMU Group, Mokveld Valves BV, Curtiss-Wright Corporation, and Velan Inc. Companies participating in the Control Valve Market are strengthening their market positions through continuous investments in product innovation, digital technologies, and advanced process automation solutions. Manufacturers are expanding their portfolios by introducing intelligent control valves with enhanced diagnostics, predictive maintenance capabilities, improved energy efficiency, and seamless integration with digital industrial control systems. Strategic partnerships, mergers, acquisitions, and technology collaborations remain important growth strategies for expanding global presence and strengthening engineering capabilities. Companies are also increasing research and development investments to improve product reliability, operational performance, material durability, and automation compatibility.
Table of Contents
Chapter 1 Methodology & Scope
- 1.1 Research approach
- 1.2 Quality Commitments
- 1.2.1 GMI AI policy & data integrity commitment
- 1.2.1.1 Source consistency protocol
- 1.2.1 GMI AI policy & data integrity commitment
- 1.3 Research Trail & Confidence Scoring
- 1.3.1 Research Trail Components
- 1.3.2 Scoring Components
- 1.4 Data Collection
- 1.4.1 Partial list of primary sources
- 1.5 Data mining sources
- 1.5.1 Paid sources
- 1.5.1.1 Sources, by region
- 1.5.1 Paid sources
- 1.6 Base estimates and calculations
- 1.6.1 Base year calculation for any one approach
- 1.7 Forecast model
- 1.7.1 Quantified market impact analysis
- 1.7.1.1 Mathematical impact of growth parameters on forecast
- 1.7.1 Quantified market impact analysis
- 1.8 Research transparency addendum
- 1.8.1 Source attribution framework
- 1.8.2 Quality assurance metrics
- 1.8.3 Our commitment to trust
Chapter 2 Executive Summary
- 2.1 Industry 360° synopsis
- 2.2 Key market trends
- 2.2.1 Regional
- 2.2.2 Valve type
- 2.2.3 Actuation technology
- 2.2.4 Component
- 2.2.5 Material
- 2.2.6 Size
- 2.2.7 Pressure range
- 2.2.8 Application
- 2.2.9 End user industry
- 2.2.10 Distribution channel
Chapter 3 Industry Insights
- 3.1 Industry ecosystem analysis
- 3.1.1 Supplier landscape
- 3.1.2 Profit margin
- 3.1.3 Value addition at each stage
- 3.1.4 Factor affecting the value chain
- 3.2 Industry impact forces
- 3.2.1 Growth drivers
- 3.2.1.1 Rising industrial automation
- 3.2.1.2 Increasing focus on operational efficiency
- 3.2.1.3 Regulatory and safety requirements
- 3.2.2 Industry pitfalls & challenges
- 3.2.2.1 High installation and maintenance costs
- 3.2.2.2 Supply chain and raw material volatility
- 3.2.3 Opportunities
- 3.2.3.1 Smart control valves
- 3.2.3.2 Water and wastewater sector expansion
- 3.2.1 Growth drivers
- 3.3 Growth potential analysis
- 3.4 Regulatory framework
- 3.4.1 US EPA methane reduction & fugitive emission standards
- 3.4.2 EU industrial emissions directive & ATEX compliance
- 3.4.3 API, ANSI/ISA, IEC standards for control valve design & testing
- 3.4.4 Regional regulatory landscape (APAC, MEA)
- 3.5 Pricing analysis (driven by primary research)
- 3.5.1 Historical price trend analysis (2022-2025)
- 3.5.2 Pricing strategy by player type (premium / value / cost-plus)
- 3.6 Trade data analysis (driven by paid database)
- 3.6.1 Import/export volume & value trends by HS code (8481)
- 3.6.2 Key trade corridors & tariff impact
- 3.7 Impact of AI & generative AI on the market
- 3.7.1 AI-driven disruption of existing business models
- 3.7.2 GenAI use cases & adoption roadmap by segment
- 3.7.3 Risks, limitations & regulatory considerations
- 3.8 Capacity & production landscape (driven by primary research)
- 3.8.1 Installed manufacturing capacity by region & key producer
- 3.8.2 Capacity utilization rates & expansion pipelines
Chapter 4 Competitive Landscape, 2025
- 4.1 Introduction
- 4.2 Company market share analysis
- 4.2.1 By region
- 4.2.1.1 North America
- 4.2.1.2 Europe
- 4.2.1.3 Asia Pacific
- 4.2.1.4 Latin America
- 4.2.1.5 Middle East and Africa
- 4.2.1 By region
- 4.3 Company matrix analysis
- 4.4 Competitive analysis of major market players
- 4.5 Competitive positioning matrix
- 4.6 Key developments
- 4.6.1 Mergers & acquisitions
- 4.6.2 Partnerships & collaborations
- 4.6.3 New product launches
- 4.6.4 Expansion plans
Chapter 5 Market Estimates and Forecast, By Valve Type, 2022 – 2035 (USD Billion) (Units)
- 5.1 Key trends
- 5.2 Linear control valves
- 5.3 Rotary control valves
Chapter 6 Market Estimates and Forecast, By Actuation Technology, 2022 – 2035 (USD Billion) (Units)
- 6.1 Key trends
- 6.2 Pneumatic control valves
- 6.3 Electric control valves
- 6.4 Electro-hydraulic control valves
- 6.5 Hydraulic control valves
- 6.6 Manual control valves
Chapter 7 Market Estimates and Forecast, By Component, 2022 – 2035 (USD Billion) (Units)
- 7.1 Key trends
- 7.2 Valve body
- 7.3 Actuators
- 7.4 Pneumatic actuators
- 7.5 Electric actuators
- 7.6 Hydraulic actuators
- 7.7 Positioners
- 7.8 Pneumatic positioners
- 7.9 Digital/smart positioners
- 7.10 Others (limit switches, solenoid pilots, sealing assemblies, accessories)
Chapter 8 Market Estimates and Forecast, By Material, 2022 – 2035 (USD Billion) (Units)
- 8.1 Key trends
- 8.2 Stainless steel
- 8.3 Cast iron
- 8.4 Carbon steel & chrome-moly alloys
- 8.5 Cryogenic-grade materials
- 8.6 Exotic alloys
- 8.7 Others
Chapter 9 Market Estimates and Forecast, By Size, 2022 – 2035 (USD Billion) (Units)
- 9.1 Key trends
- 9.2 Up to 1"
- 9.3 1" – 6"
- 9.4 6" – 25"
- 9.5 25" – 50"
- 9.6 Above 50"
Chapter 10 Market Estimates and Forecast, By Pressure Range, 2022 – 2035 (USD Billion) (Units)
- 10.1 Key trends
- 10.2 < 50 Bar
- 10.3 50 – 350 Bar
- 10.4 351 – 700 Bar
- 10.5 701 – 1,000 Bar
- 10.6 > 1,000 Bar
Chapter 11 Market Estimates and Forecast, By Application, 2022 – 2035 (USD Billion) (Units)
- 11.1 Key trends
- 11.2 Flow control
- 11.3 Pressure control
- 11.4 Temperature control
- 11.5 Level control
- 11.6 Others
Chapter 12 Market Estimates and Forecast, By End User Industry, 2022 – 2035 (USD Billion) (Units)
- 12.1 Key trends
- 12.2 Oil & gas
- 12.3 Energy & power
- 12.4 Water & wastewater treatment
- 12.5 Chemicals & petrochemicals
- 12.6 Food & beverages
- 12.7 Pharmaceuticals
- 12.8 Metals & mining
- 12.9 Pulp & paper
- 12.10 Building & construction
- 12.11 Others
Chapter 13 Market Estimates and Forecast, By Distribution Channel, 2022 – 2035 (USD Billion) (Units)
- 13.1 Key trends
- 13.2 Direct sales
- 13.3 Indirect sales
Chapter 14 Market Estimates and Forecast, By Region, 2022 – 2035 (USD Billion) (Units)
- 14.1 Key trends
- 14.2 North America
- 14.2.1 U.S.
- 14.2.2 Canada
- 14.3 Europe
- 14.3.1 Germany
- 14.3.2 UK
- 14.3.3 France
- 14.3.4 Italy
- 14.3.5 Spain
- 14.4 Asia Pacific
- 14.4.1 China
- 14.4.2 Japan
- 14.4.3 India
- 14.4.4 Australia
- 14.4.5 South Korea
- 14.5 Latin America
- 14.5.1 Brazil
- 14.5.2 Mexico
- 14.5.3 Argentina
- 14.6 Middle East and Africa
- 14.6.1 South Africa
- 14.6.2 Saudi Arabia
- 14.6.3 UAE
Chapter 15 Company Profiles
- 15.1 Global players
- 15.1.1 Emerson Electric Co.
- 15.1.2 Flowserve Corporation
- 15.1.3 Valmet (Neles brand)
- 15.1.4 Baker Hughes (Masoneilan)
- 15.1.5 SAMSON AG
- 15.1.6 IMI plc
- 15.1.7 KSB SE & Co. KGaA
- 15.2 Regional players
- 15.2.1 CEPAI Group
- 15.2.2 Bray International
- 15.2.3 Neway Valve (Suzhou) Co.
- 15.2.4 Kitz Corporation
- 15.2.5 ARI-Armaturen
- 15.2.6 CIRCOR International
- 15.2.7 ARCA Regler GmbH
- 15.3 Emerging players
- 15.3.1 Burkert Fluid Control Systems
- 15.3.2 Azbil Corporation
- 15.3.3 Zhejiang SUPCON Fluid Technology
- 15.3.4 GEMU Group
- 15.3.5 Mokveld Valves BV
- 15.3.6 Curtiss-Wright Corporation
- 15.3.7 Velan Inc.

 2026年全球軸流閥市場報告
 全球控制閥市場規模、佔有率、趨勢和成長分析報告(2026-2034年)
 飛機氣壓閥市場報告:趨勢、預測與競爭分析(至2035年)
 傘閥市場規模、佔有率和成長分析:按材料、應用、閥門尺寸、最終用戶、分銷管道和地區分類-2026-2033年產業預測
 關鍵閥門市場規模、佔有率和成長分析:按閥門類型、材質、應用、最終用戶、分銷管道和地區分類-2026-2033年產業預測
 控制閥:市場佔有率分析、產業趨勢與統計、成長預測(2026-2031)
 控制閥市場:2026-2032年全球市場預測(依閥類型、材料類型、驅動技術、組件、閥門尺寸、工作模式、應用、終端用戶產業及銷售管道)
 全球控制閥市場(至 2032 年):按類型(旋轉式(球閥、蝶閥、旋塞閥)、線性式(截止閥、夾管閥、閘閥、隔膜閥、止回閥、電磁閥、針閥、固定錐閥)、閥門尺寸(小於 1 英寸、1-6 英寸、6-25 英寸、25-50 英寸)
 夾管閥市場 - 全球產業規模、佔有率、趨勢、機會、預測:按類型、材料、應用、地區和競爭格局分類,2021-2031年
 控制閥市場報告:按類型、技術、組件、材質、最終用途行業和地區分類(2026-2034 年)