

 |
市場調查報告書
商品編碼
2109162
資料中心CPU市場:商業機會、成長要素、產業趨勢分析及2026-2035年預測Data Center CPU Market Opportunity, Growth Drivers, Industry Trend Analysis, and Forecast 2026 - 2035 |
||||||

全球資料中心 CPU 市場預計到 2025 年將達到 233 億美元,並以 11.4% 的複合年成長率成長,到 2035 年將達到 683 億美元。
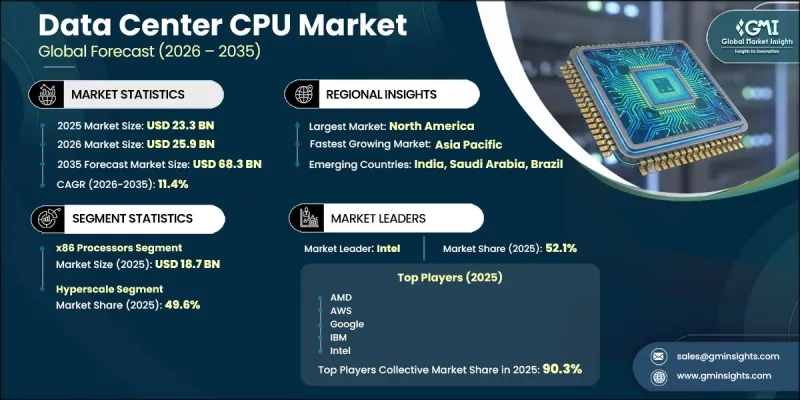
市場成長的驅動力來自對高效能運算基礎設施日益成長的需求、雲端運算的廣泛應用以及私營和政府部門對人工智慧 (AI) 工作負載投資的增加。隨著對可擴展處理能力的需求不斷成長,各組織機構擴大採用旨在處理日益複雜工作負載的先進處理器架構。儘管傳統處理器平台仍然佔據著重要地位,但隨著替代架構在現代資料中心環境中得到更廣泛的認可,市場競爭格局正在改變。跨多個地區的超大規模基礎設施建設正在為先進運算解決方案創造新的需求機會。同時,領先的科技公司正在不斷開發客製化的處理器平台,以最佳化效能、提高能源效率並減少對傳統運算模式的依賴。這些趨勢正在推動處理器創新超越傳統供應商,重塑資料中心 CPU 市場的競爭格局,並在雲端運算、企業基礎設施和專用運算應用領域創造新的機會。
| 市場範圍 | |
|---|---|
| 開始年份 | 2025 |
| 預測期 | 2026-2035 |
| 上市時的市場規模 | 233億美元 |
| 預測金額 | 683億美元 |
| 複合年成長率 | 11.4% |
到2025年,x86處理器市佔率將達到80.4%。憑藉其強大的軟體相容性、廣泛的生態系統支援以及在企業和雲端資料中心環境中大規模部署的成熟經驗,該領域將繼續保持領先地位。對可靠且可擴展的運算基礎設施的持續需求正在推動x86處理器的廣泛應用,而領先的處理器製造商也持續致力於效能提升,以滿足不斷變化的工作負載需求。
超大規模資料中心領域佔據49.6%的市場佔有率,預計2025年市場規模將達到115億美元。該領域的主導地位反映了全球運算能力日益集中於大規模資料中心營運。超大規模設施需要部署大規模處理器,以滿足不斷成長的數位服務、雲端平台和高容量運算需求。大規模資料中心園區的持續擴張正在產生對先進CPU的巨大需求,為整個產業創造了重要的採購機會。
北美資料中心CPU市佔率高達37%,預計到2025年市場規模將達86億美元。該地區的這一主導地位得益於雲端基礎設施供應商的強大實力、企業對伺服器技術的持續投入以及對先進運算能力日益成長的需求。人工智慧(AI)應用的日益普及和高效能運算基礎設施投資的增加,進一步推動了該全部區域私營和政府部門對處理器的需求。
目錄
第1章:調查方法
第2章執行摘要
第3章 行業洞察
- 產業生態系分析
- 供應商情況
- 利潤率
- 成本結構
- 每個階段增加的價值
- 影響價值鏈的因素
- 中斷
- 影響產業的因素
- 促進因素
- 超大規模資料中心的快速擴張正在推動CPU採購。
- 人工智慧和機器學習日益成長的工作量正在推高對 CPU 的需求。
- 企業數位轉型和伺服器升級正在加速CPU的普及。
- 邊緣運算的普及正在擴大 CPU 的部署範圍。
- 產業潛在風險與挑戰
- GPU 和 AI 加速器的普及性降低了 AI 訓練對 CPU 的需求。
- 大筆資本投資和較長的採購前置作業時間阻礙了買家。
- 市場機遇
- ARM 和 RISC-V 架構帶來的變革正在創造新的市場機會。
- 強制性能源效率和 PUE 法規正在推動 CPU 升級週期。
- 新興國家資料中心建設的擴張正在擴大目標市場。
- 促進因素
- 技術與創新展望
- 最新科技趨勢
- x86 CPU
- Chiplet架構
- 新興技術
- AI最佳化CPU
- 3D晶片堆疊和先進封裝
- 最新科技趨勢
- 成長潛力分析
- 監理情勢
- 北美洲
- 美國-聯邦貿易委員會(FTC)和司法部(DOJ)
- 加拿大競爭管理局
- 歐洲
- 歐盟-歐洲委員會(EC)
- 歐盟 - 歐洲資料保護委員會 (EDPB)
- 亞太地區
- 中國 - 國家市場監督管理總局(SAMR)
- 日本 - 日本公平交易委員會(JFTC)
- LATAM
- 墨西哥 - 聯邦經濟競爭委員會 (COFECE)
- 巴西 - 經濟與國防管理委員會 (CADE)
- 中東和非洲
- 沙烏地阿拉伯 - 競爭總局 (GAC)
- 南非 - 南非競爭委員會 (CCSA)
- 北美洲
- 波特的分析
- PESTLE分析
- 2025年成本細分分析
- 專利分析
- 2022-2025年貿易資料分析
- 進出口量及進口額趨勢
- 主要貿易路線及關稅的影響
- 生產能力和生產情況
- 設備產能:按地區和主要生產商分類,2025 年
- 運轉率和擴張計劃
- 功耗和能源效率基準
- 對不同CPU架構的TDP和功耗範圍進行基準測試
- 每瓦性能——x86、ARM 和 RISC-V 對比
- PUE 的影響以及 CPU 功耗在資料中心總能耗預算中的佔比。
- 資料中心容量和現有基礎設施
- 各國具體部署容量(兆瓦),2025 年及 2026 年
- 擴建計畫(2026-2030)
- 運轉率及供需狀況
- 人工智慧和生成式人工智慧對市場的影響
- 利用人工智慧改造現有經營模式
- 按細分市場分類的生成式人工智慧用例和部署藍圖
- 風險、限制和監管考量
- 預測假設和情境分析
- 基本案例:驅動複合年成長率的關鍵宏觀經濟與產業變量
- 樂觀情境:宏觀經濟與產業的順風
- 悲觀情景:宏觀經濟放緩或產業逆風
第4章 競爭情勢
- 介紹
- 北美洲
- 歐洲
- 亞太地區
- LATAM
- 中東和非洲
- 前十強企業的生產與銷售分析
- 主要市場公司的競爭分析
- 競爭定位矩陣
- 主要進展
- 併購
- 夥伴關係和聯盟
- 新產品發布
- 業務拓展計劃及資金籌措
- 按公司規模進行基準測試
- 排名分類標準與遴選標準
- 按銷售額、地區和創新能力分類的層級定位矩陣。
第5章 市場估算與預測:依處理器架構分類,2022-2035年
- x86處理器
- 基於ARM的處理器
- RISC-V處理器
- Power/SPARC 和其他專有架構
第6章 市場估計與預測:依資料中心分類,2022-2035年
- 超大規模
- 公司
- 搭配
- 邊緣
第7章 市場估計與預測:以核心數量分類,2022-2035年
- 低核心數(8個核心或更少)
- 中型核心數(9-32核心)
- 高核心數(超過 32 個核心)
第8章 市場估算與預測:伺服器外形規格,2022-2035年
- 機架式伺服器(1U/2U/4U)
- 刀鋒伺服器
- 塔式伺服器
- 微型伺服器
第9章 市場估計與預測:依最終用途分類,2022-2035年
- 公司
- 政府/國防
- 研究機構
第10章 市場估價與預測:依地區分類,2022-2035年
- 北美洲
- 美國
- 加拿大
- 歐洲
- 德國
- 英國
- 法國
- 義大利
- 西班牙
- 荷蘭
- 丹麥
- 瑞典
- 挪威
- 亞太地區
- 中國
- 印度
- 日本
- 韓國
- 澳洲
- 新加坡
- 泰國
- 印尼
- 馬來西亞
- 拉丁美洲
- 巴西
- 墨西哥
- 阿根廷
- 智利
- 中東和非洲
- 南非
- 沙烏地阿拉伯
- UAE
第11章:公司簡介
- 世界公司
- Intel
- AMD
- Ampere Computing
- Arm Holdings
- NVIDIA
- IBM
- Amazon Web Services
- Microsoft
- Qualcomm
- 當地公司
- Alibaba Cloud
- Phytium Technology
- Loongson Technology
- HiSilicon Technology
- Hygon Information Technology
- SiPearl
- Fujitsu
- 新興企業
- Tenstorrent
- Tachyum
- Ainekko
The Global Data Center CPU Market was valued at USD 23.3 billion in 2025 and is estimated to grow at a CAGR of 11.4% to reach USD 68.3 billion by 2035.
Market growth is driven by increasing demand for high-performance computing infrastructure, expanding cloud deployments, and rising investments in artificial intelligence-driven workloads across commercial and government sectors. The growing need for scalable processing capabilities is encouraging organizations to adopt advanced processor architectures designed to support increasingly complex workloads. The market is witnessing a competitive shift as traditional processor platforms continue to maintain a strong position while alternative architectures gain wider acceptance across modern data center environments. Expanding hyperscale infrastructure development across multiple regions is creating new demand opportunities for advanced computing solutions. At the same time, major technology companies are increasingly developing customized processor platforms to optimize performance, improve energy efficiency, and reduce dependence on traditional computing models. These developments are reshaping the competitive landscape of the data center CPU market by expanding processor innovation beyond conventional suppliers and creating new opportunities across cloud computing, enterprise infrastructure, and specialized computing applications.
| Market Scope | |
|---|---|
| Start Year | 2025 |
| Forecast Year | 2026-2035 |
| Start Value | $23.3 Billion |
| Forecast Value | $68.3 Billion |
| CAGR | 11.4% |
The x86 processor segment accounted for an 80.4% share in 2025. The segment continues to maintain its dominant position due to strong software compatibility, extensive ecosystem support, and a large installed base across enterprise and cloud data center environments. Continued demand for reliable and scalable computing infrastructure supports the widespread adoption of x86-based processors, while established processor manufacturers continue enhancing performance capabilities to address evolving workload requirements.
The hyperscale data center segment held a 49.6% share, generating USD 11.5 billion in 2025. The segment's leadership reflects the growing concentration of global computing capacity within large-scale data center operations. Hyperscale facilities require extensive processor deployments to support expanding digital services, cloud platforms, and high-volume computing requirements. The continued expansion of large data center campuses is generating substantial demand for advanced CPUs and creating significant procurement opportunities across the industry.
North America Data Center CPU Market held a 37% share, generating USD 8.6 billion in 2025. Regional dominance is supported by the strong presence of cloud infrastructure providers, continuous enterprise investments in server technologies, and increasing demand for advanced computing capabilities. Growing adoption of artificial intelligence applications and expanding investments in high-performance computing infrastructure are further supporting processor demand across commercial and government sectors throughout the region.
Major companies operating in the global data center CPU market include Intel, AMD, Ampere Computing, Arm Holdings, NVIDIA, IBM, Amazon Web Services, Google, Microsoft, Qualcomm, Alibaba Cloud, Phytium Technology, Loongson Technology, HiSilicon Technology, Hygon Information Technology, SiPearl, Fujitsu, Tenstorrent, Tachyum, and Ainekko. Companies operating in the data center CPU market are strengthening their market position through processor innovation, strategic partnerships, and continuous investments in research and development. Leading players are focusing on improving processing performance, energy efficiency, scalability, and workload optimization to address the growing requirements of cloud computing and artificial intelligence applications. Businesses are also expanding their processor portfolios across different architectures to serve diverse customer needs and emerging computing environments. Strategic collaborations with cloud providers, software developers, and technology partners help companies accelerate ecosystem development and increase adoption.
Table of Contents
Chapter 1 Research Methodology
- 1.1 Research approach
- 1.2 Quality Commitments
- 1.2.1 GMI AI policy & data integrity commitment
- 1.3 Research Trail & Confidence Scoring
- 1.3.1 Research Trail Components
- 1.3.2 Scoring Components
- 1.4 Data Collection
- 1.5 Data mining sources
- 1.5.1 Paid sources
- 1.6 Base estimates and calculations
- 1.6.1 Base year calculation
- 1.7 Forecast model
- 1.7.1 Quantified market impact analysis
- 1.8 Research transparency addendum
- 1.8.1 Source attribution framework
- 1.8.2 Quality assurance metrics
- 1.8.3 Our commitment to trust
Chapter 2 Executive Summary
- 2.1 Industry 360° synopsis
- 2.2 Key market trends
- 2.2.1 Regional
- 2.2.2 Processor Architecture
- 2.2.3 Data Center
- 2.2.4 Core Count
- 2.2.5 Server Form Factor
- 2.2.6 End Use
- 2.3 TAM analysis, 2026-2035
- 2.4 CXO perspectives: Strategic imperatives
Chapter 3 Industry Insights
- 3.1 Industry ecosystem analysis
- 3.1.1 Supplier landscape
- 3.1.2 Profit margin
- 3.1.3 Cost structure
- 3.1.4 Value addition at each stage
- 3.1.5 Factor affecting the value chain
- 3.1.6 Disruptions
- 3.2 Industry impact forces
- 3.2.1 Growth drivers
- 3.2.1.1 Rapid Hyperscale Data Center Expansion Driving CPU Procurement
- 3.2.1.2 AI & Machine Learning Workload Growth Amplifying CPU Demand
- 3.2.1.3 Enterprise Digital Transformation & Server Refresh Accelerating CPU Deployment
- 3.2.1.4 Edge Computing Proliferation Extending CPU Deployment
- 3.2.2 Industry pitfalls and challenges
- 3.2.2.1 GPU & AI Accelerator Displacement Reducing CPU Demand in AI Training
- 3.2.2.2 High Capital Expenditure & Extended Procurement Lead Times Constraining Buyers
- 3.2.3 Market opportunities
- 3.2.3.1 ARM & RISC-V Architecture Disruption Creating New Market Opportunities
- 3.2.3.2 Energy Efficiency Mandates & PUE Regulations Driving CPU Upgrade Cycles
- 3.2.3.3 Emerging Economy Data Center Buildouts Expanding Addressable Market
- 3.2.1 Growth drivers
- 3.3 Technology and innovation landscape
- 3.3.1 Current technological trends
- 3.3.1.1 x86 CPUs
- 3.3.1.2 Chiplet Architecture
- 3.3.2 Emerging technologies
- 3.3.2.1 AI-Optimized CPUs
- 3.3.2.2 3D Chip Stacking & Advanced Packaging
- 3.3.1 Current technological trends
- 3.4 Growth potential analysis
- 3.5 Regulatory landscape
- 3.5.1 North America
- 3.5.1.1 US - Federal Trade Commission (FTC) & Department of Justice (DOJ)
- 3.5.1.2 Canada - Competition Bureau
- 3.5.2 Europe
- 3.5.2.1 EU - European Commission (EC)
- 3.5.2.2 EU - European Data Protection Board (EDPB)
- 3.5.3 Asia Pacific
- 3.5.3.1 China - State Administration for Market Regulation (SAMR)
- 3.5.3.2 Japan - Japan Fair Trade Commission (JFTC)
- 3.5.4 LATAM
- 3.5.4.1 Mexico - Federal Economic Competition Commission (COFECE)
- 3.5.4.2 Brazil - Administrative Council for Economic Defense (CADE)
- 3.5.5 MEA
- 3.5.5.1 Saudi Arabia - General Authority for Competition (GAC)
- 3.5.5.2 South Africa - Competition Commission of South Africa (CCSA)
- 3.5.1 North America
- 3.6 Porter’s analysis
- 3.7 PESTEL analysis
- 3.8 Cost breakdown analysis, 2025
- 3.9 Patent analysis (Driven by Primary Research)
- 3.10 Trade Data Analysis, 2022-2025 (Driven by Paid Database)
- 3.10.1 Import/Export Volume & Value Trends
- 3.10.2 Key Trade Corridors & Tariff Impact
- 3.11 Capacity & Production Landscape (Driven by Primary Research)
- 3.11.1 Installed Capacity by Region & Key Producer, 2025
- 3.11.2 Capacity Utilization Rates & Expansion Pipelines
- 3.12 Power Consumption & Energy Efficiency Benchmarking
- 3.12.1 TDP & Power Envelope Benchmarking Across CPU Architectures
- 3.12.2 Performance-per-Watt Metrics - x86 vs. ARM vs. RISC-V
- 3.12.3 PUE Impact & CPU Power Contribution in Total Data Center Energy Budget
- 3.13 Data Center Capacity & Infrastructure Landscape
- 3.13.1 Installed capacity (MW) by country, 2025 & 2026
- 3.13.2 Expansion pipeline (2026-2030)
- 3.13.3 Utilization rates & supply-demand
- 3.14 Impact of AI & generative AI on the market
- 3.14.1 AI-driven disruption of existing business models
- 3.14.2 GenAI use cases & adoption roadmap by segment
- 3.14.3 Risks, limitations & regulatory considerations
- 3.15 Forecast assumptions & scenario analysis (Driven by Primary Research)
- 3.15.1 Base Case- Key Macro & Industry Variables Driving CAGR
- 3.15.2 Optimistic Scenarios- Favorable macro and industry tailwinds
- 3.15.3 Pessimistic Scenario - Macroeconomic slowdown or industry headwinds
Chapter 4 Competitive Landscape, 2025
- 4.1 Introduction
- 4.2 Company market share analysis (value and volume), 2022-2025
- 4.2.1 North America
- 4.2.2 Europe
- 4.2.3 Asia Pacific
- 4.2.4 LATAM
- 4.2.5 MEA
- 4.3 Top 10 Company production & sales analysis, 2022-2035
- 4.4 Competitive analysis of major market players
- 4.5 Competitive positioning matrix
- 4.6 Key developments
- 4.6.1 Mergers & acquisitions
- 4.6.2 Partnerships & collaborations
- 4.6.3 New product launches
- 4.6.4 Expansion plans and funding
- 4.7 Company tier benchmarking
- 4.7.1 Tier classification criteria & qualifying thresholds
- 4.7.2 Tier positioning matrix by revenue, geography & innovation
Chapter 5 Market Estimates and Forecast, By Processor Architecture, 2022 – 2035 ($ Mn, Units)
- 5.1 Key trends
- 5.2 x86 Processors
- 5.3 ARM-Based Processors
- 5.4 RISC-V Processors
- 5.5 Power/SPARC & Other Proprietary Architectures
Chapter 6 Market Estimates and Forecast, By Data Center, 2022 – 2035 ($ Mn, Units)
- 6.1 Key trends
- 6.2 Hyperscale
- 6.3 Enterprise
- 6.4 Colocation
- 6.5 Edge
Chapter 7 Market Estimates and Forecast, By Core Count, 2022 – 2035 ($ Mn, Units)
- 7.1 Key trends
- 7.2 Low-Core (≤8 Cores)
- 7.3 Medium-Core (9–32 Cores)
- 7.4 High-Core (>32 Cores)
Chapter 8 Market Estimates and Forecast, By Server Form Factor, 2022 – 2035 ($ Mn, Units)
- 8.1 Key trends
- 8.2 Rack Servers (1U/2U/4U)
- 8.3 Blade Servers
- 8.4 Tower Servers
- 8.5 Microservers
Chapter 9 Market Estimates and Forecast, By End Use, 2022 – 2035 ($ Mn, Units)
- 9.1 Key trends
- 9.2 Enterprises
- 9.3 Government & Defense
- 9.4 Research Institutions
Chapter 10 Market Estimates & Forecast, By Region, 2022 - 2035 ($ Mn, Units)
- 10.1 Key trends
- 10.2 North America
- 10.2.1 US
- 10.2.2 Canada
- 10.3 Europe
- 10.3.1 Germany
- 10.3.2 UK
- 10.3.3 France
- 10.3.4 Italy
- 10.3.5 Spain
- 10.3.6 Netherlands
- 10.3.7 Denmark
- 10.3.8 Sweden
- 10.3.9 Norway
- 10.4 Asia Pacific
- 10.4.1 China
- 10.4.2 India
- 10.4.3 Japan
- 10.4.4 South Korea
- 10.4.5 Australia
- 10.4.6 Singapore
- 10.4.7 Thailand
- 10.4.8 Indonesia
- 10.4.9 Malaysia
- 10.5 Latin America
- 10.5.1 Brazil
- 10.5.2 Mexico
- 10.5.3 Argentina
- 10.5.4 Chile
- 10.6 MEA
- 10.6.1 South Africa
- 10.6.2 Saudi Arabia
- 10.6.3 UAE
Chapter 11 Company Profiles
- 11.1 Global players
- 11.1.1 Intel
- 11.1.2 AMD
- 11.1.3 Ampere Computing
- 11.1.4 Arm Holdings
- 11.1.5 NVIDIA
- 11.1.6 IBM
- 11.1.7 Amazon Web Services
- 11.1.8 Google
- 11.1.9 Microsoft
- 11.1.10 Qualcomm
- 11.2 Regional players
- 11.2.1 Alibaba Cloud
- 11.2.2 Phytium Technology
- 11.2.3 Loongson Technology
- 11.2.4 HiSilicon Technology
- 11.2.5 Hygon Information Technology
- 11.2.6 SiPearl
- 11.2.7 Fujitsu
- 11.3 Emerging players
- 11.3.1 Tenstorrent
- 11.3.2 Tachyum
- 11.3.3 Ainekko

 2026-2034年全球資料中心CPU市場規模、佔有率、趨勢與成長分析報告
 2026年全球資料中心晶片市場報告
 全球資料中心半導體市場:按處理器、DRAM/NAND、感測器、連接和電源分類-預測(至2029年)
 全球資料中心晶片市場:按組件、資料中心規模、應用、最終用戶和地區分類-預測至2032年
 SiC/GaN功率半導體突破了「AI電力牆」,重塑了資料中心電源
 資料中心晶片市場:2026-2032年全球市場預測(按產品類型、技術、製程技術、應用和最終用戶分類)全球資料中心晶片市場規模、佔有率、趨勢和成長分析報告(2026-2034)
 人工智慧和資料中心晶片市場分析及預測(至2035年):按類型、產品類型、服務、技術、組件、應用、形式、材料類型、部署形式和最終用戶分類
 資料中心CPU市場:全球市場分析、市場規模、市場佔有率及按晶片類型、資料中心規模、產業、國家及地區分類的預測-2025-2032年PCIe連接器市場分析及至2035年預測:按類型、產品、技術、組件、應用、材質、設備、最終用戶和功能分類