


 |
市場調查報告書
商品編碼
2101961
空氣污染控制設備市場:商機、成長要素、產業趨勢分析及2026-2035年預測Air Pollution Control Equipment Market Opportunity, Growth Drivers, Industry Trend Analysis, and Forecast 2026 - 2035 |
||||||

全球空氣污染控制設備市場預計到 2025 年將達到 911 億美元,年複合成長率為 5.4%,到 2035 年將達到 1,546 億美元。
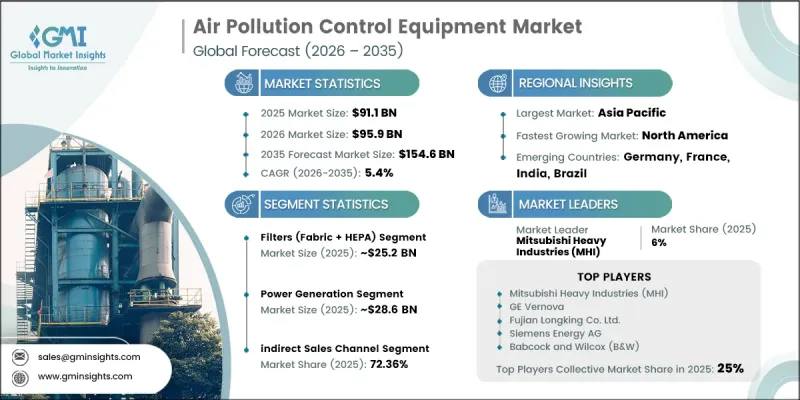
市場擴張主要得益於電力、水泥、化學和冶金等產業的持續投資。這是因為企業不斷升級其排放控制基礎設施,以符合日益嚴格的環境法規。隨著減少工業排放、改善空氣品質和滿足監管合規要求變得愈發重要,先進污染控制技術的廣泛應用也得到了促進。許多國家的政府持續收緊工業設施的排放標準,從而對先進的過濾和減排系統產生了穩定的需求。同時,新興經濟體的快速工業化、城市擴張和製造業活動的成長也為設備供應商創造了新的機會。工業運營商正在投資先進的系統,以提高營運效率並減少顆粒物排放和有害污染物。老舊工業設施的持續現代化改造,以及新建工廠和基礎設施項目的資本投入增加,進一步推動了市場的長期成長。技術進步、能源效率的提高、數位監測能力的增強以及對永續工業實踐的日益重視,持續推動已開發經濟體和新興經濟體空氣污染控制設備市場的擴張。
| 市場範圍 | |
|---|---|
| 開始年份 | 2025 |
| 預測期 | 2026-2035 |
| 初始市場規模 | 911億美元 |
| 預測金額 | 1546億美元 |
| 複合年成長率 | 5.4% |
預計到2025年,過濾器市佔率將達到27.61%,市場規模將達252億美元。這主要得益於各行業對有效顆粒物控制的需求不斷成長,以滿足環境法規標準。過濾效率、耐用性和運作性能的持續提升,進一步加速了過濾器在工業製造設施中的應用,因為可靠的排放控制對於確保合規性和營運效率至關重要。
預計到2025年,發電業將佔據28.57%的市場佔有率,市場規模達286億美元,2026年至2035年的複合年成長率(CAGR)為4.8%。市場成長主要得益於發電設施對減排技術的持續投資。營運商不斷升級現有基礎設施,並在新設施中安裝先進的污染控制系統,以符合不斷變化的環境標準,並提高長期營運的永續性。
預計到2025年,北美空氣污染控制設備市場規模將達到258億美元,市佔率為28.36%,並將在2035年之前以4.5%的複合年成長率成長。該地區市場持續受益於完善的環境法規、工業設施的不斷現代化以及對減排技術的穩步投資。除了不斷更新老舊的污染控制基礎設施外,更嚴格的監管合規要求和持續的工業活動預計也將維持全部區域對先進空氣污染控制設備的長期需求。
目錄
第1章:調查方法
第2章執行摘要
第3章 行業洞察
- 產業生態系分析
- 影響價值鏈的因素
- 利潤率分析
- 中斷
- 前景
- 製造商
- 中斷
- 供應商情況
- 主要新聞和舉措
- 技術與創新展望
- 監理情勢
- 對產業的影響
- 促進因素
- 產業潛在風險與挑戰
- 機會
- 波特的分析
- PESTLE分析
- 價格分析
- 2019-2024年歷史價格趨勢分析
- 定價策略:按業務類型分類
- 貿易數據分析
- 進出口量及進口額趨勢
- 主要貿易路線及關稅的影響
- 人工智慧和生成式人工智慧對市場的影響
- 利用人工智慧改造現有經營模式
- 按細分市場分類的生成式人工智慧用例和部署藍圖
- 風險、限制和監管考量
- 生產能力和生產情況
- 按地區和主要生產商分類的已安裝產能
- 運轉率和擴張計劃
第4章 競爭情勢
- 介紹
- 企業市佔率分析
- 競爭定位矩陣
- 戰略展望矩陣
- 主要市場公司的競爭分析
- 主要進展
- 併購
- 夥伴關係和聯盟
- 新產品發布
- 業務拓展計劃
第5章 市場估算與預測:依產品類型分類,2022-2035年
- 靜電集塵器(ESP)
- 乾式靜電集塵器
- 濕式靜電集塵器
- 洗滌器
- 濕式洗滌器
- 乾式洗滌器
- 生物洗滌器/生物過濾器
- 過濾器(布質+HEPA)
- 脈衝噴氣式袋式除塵器
- 反向氣囊屋
- 搖床式袋式除塵器
- 排煙脫硫(FGD)系統
- 濕式煙氣脫硫
- 乾式煙氣脫硫
- 半乾式煙氣脫硫
- 選擇性催化還原(SCR)系統
- 氧化劑
- 熱氧化裝置
- 催化氧化裝置
- 蓄熱式熱氧化系統(RTO)
- 集霧器
- 其他技術(活性碳吸附、等離子體系統、紫外線氧化)
第6章 市場估計與預測:依污染物類型分類,2022-2035年
- 顆粒物(PM)的監管
- 針對粗顆粒物(PM10)的措施
- 針對細懸浮微粒(PM2.5)的措施
- 氣態污染物(SOx 和 NOx)的監管
- 二氧化硫(SOx)應對措施
- 氮氧化物(NOx)的調控
- 揮發性有機化合物(VOCs)和有害空氣污染物(HAPs)的監管
- 汞和重金屬的控制
- 其他(除臭、一氧化碳控制、多污染物混合系統)
第7章 市場估計與預測:依應用領域分類,2022-2035年
- 發電
- 化工/石油化工
- 水泥和骨材
- 冶金(鐵、鋼和非鐵金屬)
- 汽車/金屬加工
- 礦業
- 製藥
- 食品/飲料
- 其他(廢棄物焚化、紙漿和造紙、玻璃製造)
第8章 市場估算與預測:依安裝類型分類,2022-2035年
- 待開發區/新安裝
- 建立新的工業設施
- 新電廠的安裝
- 維修和升級
- 為遵守法規而進行的維修
- 為提升性能和擴大產能而進行的維修
第9章 市場估價與預測:依通路分類,2022-2035年
- 直銷
- 間接銷售
第10章:預測:依地區分類,2022-2035年
- 北美洲
- 美國
- 加拿大
- 歐洲
- 德國
- 英國
- 法國
- 義大利
- 西班牙
- 亞太地區
- 中國
- 印度
- 日本
- 韓國
- 澳洲
- 拉丁美洲
- 巴西
- 墨西哥
- 阿根廷
- 中東和非洲
- UAE
- 沙烏地阿拉伯
- 南非
第11章:公司簡介
- 世界公司
- Mitsubishi Heavy Industries(MHI)
- GE Vernova(Steam Power Division)
- Siemens Energy AG
- Babcock & Wilcox(B&W)
- CECO Environmental Corporation
- Durr AG
- GEA Group AG
- Donaldson Company, Inc.
- 本地公司
- Fujian Longking Co., Ltd.
- Zhejiang Feida Environmental Science & Technology Co.
- Thermax Limited
- Andritz AG
- Scheuch GmbH
- Doosan Lentjes GmbH
- KC Cottrell Co., Ltd.
- Hamon Group
- 新興企業
- Redecam Group SpA
- Anguil Environmental Systems
- John Zink Hamworthy Combustion
- Airnord
- Nederman Holding AB
The Global Air Pollution Control Equipment Market was valued at USD 91.1 billion in 2025 and is estimated to grow at a CAGR of 5.4% to reach USD 154.6 billion by 2035.
Market expansion is driven by sustained investments across industries including power generation, cement, chemicals, and metallurgy as companies continue upgrading emission control infrastructure to comply with increasingly stringent environmental regulations. Growing emphasis on reducing industrial emissions, improving air quality, and meeting regulatory compliance requirements is encouraging widespread adoption of advanced pollution control technologies. Governments across numerous countries continue strengthening emission standards for industrial facilities, creating consistent demand for modern filtration and emission abatement systems. At the same time, rapid industrialization, urban expansion, and increasing manufacturing activities across emerging economies are generating new opportunities for equipment suppliers. Industrial operators are investing in advanced systems that improve operational efficiency while reducing particulate emissions and harmful pollutants. Continuous modernization of aging industrial facilities, together with rising capital expenditure on new manufacturing plants and infrastructure projects, is further supporting long-term market growth. Technological advancements, improved energy efficiency, digital monitoring capabilities, and increasing focus on sustainable industrial operations continue to reinforce the expansion of the air pollution control equipment market across both developed and emerging economies.
| Market Scope | |
|---|---|
| Start Year | 2025 |
| Forecast Year | 2026-2035 |
| Start Value | $91.1 Billion |
| Forecast Value | $154.6 Billion |
| CAGR | 5.4% |
The filters segment held 27.61% share in 2025, equivalent to USD 25.2 billion, supported by increasing demand from industries requiring effective particulate control to meet environmental compliance standards. Continuous improvements in filtration efficiency, durability, and operational performance are encouraging greater adoption across industrial manufacturing facilities where reliable emission control remains essential for maintaining regulatory compliance and operational productivity.
The power generation segment accounted for 28.57% share in 2025, representing USD 28.6 billion, and is expected to grow at a CAGR of 4.8% between 2026 and 2035. Market growth is supported by ongoing investments in emission reduction technologies across electricity generation facilities. Operators continue upgrading existing infrastructure while incorporating advanced pollution control systems into new facilities to comply with evolving environmental standards and improve long-term operational sustainability.
North America Air Pollution Control Equipment Market held 28.36% share in 2025, generating USD 25.8 billion, and is forecast to grow at a CAGR of 4.5% through 2035. The regional market continues to benefit from established environmental regulations, continuous modernization of industrial facilities, and steady investment in emission reduction technologies. Ongoing replacement of aging pollution control infrastructure, combined with increasing regulatory compliance requirements and continued industrial activity, is expected to sustain long-term demand for advanced air pollution control equipment throughout the region.
Key players in the global air pollution control equipment market Andritz AG, GEA Group AG, Siemens Energy AG, Donaldson Company, Inc., CECO Environmental Corporation, Mitsubishi Heavy Industries (MHI), Thermax Limited, Durr AG, GE Vernova, Babcock & Wilcox (B&W), John Zink Hamworthy Combustion, Hamon Group, KC Cottrell Co., Ltd., Fujian Longking Co., Ltd., Doosan Lentjes GmbH, Nederman Holding AB, Redecam Group S.p.A., Scheuch GmbH, Airnord, Anguil Environmental Systems. Companies operating in the air pollution control equipment market are strengthening their market position by investing in advanced filtration technologies, expanding product portfolios, and developing high-efficiency emission control systems that address evolving environmental standards. Manufacturers are focusing on research and development to improve energy efficiency, reduce operating costs, and enhance equipment reliability. Strategic partnerships, acquisitions, and collaborations with industrial customers are enabling companies to broaden their geographic presence and strengthen customer relationships. Businesses are also investing in digital monitoring solutions, predictive maintenance technologies, and integrated automation systems to improve equipment performance and lifecycle management.
Table of Contents
Chapter 1 Research Methodology
- 1.1 Research approach
- 1.2 Quality Commitments
- 1.2.1 GMI AI policy & data integrity commitment
- 1.2.1.1 Source consistency protocol
- 1.2.1 GMI AI policy & data integrity commitment
- 1.3 Research Trail & Confidence Scoring
- 1.3.1 Research Trail Components
- 1.3.2 Scoring Components
- 1.4 Data Collection
- 1.4.1 Partial list of primary sources
- 1.5 Data mining sources
- 1.5.1 Paid sources
- 1.5.1.1 Sources, by region
- 1.5.1 Paid sources
- 1.6 Base estimates and calculations
- 1.6.1 Base year calculation for any one approach
- 1.7 Forecast model
- 1.7.1 Quantified market impact analysis
- 1.7.1.1 Mathematical impact of growth parameters on forecast
- 1.7.1 Quantified market impact analysis
- 1.8 Research transparency addendum
- 1.8.1 Source attribution framework
- 1.8.2 Quality assurance metrics
- 1.8.3 Our commitment to trust
Chapter 2 Executive Summary
- 2.1 Industry 360° synopsis, 2022 - 2035
- 2.2 Key market trends
- 2.2.1 Regional
- 2.2.2 Product Type
- 2.2.3 Pollutant Type
- 2.2.4 Application
- 2.2.5 Installation Type
- 2.2.6 Distribution Channel
Chapter 3 Industry Insights
- 3.1 Industry ecosystem analysis
- 3.1.1 Factor affecting the value chain
- 3.1.2 Profit margin analysis
- 3.1.3 Disruptions
- 3.1.4 Future outlook
- 3.1.5 Manufacturers
- 3.1.6 Distributors
- 3.2 Supplier landscape
- 3.3 Key news & initiatives
- 3.4 Technology & Innovation Landscape
- 3.5 Regulatory landscape
- 3.6 Impact on forces
- 3.6.1 Growth drivers
- 3.6.2 Industry pitfalls & challenges
- 3.6.3 Opportunities
- 3.7 Porter's analysis
- 3.8 PESTEL analysis
- 3.9 Pricing analysis (driven by primary research)
- 3.9.1 Historical Price Trend Analysis, 2019-2024 (Driven by Primary Research)
- 3.9.2 Pricing Strategy by Player Type (Driven by Primary Research)
- 3.10 Trade data analysis (driven by paid database)
- 3.10.1 Import/Export Volume & Value Trends (Driven by Primary Research)
- 3.10.2 Key Trade Corridors & Tariff Impact (Driven by Primary Research)
- 3.11 Impact of AI & Generative AI on the Market
- 3.11.1 AI-Driven Disruption of Existing Business Models
- 3.11.2 GenAI Use Cases & Adoption Roadmap by Segment
- 3.11.3 Risks, Limitations & Regulatory Considerations
- 3.12 Capacity & Production Landscape (Driven by Primary Research)
- 3.12.1 Manufacturing Capacity Installed by Region & Key Producer (Driven by Primary Research)
- 3.12.2 Capacity Utilization Rates & Expansion Pipelines (Driven by Primary Research)
Chapter 4 Competitive Landscape, 2025
- 4.1 Introduction
- 4.2 Company market share analysis
- 4.3 Competitive positioning matrix
- 4.4 Strategic outlook matrix
- 4.5 Competitive analysis of major market players
- 4.6 Key developments
- 4.6.1 Mergers & acquisitions
- 4.6.2 Partnerships & collaborations
- 4.6.3 New product launches
- 4.6.4 Expansion plans
Chapter 5 Market Estimates and Forecast, By Product Type, 2022 - 2035 (USD Billion, Units)
- 5.1 Key trends
- 5.2 Electrostatic Precipitators (ESP)
- 5.2.1 Dry Electrostatic Precipitators
- 5.2.2 Wet Electrostatic Precipitators
- 5.3 Scrubbers
- 5.3.1 Wet Scrubbers
- 5.3.2 Dry Scrubbers
- 5.3.3 Bioscrubbers/Biofilters
- 5.4 Filters (Fabric + HEPA)
- 5.4.1 Pulse-Jet Baghouse
- 5.4.2 Reverse-Air Baghouse
- 5.4.3 Shaker Baghouse
- 5.5 Flue Gas Desulfurization (FGD) Systems
- 5.5.1 Wet FGD
- 5.5.2 Dry FGD
- 5.5.3 Semi-Dry FGD
- 5.6 Selective Catalytic Reduction (SCR) Systems
- 5.7 Oxidizers
- 5.7.1 Thermal Oxidizers
- 5.7.2 Catalytic Oxidizers
- 5.7.3 Regenerative Thermal Oxidizers (RTO)
- 5.8 Mist Collectors
- 5.9 Others (Activated Carbon Adsorption, Plasma Systems, UV Oxidation)
Chapter 6 Market Estimates and Forecast, By Pollutant Type, 2022 - 2035 (USD Billion, Units)
- 6.1 Key trends
- 6.2 Particulate Matter (PM) Control
- 6.2.1 Coarse Particulate (PM10) Control
- 6.2.2 Fine Particulate (PM2.5) Control
- 6.3 Gaseous Pollutant Control (SOx & NOx)
- 6.3.1 Sulfur Dioxide (SOx) Control
- 6.3.2 Nitrogen Oxide (NOx) Control
- 6.4 Volatile Organic Compounds (VOC) & Hazardous Air Pollutants (HAP) Control
- 6.5 Mercury & Heavy Metal Control
- 6.6 Others (Odor Control, CO Control, Multi-Pollutant Hybrid Systems)
Chapter 7 Market Estimates and Forecast, By Application, 2022 - 2035 (USD Billion, Units)
- 7.1 Key trends
- 7.2 Power Generation
- 7.3 Chemical & Petrochemical
- 7.4 Cement & Aggregates
- 7.5 Metallurgical (Steel & Non-Ferrous Metals)
- 7.6 Automotive & Metal Processing
- 7.7 Mining
- 7.8 Pharmaceuticals
- 7.9 Food & Beverage
- 7.10 Others (Waste Incineration, Pulp & Paper, Glass Manufacturing)
Chapter 8 Market Estimates and Forecast, By Installation Type, 2022 - 2035 (USD Billion, Units)
- 8.1 Key trends
- 8.2 Greenfield / New Installation
- 8.2.1 New Industrial Facility Installations
- 8.2.2 New Power Plant Installations
- 8.3 Retrofit & Upgrade
- 8.3.1 Regulatory Compliance-Driven Retrofits
- 8.3.2 Performance Upgrade & Capacity Expansion Retrofits
Chapter 9 Market Estimates and Forecast, By Distribution Channel, 2022 - 2035 (USD Billion, Units)
- 9.1 Key trends
- 9.2 Direct Sales
- 9.3 Indirect Sales
Chapter 10 Forecast, By Region, 2022 - 2035, (USD Billion, Thousand Units)
- 10.1 Key trends
- 10.2 North America
- 10.2.1 U.S.
- 10.2.2 Canada
- 10.3 Europe
- 10.3.1 Germany
- 10.3.2 U.K.
- 10.3.3 France
- 10.3.4 Italy
- 10.3.5 Spain
- 10.4 Asia Pacific
- 10.4.1 China
- 10.4.2 India
- 10.4.3 Japan
- 10.4.4 South Korea
- 10.4.5 Australia
- 10.5 Latin America
- 10.5.1 Brazil
- 10.5.2 Mexico
- 10.5.3 Argentina
- 10.6 MEA
- 10.6.1 UAE
- 10.6.2 Saudi Arabia
- 10.6.3 South Africa
Chapter 11 Company Profiles
- 11.1 Global players
- 11.1.1 Mitsubishi Heavy Industries (MHI)
- 11.1.2 GE Vernova (Steam Power Division)
- 11.1.3 Siemens Energy AG
- 11.1.4 Babcock & Wilcox (B&W)
- 11.1.5 CECO Environmental Corporation
- 11.1.6 Durr AG
- 11.1.7 GEA Group AG
- 11.1.8 Donaldson Company, Inc.
- 11.2 Regional players
- 11.2.1 Fujian Longking Co., Ltd.
- 11.2.2 Zhejiang Feida Environmental Science & Technology Co.
- 11.2.3 Thermax Limited
- 11.2.4 Andritz AG
- 11.2.5 Scheuch GmbH
- 11.2.6 Doosan Lentjes GmbH
- 11.2.7 KC Cottrell Co., Ltd.
- 11.2.8 Hamon Group
- 11.3 Emerging players
- 11.3.1 Redecam Group S.p.A.
- 11.3.2 Anguil Environmental Systems
- 11.3.3 John Zink Hamworthy Combustion
- 11.3.4 Airnord
- 11.3.5 Nederman Holding AB

 服飾去漬服務:2026年全球市場報告
 汽車碳罐市場:按類型、車輛類型、應用、國家和地區分類-全球產業分析、市場規模、市場佔有率及2026-2033年預測
 工業空氣污染控制解決方案:市場佔有率分析、行業趨勢和統計數據、成長預測(2026-2031 年)
 淤泥簾市場規模、佔有率和成長分析:按類型、產品類型、材料、應用、分銷管道和地區分類-2026-2033年產業預測淤泥簾:市場佔有率分析、產業趨勢與統計、成長預測(2026-2031)
 2026-2030年全球空氣污染控制市場
 先進海洋廢棄物回收設備市場分析及預測(至2035年):依類型、技術、應用、組件、最終用戶、產品類型、材料類型、部署方式及功能分類
 全球淤泥幕市場規模、佔有率、趨勢和成長分析報告(2026-2034)
 汽車碳罐市場-全球產業規模、佔有率、趨勢、機會與預測:按車輛類型、銷售管道類型、地區和競爭格局分類,2021-2031年空氣污染控制設備服務市場-全球產業規模、佔有率、趨勢、機會與預測:按服務、維修和大修服務、應用、地區和競爭格局分類,2021-2031年