


 |
市場調查報告書
商品編碼
2101612
海洋二氧化碳去除市場機會、成長要素、產業趨勢分析及2026-2035年預測。Ocean Carbon Dioxide Removal Market Opportunity, Growth Drivers, Industry Trend Analysis, and Forecast 2026 - 2035 |
||||||

預計到 2025 年,全球海洋二氧化碳移除 (CDR) 市值將達到 7.3 億美元,並將以 19.9% 的複合年成長率成長,到 2035 年達到 44.3 億美元。
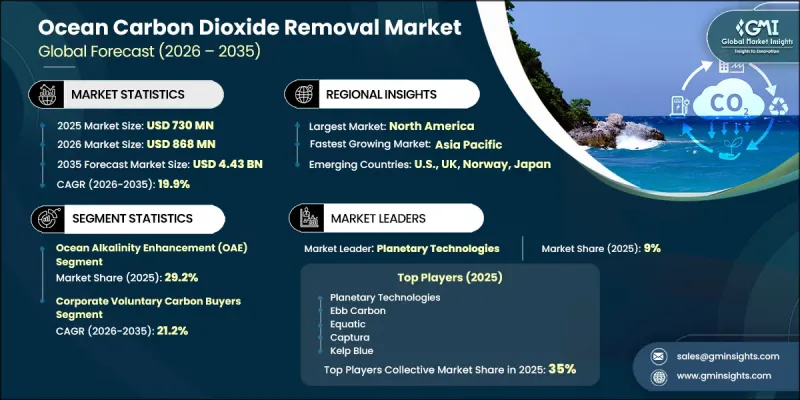
該市場歷來以基於自然的「藍碳」方法為主導,主要集中在紅樹林和海草的再生上,但商業基礎設施有限,統一的認證系統尚未建立。自2022年以來,隨著人工海洋碳去除技術透過檢驗的現場部署開始展現出可衡量的碳封存效果,該產業經歷了結構性轉型。目前,該行業正從以研究主導的資金籌措模式轉向以商業性構建的碳去除實施合約。檢驗的碳去除已成為市場參與企業的關鍵要求,而獨立註冊機構的檢驗正逐漸成為贏得買家信任的主要標準。與檢驗的參與者相比,已獲得認證碳權額度的營運商越來越能夠獲得更高的價格和更長期的合約。雖然基於海洋的碳去除碳權額度尚未納入合規市場,但海事相關人員正積極制定早期籌資策略,並著眼於未來的監管整合。大型航運公司已經開始簽訂長期啟動契約,旨在將其納入未來的合規框架。隨著企業越來越傾向於可靠且永續的碳去除解決方案,海洋碳去除生態系統的需求不斷重組,推動著向檢驗和技術驅動的去除途徑的轉變。
| 市場範圍 | |
|---|---|
| 開始年份 | 2025 |
| 預測期 | 2026-2035 |
| 初始市場規模 | 7.3億美元 |
| 預測金額 | 44.3億美元 |
| 複合年成長率 | 19.9% |
海洋鹼度增強(OAE)佔海洋總量的 29.2%,預計到 2035 年將以 21.6% 的複合年成長率成長。這種方法涉及向海水中引入鹼性礦物化合物,主要是鈣和鎂,以增強海洋的自然碳吸收能力,從而增強碳酸氫鹽的緩衝作用並提高長期碳儲存效率。
企業自願碳權購買者目前佔市場佔有率的38%,預計到2035年將以21.2%的複合年成長率成長。這個類別涵蓋了科技、航空、金融服務和消費品等行業的跨國公司,它們正在加大對海洋碳移除信用的投資,以履行其自願氣候行動承諾。市場需求正轉向高品質、檢驗的碳移除信用,購買者願意支付每噸200至400美元,以確保獲得持久可靠的碳抵消,並證明其具有額外性和長期永續性。
預計到2025年,北美海洋二氧化碳移除(CDR)市場將佔據39.4%的市場佔有率,並在2035年之前以18.5%的複合年成長率成長。美國是該地區最大的貢獻者,這得益於聯邦政府強力的研究舉措和專注於碳去除創新的資助計畫。政府主導的旨在降低去除成本和擴大測量、報告和檢驗(MRV)能力的各項舉措,持續加速全部區域的技術開發和商業化進程。
目錄
第1章:調查方法和範圍
第2章執行摘要
第3章 行業洞察
- 產業生態系分析
- 技術開發公司和解決方案供應商
- MRV服務供應商和碳登記處
- 排碳權購買者和仲介業者
- 監理機構和管治機構
- 技術與創新展望
- 技術成熟度等級(TRL)評估
- 研發領域的新前沿
- 監理情勢
- 國際管治
- 各國和地區的許可製度
- 專門針對海洋CDR的新監管提案
- 影響產業的因素
- 促進因素
- 企業加速履行淨零排放承諾以及對自願性碳市場的需求
- 國際海事組織 (IMO) 的溫室氣體 (GHG) 脫碳策略正在推動航運業朝著海洋碳減排目標努力。
- 政府政策支援與公共研發津貼計劃
- 產業潛在風險與挑戰
- 企業擴張帶來的高成本以及技術成熟度的差距依然存在。
- 促進因素
- 成長潛力分析
- 波特的分析
- PESTLE分析
- 人工智慧和生成式人工智慧對市場的影響
- 利用人工智慧改造現有經營模式
- 生成式人工智慧的應用案例與實施藍圖
- 風險、限制和監管考量
- 投資與資金籌措分析
- 創業投資與私募股權投資趨勢
- 政府補助及慈善活動
- 排碳權預購協議作為資金籌措手段
第4章 競爭情勢
- 介紹
- 企業市佔率分析:按地區分類
- 按地區
- 北美洲
- 歐洲
- 亞太地區
- 中東和非洲
- 拉丁美洲
- 市場集中度分析
- 按地區
- 主要市場公司的競爭分析
- 競爭定位矩陣
- 主要進展
- 併購
- 夥伴關係和聯盟
- 新產品發布
- 業務拓展計劃及資金籌措
- 按公司規模進行基準測試
- 排名分類標準與遴選標準
- 按銷售額、地區和創新能力分類的層級定位矩陣。
第5章 市場規模及預測:依技術分類,2022-2035年
- 海洋鹼度增加(OAE)
- 直接海洋回收 (DOC)
- 大型海藻/海藻的養殖與沉沒
- 微藻類培養與海洋施肥
- 沿海藍碳生態系的恢復
- 其他
第6章 市場規模及預測:依部署方式分類,2022-2035年
- 開闊的海洋
- 沿海及近海
- 陸地/封閉海水
第7章 市場規模及預測:依最終用途分類,2022-2035年
- 企業自願購買碳權額
- 政府碳相關項目
- 航運業
- 能源公司
- 碳專案開發商和投資者
第8章 市場規模及預測:依地區分類,2022-2035年
- 北美洲
- 美國
- 加拿大
- 歐洲
- 德國
- 英國
- 挪威
- 亞太地區
- 日本
- 韓國
- 澳洲
- 中東和非洲
- 沙烏地阿拉伯
- 南非
- 拉丁美洲
- 巴西
第9章:公司簡介
- Captura
- Carboniferous
- CarbonRun
- Ebb Carbon
- Equatic
- Gigablue
- Heimdal
- Kelp Blue
- Ocean Visions, Inc.
- Planetary Technologies
- Running Tide
- Seafields Solutions Ltd.
- SeaO2
- SOS Carbon
- Vesta
- Vycarb
The Global Ocean Carbon Dioxide Removal (CDR) Market was valued at USD 730 million in 2025 and is estimated to grow at a CAGR of 19.9% to reach USD 4.43 billion by 2035.
The market has historically been dominated by nature-based blue carbon approaches, largely centered on mangrove and seagrass restoration, which operated with limited commercial infrastructure and without a unified certification system. Since 2022, the sector has undergone a structural transformation as engineered ocean carbon removal technologies have begun to demonstrate measurable carbon sequestration results through verified field deployments. The industry is now transitioning from research-led funding models toward commercially structured carbon removal delivery contracts. Verified carbon removal has become a critical requirement for market participation, with independent registry validation emerging as a key benchmark for buyer confidence. Operators that achieve certified issuance are increasingly able to secure higher pricing and longer-term agreements compared to non-verified participants. Although ocean-based carbon removal credits are not yet part of compliance markets, maritime stakeholders are actively developing early-stage procurement strategies in anticipation of future regulatory inclusion. Large shipping operators have already initiated long-term offtake arrangements, reflecting expectations of eventual integration into compliance frameworks. Growing corporate preference for high-integrity, durable carbon removal solutions continues to reshape demand across the ocean CDR ecosystem, reinforcing the transition toward verified, technology-enabled removal pathways.
| Market Scope | |
|---|---|
| Start Year | 2025 |
| Forecast Year | 2026-2035 |
| Start Value | $730 Million |
| Forecast Value | $4.43 Billion |
| CAGR | 19.9% |
Ocean alkalinity enhancement (OAE) accounted for 29.2% share and is projected to grow at a CAGR of 21.6% through 2035. This approach increases the ocean's natural carbon absorption capacity by introducing alkaline mineral compounds such as calcium- and magnesium-based materials into seawater, thereby strengthening bicarbonate buffering processes and enhancing long-term carbon storage efficiency.
The corporate voluntary carbon purchasers represented 38% share and is expected to grow at a CAGR of 21.2% through 2035. This category includes multinational corporations across technology, aviation, financial services, and consumer industries that are increasingly investing in ocean-based carbon removal credits to meet voluntary climate commitments. Market demand is shifting toward high-quality, verified carbon removal credits, with buyers paying between USD 200-400 per tonne to secure durable, high-integrity carbon offsets that demonstrate additionality and long-term permanence.
North America Ocean Carbon Dioxide Removal (CDR) Market held 39.4% share in 2025 and is projected to grow at a CAGR of 18.5% during 2035. The United States represents the dominant contributor within the region, supported by strong federal research initiatives and funding programs focused on carbon removal innovation. Government-backed efforts aimed at reducing removal costs and expanding measurement, reporting, and verification capabilities continue to accelerate technology development and commercialization across the region.
Major companies operating in the global ocean carbon dioxide removal industry include Captura, Carboniferous, CarbonRun, Ebb Carbon, Equatic, Gigablue, Heimdal, Kelp Blue, Ocean Visions, Inc., Planetary Technologies, Seafields Solutions Ltd., SeaO2, SOS Carbon, Vesta, and Vycarb. Companies operating in the ocean carbon dioxide removal market are strengthening their competitive position by advancing technology development, expanding pilot-scale deployments, and securing long-term offtake agreements with corporate buyers. Many organizations are investing heavily in measurement, reporting, and verification systems to ensure credibility and compliance with emerging registry standards. Strategic collaborations with research institutions, maritime operators, and climate-focused organizations help accelerate technology validation and commercial scaling. Companies are also focusing on cost reduction through process optimization, materials innovation, and scalable deployment models to improve economic viability.
Table of Contents
Chapter 1 Methodology & Scope
- 1.1 Research approach
- 1.2 Quality commitments
- 1.2.1 GMI AI policy & data integrity commitment
- 1.2.1.1 Source consistency protocol
- 1.2.1 GMI AI policy & data integrity commitment
- 1.3 Research trail & confidence scoring
- 1.3.1 Research trail components
- 1.3.2 Scoring components
- 1.4 Data collection
- 1.4.1 Partial list of primary sources
- 1.5 Data mining sources
- 1.5.1 Paid sources
- 1.5.1.1 Sources, by region
- 1.5.1 Paid sources
- 1.6 Base estimates and calculations
- 1.6.1 Base year calculation for any one approach
- 1.7 Market estimates & forecasts parameters
- 1.8 Forecast model
- 1.8.1 Quantified market impact analysis
- 1.8.1.1 Mathematical impact of growth parameters on forecast
- 1.8.1 Quantified market impact analysis
- 1.9 Research transparency addendum
- 1.9.1 Source attribution framework
- 1.9.2 Quality assurance metrics
- 1.9.3 Our commitment to trust
- 1.10 Market definitions
Chapter 2 Executive Summary
- 2.1 Industry synopsis, 2022 - 2035
- 2.1.1 Business trends
- 2.1.2 Technology trends
- 2.1.3 Deployment trends
- 2.1.4 End use trends
- 2.1.5 Regional trends
Chapter 3 Industry Insights
- 3.1 Industry ecosystem analysis
- 3.1.1 Technology developers & solution providers
- 3.1.2 MRV service providers & carbon registries
- 3.1.3 Carbon credit buyers & intermediaries
- 3.1.4 Regulatory & governance bodies
- 3.2 Technology & innovation landscape
- 3.2.1 Technology Readiness Level (TRL) assessment
- 3.2.2 Emerging R&D frontiers
- 3.3 Regulatory landscape
- 3.3.1 International governance
- 3.3.2 National & regional permitting frameworks
- 3.3.3 Emerging ocean CDR-specific regulatory proposals
- 3.4 Industry impact forces
- 3.4.1 Growth drivers
- 3.4.1.1 Accelerating corporate net-zero commitments & voluntary carbon market demand
- 3.4.1.2 IMO GHG Decarbonization strategy driving maritime sector engagement with ocean CDR
- 3.4.1.3 Government policy support & public R&D funding programs
- 3.4.2 Industry pitfalls and challenges
- 3.4.2.1 High cost of scale-up & persistent technology readiness gaps
- 3.4.1 Growth drivers
- 3.5 Growth potential analysis
- 3.6 Porter's analysis
- 3.6.1 Bargaining power of suppliers
- 3.6.2 Bargaining power of buyers
- 3.6.3 Threat of new entrants
- 3.6.4 Threat of substitute
- 3.6.5 Intensity of competitive rivalry
- 3.7 PESTEL analysis
- 3.7.1 Political factors
- 3.7.2 Economic factors
- 3.7.3 Social factors
- 3.7.4 Technological factors
- 3.7.5 Environmental factors
- 3.7.6 Legal factors
- 3.8 Impact of AI and generative AI on the market (Driven by primary research)
- 3.8.1 AI-driven disruption of existing business model
- 3.8.2 GenAI use cases & adoption roadmap
- 3.8.3 Risks, limitations & regulatory considerations
- 3.9 Investment & Funding Analysis (Driven by primary research)
- 3.9.1 Venture capital & private equity investment trends
- 3.9.2 Government grants & philanthropic
- 3.9.3 Carbon Credit pre-purchase agreements as financing mechanism
Chapter 4 Competitive Landscape, 2026
- 4.1 Introduction
- 4.2 Company market share analysis, by region, 2025
- 4.2.1 By region
- 4.2.1.1 North America
- 4.2.1.2 Europe
- 4.2.1.3 Asia Pacific
- 4.2.1.4 Middle East & Africa
- 4.2.1.5 Latin America
- 4.2.2 Market concentration analysis
- 4.2.1 By region
- 4.3 Competitive analysis of major market players
- 4.4 Competitive positioning matrix
- 4.5 Key developments
- 4.5.1 Mergers & acquisitions
- 4.5.2 Partnerships & collaborations
- 4.5.3 New product launches
- 4.5.4 Expansion plans & funding
- 4.6 Company tier benchmarking
- 4.6.1 Tier classification criteria & qualifying thresholds
- 4.6.2 Tier positioning matrix by revenue, geography & innovation
Chapter 5 Market Size and Forecast, By Technology, 2022 - 2035 (USD Million)
- 5.1 Key trends
- 5.2 Ocean Alkalinity Enhancement (OAE)
- 5.3 Direct Ocean Capture (DOC)
- 5.4 Macroalgae/seaweed cultivation & sinking
- 5.5 Microalgae propagation & ocean fertilization
- 5.6 Coastal blue carbon ecosystem restoration
- 5.7 Others
Chapter 6 Market Size and Forecast, By Deployment, 2022 - 2035 (USD Million)
- 6.1 Key trends
- 6.2 Open ocean
- 6.3 Coastal & near shore
- 6.4 Land-Based / closed seawater
Chapter 7 Market Size and Forecast, By End Use, 2022 - 2035 (USD Million)
- 7.1 Key trends
- 7.2 Corporate voluntary carbon buyers
- 7.3 Government carbon programs
- 7.4 Maritime industry
- 7.5 Energy companies
- 7.6 Carbon project developers & investors
Chapter 8 Market Size and Forecast, By Region, 2022 - 2035 (USD Million)
- 8.1 Key trends
- 8.2 North America
- 8.2.1 U.S.
- 8.2.2 Canada
- 8.3 Europe
- 8.3.1 Germany
- 8.3.2 UK
- 8.3.3 Norway
- 8.4 Asia Pacific
- 8.4.1 Japan
- 8.4.2 South Korea
- 8.4.3 Australia
- 8.5 Middle East & Africa
- 8.5.1 Saudi Arabia
- 8.5.2 South Africa
- 8.6 Latin America
- 8.6.1 Brazil
Chapter 9 Company Profiles
- 9.1 Captura
- 9.2 Carboniferous
- 9.3 CarbonRun
- 9.4 Ebb Carbon
- 9.5 Equatic
- 9.6 Gigablue
- 9.7 Heimdal
- 9.8 Kelp Blue
- 9.9 Ocean Visions, Inc.
- 9.10 Planetary Technologies
- 9.11 Running Tide
- 9.12 Seafields Solutions Ltd.
- 9.13 SeaO2
- 9.14 SOS Carbon
- 9.15 Vesta
- 9.16 Vycarb

 全球海洋二氧化碳移除市場規模、佔有率、趨勢和成長分析報告(2026-2034年)
 二氧化碳市場-2026-2032年全球市場預測
 二氧化碳利用市場規模、佔有率和成長分析:按技術、利用通路、終端用戶產業和地區分類-2026-2033年產業預測
 2035年全球液態二氧化碳市場報告
 直接空氣回收(DAC)系統市場預測至2034年-能源來源、部署類型、技術、應用、最終用戶和地區分類的全球分析二氧化碳監測儀市場:依產品、技術、連接方式、應用、最終用戶和銷售管道分類-2026-2032年全球預測二氧化碳市場規模、佔有率、成長及全球產業分析:按類型、應用和地區的洞察,2026-2034年的預測液態二氧化碳市場:依來源、純度、包裝類型、應用和終端用戶產業分類-全球預測,2026-2032年2026年全球二氧化碳儲能(CES)技術市場報告
 食品級二氧化碳市場規模、佔有率和成長分析:按類型、等級、應用、最終用戶、通路和地區分類-2026-2033年產業預測