


 |
市場調查報告書
商品編碼
2071410
作物監測市場機會、成長要素、產業趨勢分析及2026-2035年預測。Crop Monitoring Market Opportunity, Growth Drivers, Industry Trend Analysis, and Forecast 2026 - 2035 |
||||||

全球作物監測市場預計到 2025 年價值 33 億美元,並將以 14.1% 的複合年成長率成長,到 2035 年達到 122 億美元。
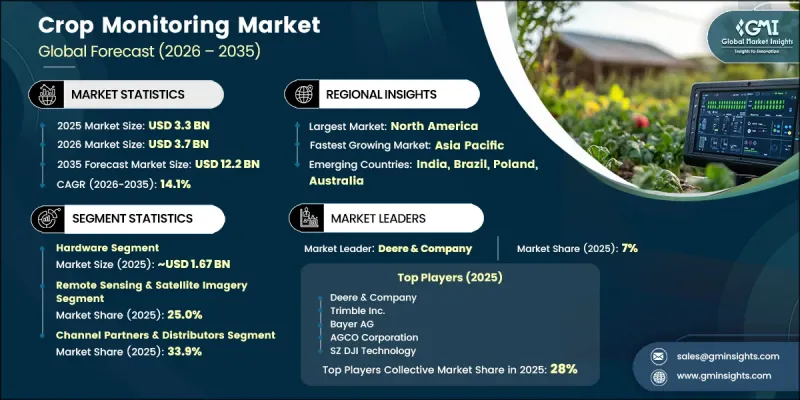
已開發經濟體和新興農業經濟體對精密農業技術的快速應用正在推動市場成長。衛星數據的獲取日益便捷、物聯網 (IoT) 感測器的廣泛部署以及對數據驅動型農業管理決策日益成長的需求,為整個行業創造了巨大的商機。農民和農業相關企業正加大對有助於最佳化資源利用、提高作物產量、降低營運成本和提升產量預測準確性的技術的投資。塑造作物監測市場的主要變革之一是從獨立硬體系統轉向整合資料收集、分析和決策支援永續性為重點的措施正在進一步加速技術應用,並增強作物監測產業的長期成長前景。
| 市場範圍 | |
|---|---|
| 開始年份 | 2025 |
| 預測期 | 2026-2035 |
| 初始市場規模 | 33億美元 |
| 預計金額 | 122億美元 |
| 複合年成長率 | 14.1% |
硬體領域目前佔據50.5%的市場佔有率,預計到2025年銷售額將達到16.7億美元。儘管硬體市場佔有率預計將逐步下降至約45%,但這項變化反映的是軟體和服務產品的快速擴張,而非對硬體解決方案需求的下降。對先進監測設備、連網田間設備、遙感探測技術和農業數據採集基礎設施的持續投資,仍是全球農業市場該領域成長的關鍵驅動力。
預計到2025年,遙感探測和衛星影像領域將佔據25%的市場佔有率,並創造8.3億美元的收入。高解析度農業影像的日益普及和遙感探測技術的進步,使得更多農業作業能夠獲得先進的監測能力。數據收集和影像分析成本的降低,正在推動商業農場、農業組織和公共部門相關人員採用這些技術。因此,遙感探測技術正日益成為精密農業策略的重要組成部分,旨在提高作物產量、資源管理和營運效率。
預計2025年,北美作物監測市場將佔據38%的佔有率,市場規模達13億美元。該地區的主導地位得益於其大規模商業化農業、先進的農業基礎設施以及數位農業技術的廣泛應用。先進的技術整合、強大的通訊基礎設施以及成熟的農業技術供應商生態系統持續推動對作物監測解決方案的需求。此外,該地區對精密農業和農場管理技術的投資不斷增加,也促進了整個農業領域對整合監測平台和先進數據分析工具的採用。
目錄
第1章:調查方法
第2章執行摘要
第3章 行業洞察
- 產業生態系分析
- 影響價值鏈的因素
- 利潤率分析
- 中斷
- 前景
- 製造商
- 中斷
- 供應商情況
- 主要新聞和舉措
- 技術與創新展望
- 監理情勢
- 影響因素
- 促進因素
- 產業潛在風險與挑戰
- 機會
- 2025年價格分析
- 2022-2025年歷史價格趨勢分析
- 依球員類型分類的定價策略(高級球員、超值球員、成本加成球員)
- 區域價格波動分析
- 成長潛力分析
- 波特的分析
- PESTLE分析
- 貿易數據分析
- 進出口量及進口額趨勢
- 主要貿易路線及關稅的影響
- 人工智慧和生成式人工智慧對市場的影響
- 利用人工智慧改造現有經營模式
- 按細分市場分類的生成式人工智慧用例和部署藍圖
- 風險、限制和監管考量
- 生產能力和生產情況
- 設備產能:按地區和主要生產商分類
- 運轉率和擴張計劃
第4章 競爭情勢
- 介紹
- 企業市佔率分析
- 競爭定位矩陣
- 戰略展望矩陣
- 主要市場公司的競爭分析
- 主要進展
- 併購
- 夥伴關係和聯盟
- 新產品發布
- 業務拓展計劃
第5章 市場估計與預測:依類型分類,2022-2035年
- 硬體
- 軟體
- 服務
第6章 市場估計與預測:依技術分類,2022-2035年
- 遙感探測和衛星影像
- 利用無人機/無人飛行器進行監測
- 物聯網和地面感測器
- 人工智慧和機器學習分析
- 變數噴灑技術(VRT)
- 其他(GPS/GIS、雲端運算、區塊鏈)
第7章 市場估計與預測:依應用領域分類,2022-2035年
- 作物健康監測
- 土壤監測
- 產量監測與預測
- 病蟲害檢測
- 實地測繪
- 灌溉管理
- 氣象追蹤與預報
- 其他(VRA、排碳權)
第8章 市場估算與預測:依作物類型分類,2022-2035年
- 穀類和穀類食品
- 油籽/豆類
- 水果和花卉
- 莖和塊莖
- 其他(種植作物、林業等)
第9章 市場估價與預測:依通路分類,2022-2035年
- 直銷
- 通路合作夥伴和經銷商
- 線上電子商務
- 原始設備製造商和系統整合商
第10章 估價與預測:按地區分類,2022-2035年
- 北美洲
- 美國
- 加拿大
- 歐洲
- 德國
- 英國
- 法國
- 義大利
- 西班牙
- 亞太地區
- 中國
- 印度
- 日本
- 韓國
- 澳洲
- 拉丁美洲
- 巴西
- 墨西哥
- 阿根廷
- 中東和非洲
- UAE
- 沙烏地阿拉伯
- 南非
第11章:公司簡介
- 世界公司
- Deere & Company
- Trimble Inc.
- Bayer AG
- AGCO Corporation
- SZ DJI Technology
- Corteva Agriscience
- Topcon Corporation
- Planet Labs PBC
- 當地公司
- CNH Industrial
- Yara International
- XAG Co. Ltd.
- Pessl Instruments GmbH
- Cropin Technology Solutions
- Farmers Edge Inc.
- CropX Technologies
- 新興企業
- Sentera Inc.
- Hummingbird Technologies
- Semios
- Aerobotics
- SatSure Analytics
The Global Crop Monitoring Market was valued at USD 3.3 billion in 2025 and is estimated to grow at a CAGR of 14.1% to reach USD 12.2 billion by 2035.
Market growth is fueled by the rapid adoption of precision agriculture practices across both developed and emerging agricultural economies. Increasing accessibility of satellite-based data, expanding deployment of Internet of Things (IoT) sensors, and rising demand for data-driven farming decisions are creating substantial opportunities throughout the industry. Farmers and agricultural enterprises are increasingly investing in technologies that help optimize resource utilization, improve crop productivity, reduce operational costs, and enhance yield predictability. A major transformation shaping the crop monitoring market is the transition from standalone hardware systems toward integrated digital platforms that combine data collection, analytics, and decision-support capabilities. Cloud-based agricultural solutions are becoming increasingly important as they enable scalable deployment, faster data processing, improved accessibility, and recurring service-based revenue models. Supportive agricultural policies and sustainability-focused initiatives are further accelerating technology adoption, strengthening the long-term growth outlook for the crop monitoring industry.
| Market Scope | |
|---|---|
| Start Year | 2025 |
| Forecast Year | 2026-2035 |
| Start Value | $3.3 Billion |
| Forecast Value | $12.2 Billion |
| CAGR | 14.1% |
The hardware segment held a 50.5% share, generating USD 1.67 billion in 2025. Although hardware is expected to experience a gradual decline in overall market share to approximately 45%, this shift reflects the faster expansion of software and service offerings rather than reduced demand for hardware solutions. Continued investments in advanced monitoring equipment, connected field devices, remote sensing technologies, and agricultural data collection infrastructure remain key drivers supporting segment growth across global farming markets.
The remote sensing and satellite imagery segment accounted for 25% share in 2025, generating USD 830 million. Growing availability of high-resolution agricultural imagery and improvements in remote sensing technologies are expanding access to advanced monitoring capabilities across a wider range of agricultural operations. Declining costs associated with data acquisition and image analysis have increased adoption among commercial farms, agricultural organizations, and public-sector stakeholders. As a result, remote sensing technologies are becoming an increasingly important component of precision agriculture strategies aimed at improving crop performance, resource management, and operational efficiency.
North America Crop Monitoring Market held 38% share in 2025, equivalent to USD 1.3 billion. The region's leadership position is supported by the presence of large-scale commercial farming operations, advanced agricultural infrastructure, and widespread adoption of digital farming technologies. High levels of technology integration, strong connectivity infrastructure, and a well-established ecosystem of agricultural technology providers continue to drive demand for crop monitoring solutions. The region also benefits from increasing investments in precision agriculture and farm management technologies, which support the adoption of integrated monitoring platforms and advanced data analytics tools across the agricultural sector.
Major companies operating in the global crop monitoring market include Aerobotics, AGCO Corporation, Bayer AG, CNH Industrial, Corteva Agriscience, Cropin Technology Solutions, CropX Technologies, Deere & Company, Farmers Edge Inc., Hummingbird Technologies, Pessl Instruments GmbH, Planet Labs PBC, SatSure Analytics, Semios, Sentera Inc., SZ DJI Technology, Topcon Corporation, Trimble Inc., XAG Co. Ltd., and Yara International. Companies operating in the crop monitoring market are implementing a variety of strategic initiatives to strengthen their competitive position and expand market share. Investment in research and development remains a top priority as organizations focus on enhancing data analytics, artificial intelligence capabilities, predictive modeling, and precision agriculture technologies. Many market participants are expanding their software platforms to provide integrated solutions that combine remote sensing, IoT connectivity, and real-time farm intelligence. Strategic partnerships, acquisitions, and collaborations are helping companies broaden their geographic reach and strengthen technology portfolios. Businesses are also investing in cloud-based infrastructure and subscription-based service models to create recurring revenue streams and improve customer retention.
Table of Contents
Chapter 1 Research Methodology
- 1.1 Research approach
- 1.2 Quality Commitments
- 1.2.1 GMI AI policy & data integrity commitment
- 1.2.1.1 Source consistency protocol
- 1.2.1 GMI AI policy & data integrity commitment
- 1.3 Research Trail & Confidence Scoring
- 1.3.1 Research Trail Components
- 1.3.2 Scoring Components
- 1.4 Data Collection
- 1.4.1 Partial list of primary sources
- 1.5 Data mining sources
- 1.5.1 Paid sources
- 1.5.1.1 Sources, by region
- 1.5.1 Paid sources
- 1.6 Base estimates and calculations
- 1.6.1 Base year calculation for any one approach
- 1.7 Forecast model
- 1.7.1 Quantified market impact analysis
- 1.7.1.1 Mathematical impact of growth parameters on forecast
- 1.7.1 Quantified market impact analysis
- 1.8 Research transparency addendum
- 1.8.1 Source attribution framework
- 1.8.2 Quality assurance metrics
- 1.8.3 Our commitment to trust
Chapter 2 Executive Summary
- 2.1 Industry 360° synopsis, 2022 - 2035
- 2.2 Key market trends
- 2.2.1 Regional
- 2.2.2 Type
- 2.2.3 Technology
- 2.2.4 Application
- 2.2.5 Crop Type
- 2.2.6 Distribution Channel
Chapter 3 Industry Insights
- 3.1 Industry ecosystem analysis
- 3.1.1 Factor affecting the value chain
- 3.1.2 Profit margin analysis
- 3.1.3 Disruptions
- 3.1.4 Future outlook
- 3.1.5 Manufacturers
- 3.1.6 Distributors
- 3.2 Supplier landscape
- 3.3 Key news & initiatives
- 3.4 Technology & Innovation Landscape
- 3.5 Regulatory landscape
- 3.6 Impact on forces
- 3.6.1 Growth drivers
- 3.6.2 Industry pitfalls & challenges
- 3.6.3 Opportunities
- 3.7 Pricing analysis, 2025 (driven by primary research)
- 3.7.1 Historical price trend analysis (2022-2025)
- 3.7.2 Pricing strategy by player type (premium/value/cost-plus)
- 3.7.3 Regional price variation analysis
- 3.8 Growth potential analysis
- 3.9 Porter's analysis
- 3.10 PESTEL analysis
- 3.11 Trade data analysis (driven by paid database)
- 3.11.1 Import/export volume & value trends (Driven by Primary Research)
- 3.11.2 Key trade corridors & tariff impact (Driven by Primary Research)
- 3.12 Impact of AI & generative AI on the market
- 3.12.1 AI-driven disruption of existing business models
- 3.12.2 GenAI use cases & adoption roadmap by segment
- 3.12.3 Risks, limitations & regulatory considerations
- 3.13 Capacity & Production Landscape (Driven by Primary Research)
- 3.13.1 Installed Capacity by Region & Key Producer (Driven by Primary Research)
- 3.13.2 Capacity Utilization Rates & Expansion Pipelines (Driven by Primary Research)
Chapter 4 Competitive Landscape, 2025
- 4.1 Introduction
- 4.2 Company market share analysis
- 4.3 Competitive positioning matrix
- 4.4 Strategic outlook matrix
- 4.5 Competitive analysis of major market players
- 4.6 Key developments
- 4.6.1 Mergers & acquisitions
- 4.6.2 Partnerships & collaborations
- 4.6.3 New product launches
- 4.6.4 Expansion plans
Chapter 5 Market Estimates & Forecast, By Type, 2022 - 2035, (USD Billion) (Thousand Units)
- 5.1 Key trends
- 5.2 Hardware
- 5.3 Software
- 5.4 Services
Chapter 6 Market Estimates & Forecast, By Technology, 2022 - 2035, (USD Billion) (Thousand Units)
- 6.1 Key trends
- 6.2 Remote Sensing & Satellite Imagery
- 6.3 UAV / Drone-Based Monitoring
- 6.4 IoT & Ground Sensors
- 6.5 AI & Machine Learning Analytics
- 6.6 Variable Rate Technology (VRT)
- 6.7 Others (GPS/GIS, Cloud, Blockchain)
Chapter 7 Market Estimates & Forecast, By Application, 2022 - 2035, (USD Billion) (Thousand Units)
- 7.1 Key trends
- 7.2 Crop Health Monitoring
- 7.3 Soil Monitoring
- 7.4 Yield Monitoring & Forecasting
- 7.5 Pest & Disease Detection
- 7.6 Field Mapping
- 7.7 Irrigation Management
- 7.8 Weather Tracking & Forecasting
- 7.9 Others (VRA, Carbon Credit)
Chapter 8 Market Estimates & Forecast, By Crop Type, 2022 - 2035, (USD Billion) (Thousand Units)
- 8.1 Key trends
- 8.2 Cereals & Grains
- 8.3 Oilseeds & Pulses
- 8.4 Fruits & Flowers
- 8.5 Stem & Tubers
- 8.6 Other (Plantation Crops, Forestry, etc.)
Chapter 9 Market Estimates & Forecast, By Distribution Channel, 2022 - 2035, (USD Billion) (Thousand Units)
- 9.1 Key trends
- 9.2 Direct Sales
- 9.3 Channel Partners & Distributors
- 9.4 Online / E-Commerce
- 9.5 OEM & System Integrators
Chapter 10 Estimates & Forecast, By Region, 2022 - 2035, (USD Billion) (Million Units)
- 10.1 Key trends
- 10.2 North America
- 10.2.1 U.S.
- 10.2.2 Canada
- 10.3 Europe
- 10.3.1 Germany
- 10.3.2 U.K.
- 10.3.3 France
- 10.3.4 Italy
- 10.3.5 Spain
- 10.4 Asia Pacific
- 10.4.1 China
- 10.4.2 India
- 10.4.3 Japan
- 10.4.4 South Korea
- 10.4.5 Australia
- 10.5 Latin America
- 10.5.1 Brazil
- 10.5.2 Mexico
- 10.5.3 Argentina
- 10.6 MEA
- 10.6.1 UAE
- 10.6.2 Saudi Arabia
- 10.6.3 South Africa
Chapter 11 Company Profiles (Business Overview, Financial Data, Product Landscape, Strategic Outlook, SWOT Analysis)
- 11.1 Global players
- 11.1.1 Deere & Company
- 11.1.2 Trimble Inc.
- 11.1.3 Bayer AG
- 11.1.4 AGCO Corporation
- 11.1.5 SZ DJI Technology
- 11.1.6 Corteva Agriscience
- 11.1.7 Topcon Corporation
- 11.1.8 Planet Labs PBC
- 11.2 Regional players
- 11.2.1 CNH Industrial
- 11.2.2 Yara International
- 11.2.3 XAG Co. Ltd.
- 11.2.4 Pessl Instruments GmbH
- 11.2.5 Cropin Technology Solutions
- 11.2.6 Farmers Edge Inc.
- 11.2.7 CropX Technologies
- 11.3 Emerging players
- 11.3.1 Sentera Inc.
- 11.3.2 Hummingbird Technologies
- 11.3.3 Semios
- 11.3.4 Aerobotics
- 11.3.5 SatSure Analytics

 作物監測市場-2026-2032年全球市場預測
 作物監測市場-全球產業規模、佔有率、趨勢、機會和預測:按交付方式、技術、農場類型、應用、地區和競爭格局分類,2021-2031年
 2026年全球作物監測市場報告
 即時門市監控平台市場分析及預測(至2035年):依類型、產品類型、服務、技術、組件、應用、部署類型、最終用戶、功能及解決方案分類
 作物監測技術市場:2025-2030 年預測
 精密農業作物監測技術的市場規模、佔有率和成長分析(按組件、技術、應用和地區):產業預測(2025-2032)
 2032 年智慧作物行動市場預測:按產品、農場、應用、最終用戶和地區進行的全球分析2026-2032 年作物監測市場(按產品、農場類型、技術、應用和地區分類)
 智慧作物行動市場機會、成長促進因素、產業趨勢分析與預測 2024 - 2032
 全球作物監測市場