


 |
市場調查報告書
商品編碼
2071360
石油煉廠氫氣市場機會、成長促進因素、產業趨勢分析及2026-2035年預測Petroleum Refinery Hydrogen Market Opportunity, Growth Drivers, Industry Trend Analysis, and Forecast 2026 - 2035 |
||||||

預計到 2025 年,全球煉油廠氫氣市場規模將達到 1,487 億美元,年複合成長率為 5.7%,到 2035 年將達到 2,579 億美元。
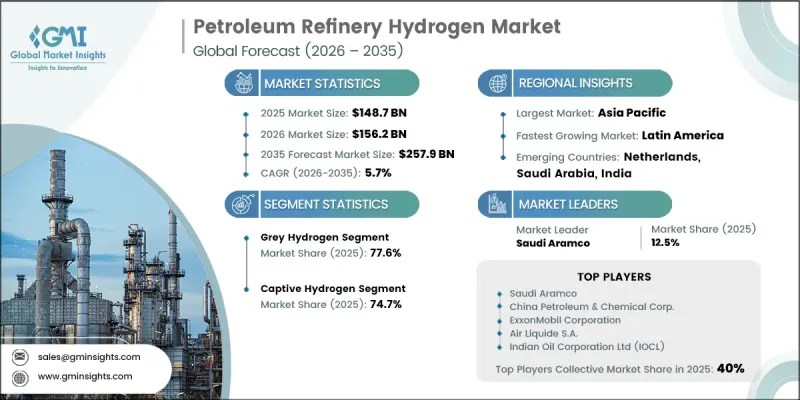
這種成長日益受到生產流程結構轉型的影響,隨著包括碳捕獲藍氫和電解綠氫在內的低碳氫化合物源的日益普及,整個價值鏈的成本結構也隨之重組。此外,隨著煉油廠擴大清潔燃料標準、永續航空燃料加工和生質燃料共加工的應用,對藍氫的需求也超越了傳統的脫硫應用,這大約貢獻了整體複合年成長率的25%。電解槽經濟性的提升,尤其是在中國(成本已降至每千瓦600-1200美元,而其他地區為每千瓦2000-2600美元),正在加速其競爭力的提升。同時,自熱重整結合碳捕獲系統正成為下一代藍氫生產的標桿,縮小了與傳統方法的成本差距。
| 市場範圍 | |
|---|---|
| 開始年份 | 2025 |
| 預測期 | 2026-2035 |
| 上市時的市場規模 | 1487億美元 |
| 預計金額 | 2579億美元 |
| 複合年成長率 | 5.7% |
預計到2025年,灰氫市場將佔據77.6%的佔有率。這主要歸功於蒸氣甲烷重整(SMR)的成本效益,其成本通常在每公斤1至3美元之間。在主要產氫地區,大規模的SMR基礎設施已深度融入煉油廠生態系統,大量工業氫氣直接併入煉油廠。
到2025年,用於現場消費的氫氣生產將佔市場佔有率的74.7%。這反映了煉油廠傾向於現場生產氫氣以確保供應可靠性並最佳化營運管理的趨勢。根據各煉油廠的需求特性設計的整合式蒸汽甲烷重整(SMR)裝置,以及與製程氣體回收系統,仍是最具成本效益的氫氣供應結構。大型綜合能源營運商在多個煉油廠之間維護互聯的氫氣系統,使其能夠內部調整各生產基地之間的供需平衡。
預計到2025年,北美煉油廠氫氣市場佔有率將達到11.2%,年複合成長率為4.5%。這反映出北美煉油基礎已趨於成熟,其重點在於現代化改造而非產能擴張。美國每年生產約1000萬噸氫氣,其中大部分被集中在主要工業走廊沿線的煉油和氨生產群集所消耗。
目錄
第1章:調查方法和範圍
第2章執行摘要
第3章 行業洞察
- 產業生態系統
- 原物料供應及採購分析
- 生產能力評估
- 供應鏈韌性與風險因素
- 配電網路分析
- 監理情勢
- 北美洲
- 歐洲
- 亞太地區
- 中東和非洲
- 拉丁美洲
- 影響產業的因素
- 促進因素
- 產業潛在風險與挑戰
- 成長潛力分析
- 波特的分析
- PESTLE分析
- 石油煉製氫的成本結構分析
- 人工智慧和生成式人工智慧對市場的影響
- 預測性維護和故障檢測
- 電網最佳化和負載預測
- 利用數位雙胞胎進行模擬和測試
- 風險、限制和監管考量
- 新機會和趨勢
- 數位化和物聯網整合
- 進入新興市場
- 將碳捕獲技術整合到氫氣生產設施中
- 向綠色和藍氫過渡的藍圖
- 整體投資情勢與未來展望
第4章 競爭情勢
- 介紹
- 企業市佔率分析:按地區分類
- 北美洲
- 歐洲
- 亞太地區
- 中東和非洲
- 拉丁美洲
- 主要市場公司的競爭分析
- 競爭定位矩陣
- 主要進展
- 併購
- 夥伴關係和聯盟
- 新產品發布
- 業務拓展計劃及資金籌措
- 按公司規模進行基準測試
- 排名分類標準與遴選標準
- 按銷售額、地區和創新能力分類的層級定位矩陣。
第5章 市場規模及預測:依類型分類,2022-2035年
- 灰色的
- 藍色的
- 綠色的
第6章 市場規模及預測:以交付方式分類,2022-2035年
- 專屬式
- 商人
第7章 市場規模及預測:依製程分類,2022-2035年
- 蒸氣重組
- 電解
- 部分氧化法
- 自發性熱重組(ATR)
- 其他
第8章 市場規模及預測:依地區分類,2021-2032年
- 北美洲
- 美國
- 加拿大
- 墨西哥
- 歐洲
- 德國
- 英國
- 法國
- 義大利
- 荷蘭
- 俄羅斯
- 亞太地區
- 中國
- 日本
- 印度
- 澳洲
- 中東和非洲
- 沙烏地阿拉伯
- 伊朗
- UAE
- 南非
- 卡達
- 科威特
- 拉丁美洲
- 智利
- 巴西
- 阿根廷
第9章:公司簡介
- ADNOC
- Air Liquide SA
- Air Products and Chemicals, Inc.
- BP plc
- Chevron Corporation
- China Petroleum & Chemical Corp.
- Equinor ASA
- ExxonMobil Corporation
- Indian Oil Corporation Ltd(IOCL)
- Kuwait Petroleum Corporation
- Linde plc
- Messer Group GmbH
- Petrobras
- PetroChina Company Ltd
- Reliance Industries Ltd
- Rosneft Oil Company
- Saudi Aramco
- Shell plc
- Taiyo Nippon Sanso Corporation
- TotalEnergies SE
The Global Petroleum Refinery Hydrogen Market was valued at USD 148.7 billion in 2025 and is estimated to grow at a CAGR of 5.7% to reach USD 257.9 billion by 2035.
Growth is increasingly shaped by a structural transition in production pathways, with rising integration of low-carbon hydrogen sources, including carbon-captured blue hydrogen and electrolytic green hydrogen, reshaping cost structures across the value chain. Demand is also expanding beyond traditional desulfurization use cases as refiners scale adoption of cleaner fuel standards, sustainable aviation fuel processing, and biofuel co-processing, contributing roughly 25% to overall CAGR momentum. Improvements in electrolyzer economics, particularly in China where costs have declined to USD 600-1,200 per kW compared to USD 2,000-2,600 per kW in other regions, are accelerating competitiveness. In parallel, autothermal reforming paired with carbon capture systems is emerging as a benchmark for next-generation blue hydrogen production, narrowing the cost gap with conventional methods.
| Market Scope | |
|---|---|
| Start Year | 2025 |
| Forecast Year | 2026-2035 |
| Start Value | $148.7 Billion |
| Forecast Value | $257.9 Billion |
| CAGR | 5.7% |
The grey hydrogen segment held a 77.6% share in 2025, owing to the cost efficiency of steam methane reforming, which typically ranges between USD 1-3 per kilogram. Large-scale SMR infrastructure is deeply embedded within refinery ecosystems across major producing regions, with extensive industrial hydrogen output integrated directly into refining complexes.
The captive hydrogen production segment accounted for 74.7% share in 2025, reflecting refiners' preference for on-site generation to ensure supply reliability and optimize operational control. Integrated SMR units tailored to refinery-specific demand profiles, along with recovery systems linked to process gas streams, continue to provide the most cost-efficient hydrogen supply structure. Major integrated energy operators maintain interconnected hydrogen systems across multiple refinery sites, enabling internal balancing of supply and demand across production hubs.
North America Petroleum Refinery Hydrogen Market held a 11.2% share in 2025 and is growing at a CAGR of 4.5%, reflecting a mature refining base focused on modernization rather than capacity expansion. The United States produces around 10 million metric tons of hydrogen annually, with most output consumed within refining and ammonia production clusters concentrated along major industrial corridors.
Major players operating in the global petroleum refinery hydrogen market include Saudi Aramco, Linde plc, ExxonMobil Corporation, Air Liquide S.A., Shell plc, BP plc, Chevron Corporation, PetroChina Company Ltd, Indian Oil Corporation Ltd (IOCL), Reliance Industries Ltd, TotalEnergies SE, Air Products and Chemicals, Inc., China Petroleum & Chemical Corp., Kuwait Petroleum Corporation, Petrobras, Equinor ASA, Rosneft Oil Company, ADNOC, Messer Group GmbH, and Taiyo Nippon Sanso Corporation. Companies in the petroleum refinery hydrogen market are strengthening their competitive positioning by expanding investments in low-carbon hydrogen production technologies, particularly blue hydrogen with integrated carbon capture and electrolytic green hydrogen systems. Many are upgrading existing steam methane reforming infrastructure with carbon capture utilization and storage solutions to reduce emissions while preserving cost advantages. Strategic partnerships between refiners and industrial gas suppliers are increasing to secure long-term hydrogen supply agreements and stabilize pricing structures. Companies are also investing in large-scale electrolyzer deployments to diversify production pathways and reduce dependency on natural gas feedstocks. Digitalization of hydrogen networks through advanced monitoring and optimization platforms is improving operational efficiency and load balancing across refinery complexes.
Table of Contents
Chapter 1 Methodology & Scope
- 1.1 Research design
- 1.2 Quality commitment
- 1.2.1 GMI AI policy & data integrity commitment
- 1.2.1.1 Source consistency protocol
- 1.2.1 GMI AI policy & data integrity commitment
- 1.3 Research Trail & Confidence Scoring
- 1.3.1 Research Trail Components
- 1.3.2 Scoring Components
- 1.4 Data Collection
- 1.4.1 Partial list of primary sources
- 1.5 Data mining sources
- 1.5.1 Paid sources
- 1.5.1.1 Sources, by region
- 1.5.1 Paid sources
- 1.6 Base estimates and calculations
- 1.6.1 Base year calculation for any one approach
- 1.7 Forecast model
- 1.8 Research transparency addendum
- 1.8.1 Source attribution framework
- 1.8.2 Quality assurance metrics
- 1.8.3 Our commitment to trust
- 1.9 Market definitions
Chapter 2 Executive Summary
- 2.1 Industry synopsis, 2022 - 2035
- 2.2 Business trends
- 2.3 Type trends
- 2.4 Delivery mode trends
- 2.5 Process trends
- 2.6 Regional trends
Chapter 3 Industry Insights
- 3.1 Industry ecosystem
- 3.1.1 Raw material availability & sourcing analysis
- 3.1.2 Manufacturing capacity assessment
- 3.1.3 Supply chain resilience & risk factors
- 3.1.4 Distribution network analysis
- 3.2 Regulatory landscape
- 3.2.1 North America
- 3.2.2 Europe
- 3.2.3 Asia Pacific
- 3.2.4 Middle East & Africa
- 3.2.5 Latin America
- 3.3 Industry impact forces
- 3.3.1 Growth drivers
- 3.3.2 Industry pitfalls & challenges
- 3.4 Growth potential analysis
- 3.5 Porter's analysis
- 3.5.1 Bargaining power of suppliers
- 3.5.2 Bargaining power of buyers
- 3.5.3 Threat of new entrants
- 3.5.4 Threat of substitutes
- 3.6 PESTEL analysis
- 3.6.1 Political factors
- 3.6.2 Economic factors
- 3.6.3 Social factors
- 3.6.4 Technological factors
- 3.6.5 Legal factors
- 3.6.6 Environmental factors
- 3.7 Cost structure analysis of petroleum refining hydrogen
- 3.8 Impact of AI & generative AI on the market
- 3.8.1 Predictive maintenance & fault detection
- 3.8.2 Grid optimization & load forecasting
- 3.8.3 Digital twin simulation & testing
- 3.8.4 Risks, limitations & regulatory considerations
- 3.9 Emerging opportunities & trends
- 3.9.1 Digitalization & IoT integration
- 3.9.2 Emerging market penetration
- 3.9.3 Carbon capture integration with hydrogen production units
- 3.9.4 Green & blue hydrogen transition roadmap
- 3.10 Overall investment scenario and future outlook
Chapter 4 Competitive landscape, 2026
- 4.1 Introduction
- 4.2 Company market share analysis, by region, 2025
- 4.2.1 North America
- 4.2.2 Europe
- 4.2.3 Asia Pacific
- 4.2.4 Middle East & Africa
- 4.2.5 Latin America
- 4.3 Competitive analysis of major market players
- 4.4 Competitive positioning matrix
- 4.5 Key developments
- 4.5.1 Mergers & acquisitions
- 4.5.2 Partnerships & collaborations
- 4.5.3 New product launches
- 4.5.4 Expansion plans & funding
- 4.6 Company tier benchmarking
- 4.6.1 Tier classification criteria & qualifying thresholds
- 4.6.2 Tier positioning matrix by revenue, geography & innovation
Chapter 5 Market Size and Forecast, By Type, 2022 - 2035 (USD Billion & MT)
- 5.1 Key trends
- 5.2 Grey
- 5.3 Blue
- 5.4 Green
Chapter 6 Market Size and Forecast, By Delivery Mode, 2022 - 2035 (USD Billion & MT)
- 6.1 Key trends
- 6.2 Captive
- 6.3 Merchant
Chapter 7 Market Size and Forecast, By Process, 2022 - 2035 (USD Billion & MT)
- 7.1 Key trends
- 7.2 Steam reforming
- 7.3 Electrolysis
- 7.4 Partial oxidation
- 7.5 Auto-thermal reforming (ATR)
- 7.6 Others
Chapter 8 Market Size and Forecast, By Region, 2021 - 2032 (USD Billion & MT)
- 8.1 Key trends
- 8.2 North America
- 8.2.1 U.S.
- 8.2.2 Canada
- 8.2.3 Mexico
- 8.3 Europe
- 8.3.1 Germany
- 8.3.2 UK
- 8.3.3 France
- 8.3.4 Italy
- 8.3.5 Netherlands
- 8.3.6 Russia
- 8.4 Asia Pacific
- 8.4.1 China
- 8.4.2 Japan
- 8.4.3 India
- 8.4.4 Australia
- 8.5 Middle East & Africa
- 8.5.1 Saudi Arabia
- 8.5.2 Iran
- 8.5.3 UAE
- 8.5.4 South Africa
- 8.5.5 Qatar
- 8.5.6 Kuwait
- 8.6 Latin America
- 8.6.1 Chile
- 8.6.2 Brazil
- 8.6.3 Argentina
Chapter 9 Company Profiles
- 9.1 ADNOC
- 9.2 Air Liquide S.A.
- 9.3 Air Products and Chemicals, Inc.
- 9.4 BP plc
- 9.5 Chevron Corporation
- 9.6 China Petroleum & Chemical Corp.
- 9.7 Equinor ASA
- 9.8 ExxonMobil Corporation
- 9.9 Indian Oil Corporation Ltd (IOCL)
- 9.10 Kuwait Petroleum Corporation
- 9.11 Linde plc
- 9.12 Messer Group GmbH
- 9.13 Petrobras
- 9.14 PetroChina Company Ltd
- 9.15 Reliance Industries Ltd
- 9.16 Rosneft Oil Company
- 9.17 Saudi Aramco
- 9.18 Shell plc
- 9.19 Taiyo Nippon Sanso Corporation
- 9.20 TotalEnergies SE

 北非精煉石油產品:市場佔有率分析、產業趨勢與統計及成長預測(2026-2031 年)西非精煉石油產品:市場佔有率分析、產業趨勢與統計及成長預測(2026-2031 年)
 石油液體市場-全球產業規模、佔有率、趨勢、機會、預測:按類型、產品類型、應用、地區和競爭格局分類,2021-2031年
 2026年全球產品平臺運輸市場報告
 2026-2034年全球石油基液體原料市場規模、佔有率、趨勢和成長分析報告全球精製藍氫市場規模、佔有率、趨勢和成長分析報告:2026-2034年2026年全球成品油市場報告成品油市場-全球產業規模、佔有率、趨勢、機會、預測(按產品類型、應用、餾分、地區和競爭格局分類),2021-2031年
 成品油市場規模、佔有率及成長分析(依產品類型、應用、終端用戶產業、通路及地區分類)-2026-2033年產業預測
 石油基液體市場規模、佔有率和成長分析(按類型、最終產品和地區分類)—產業預測(2026-2033 年)