


 |
市場調查報告書
商品編碼
2061469
臥舖巴士市場:市場機會、成長要素、產業趨勢分析及2026-2035年預測Sleeper Buses Market Opportunity, Growth Drivers, Industry Trend Analysis, and Forecast 2026 - 2035 |
||||||
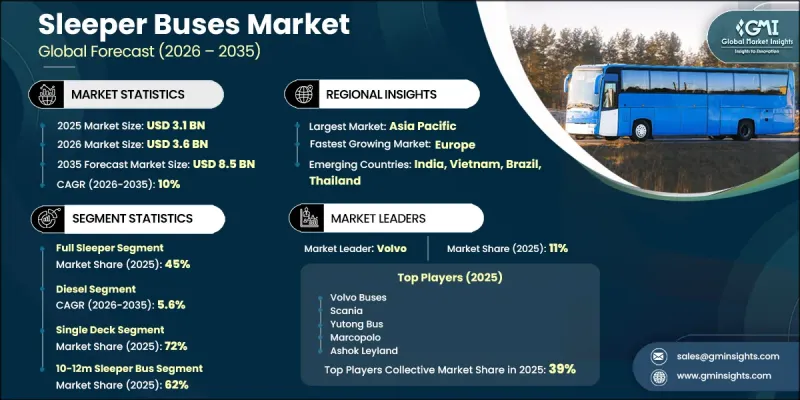
全球臥舖巴士市場預計到 2025 年將價值 31 億美元,預計到 2035 年將以 10% 的複合年成長率成長至 85 億美元。
由於長途道路運輸網路的擴張和區域間高速公路網路的持續發展,市場呈現強勁的成長動能。城際和州際旅行的增加導致人們對長途客運解決方案(尤其是專為夜間旅行設計的臥舖巴士)的依賴性增強。人口流動性的提高、旅遊業的蓬勃發展以及人們對經濟實惠的長途旅行方式日益成長的偏好,進一步強化了市場需求。公共和私營營運商為車隊現代化所做的努力,正在加速引入配備更舒適性、更先進的懸吊系統、數位化監控工具和聯網汽車技術的先進臥舖巴士。營運商也正在部署遠端資訊處理和GPS車輛管理系統,以最佳化營運效率、安全性和路線。此外,更嚴格的環境法規和永續性目標正在加速臥舖巴士向電動和替代燃料動力來源的轉變,並逐步改變車隊的組成。基礎設施的持續發展和對高效客運解決方案日益成長的需求,預計將支撐全球臥舖巴士行業的長期市場成長。
| 市場範圍 | |
|---|---|
| 開始年份 | 2025 |
| 預測期 | 2026-2035 |
| 上市時的市場規模 | 31億美元 |
| 預測金額 | 85億美元 |
| 複合年成長率 | 10% |
預計到2025年,全臥舖車廂市佔率將達到45%,並在2035年之前以9.2%的複合年成長率成長。由於長途過夜旅行對舒適度的需求不斷成長,該細分市場持續保持領先地位。在長途城際和跨州航線上,乘客的休息和舒適度至關重要,因此全臥舖車廂配置備受青睞。這一趨勢的驅動力在於乘客對更高旅行舒適度的期望。尤其是在超過500公里的航程中,這種需求更為旺盛,因為舒適的座椅解決方案能夠顯著提升乘客體驗和旅行效率。
預計到2025年,柴油動力客車市佔率將達到82%,並在2026年至2035年間以5.6%的複合年成長率成長。柴油動力臥舖客車憑藉其營運可靠性、長途行駛能力和完善的加油基礎設施,繼續保持主導地位。由於其成本效益高且在高速公路網路上性能穩定,這些車輛仍然是長途運輸業者的首選。燃料供應便利性和初始投資低進一步鞏固了柴油車輛在臥舖客車市場的主導地位。
中國臥舖客車市場佔全球60%的佔有率,預計2025年市場規模將達到9.378億美元。推動中國市場成長的主要因素包括城際交通網路的擴張、旅客出行需求的增加以及對經濟型夜間交通方式日益成長的需求。公路基礎設施的持續發展和長途運輸走廊的拓展顯著提高了臥舖客車的營運效率。此外,私營運營商的積極運作以及都市區之間日益活躍的客運活動也進一步強化了全國範圍內的市場需求。
目錄
第1章:調查方法
第2章執行摘要
第3章 行業洞察
- 產業生態系分析
- 供應商情況
- 利潤率分析
- 成本結構
- 每個階段增加的價值
- 影響價值鏈的因素
- 中斷
- 影響產業的因素
- 促進因素
- 長途及城際客運需求增加
- 擴建高速公路和道路運輸基礎設施
- 旅遊和團體旅遊活動的成長
- 運輸公司車輛現代化
- 產業潛在風險與挑戰
- 高昂的初始設定和維護成本
- 監管合規性和排放標準
- 市場機遇
- 擴大電動公車和替代燃料公車(臥舖公車)的規模
- 拓展高階和豪華巴士運輸服務
- 智慧交通與互聯車隊技術的發展
- 促進因素
- 成長潛力分析
- 技術與創新展望
- 最新科技趨勢
- 新興技術
- 價格分析
- 對過去價格趨勢的分析
- 定價策略:按業務類型分類
- 監理情勢
- 北美洲
- 美國聯邦機動車輛運輸安全管理局 (FMCSA) 客運法規
- 美國國家公路交通安全管理局 (NHTSA) 公車安全標準
- 美國環保署 (EPA)關於排放氣體的規定
- 美國《殘障人士法案》(ADA)的無障礙標準
- 加拿大運輸部關於商用客車的規定
- 歐洲
- 歐盟商用車輛通用安全法規
- 公車的歐VI排放氣體標準
- 聯合國歐洲經濟委員會乘用車安全標準
- 歐洲公共汽車運輸乘客權利相關法規
- 跨境道路運輸合規框架
- 亞太地區
- 中國商用客車安全與排放氣體法規
- 中國第六階段大型車輛排放氣體標準
- 印度中央機動車輛法規與AIS標準
- 日本關於商用乘用車檢驗的規定
- 澳洲大型乘用車安全標準
- 拉丁美洲
- 巴西對商業客運的限制
- 巴西的PROCONVE排放氣體標準
- 墨西哥商用車輛安全法規
- 南方共同市場地區的運輸合規框架
- 中東和非洲
- 海灣合作理事會商用車技術法規
- 沙烏地阿拉伯SASO車輛合規標準
- 阿拉伯聯合大公國客運營運法規
- 南非商用車輛安全標準
- 非洲區域交通運輸協調框架
- 北美洲
- 波特的分析
- PESTLE分析
- 專利分析
- 貿易數據分析
- 進出口量及進口額趨勢
- 主要貿易路線及關稅的影響
- 成本細分分析
- 人工智慧和生成式人工智慧對市場的影響
- 利用人工智慧改造現有經營模式
- 按細分市場分類的生成式人工智慧用例和部署藍圖
- 風險、限制和監管考量
- 生產能力和生產情況
- 設備產能:按地區和主要生產商分類
- 運轉率和擴張計劃
- 永續性和環境方面
- 永續計劃
- 減少廢棄物策略
- 生產中的能源效率
- 具有環保意識的舉措
- 考慮碳足跡
- 預測假設和情境分析
- 基本案例:驅動複合年成長率的關鍵宏觀經濟與產業變量
- 樂觀情境:宏觀經濟與產業的順風
- 悲觀情景:宏觀經濟放緩或產業逆風
第4章 競爭情勢
- 介紹
- 企業市佔率分析
- 北美洲
- 歐洲
- 亞太地區
- LATAM
- 中東和非洲
- 主要市場公司的競爭分析
- 競爭定位矩陣
- 主要進展
- 併購
- 夥伴關係和聯盟
- 新產品發布
- 業務拓展計劃及資金籌措
- 按公司規模進行基準測試
- 排名分類標準與遴選標準
- 按銷售額、地區和創新能力分類的層級定位矩陣。
第5章 市場估計與預測:依配置分類,2022-2035年
- 半臥舖
- 全尺寸臥舖
- 座椅和臥舖組合式
第6章 市場估計與預測:依促進因素分類,2022-2035年
- 柴油引擎
- CNG/LNG
- 混合
- 電的
第7章 市場估價與預測:依甲板類型分類,2022-2035年
- 單層甲板
- 雙層甲板
第8章 市場估算與預測:依巴士長度分類,2022-2035年
- 小於10米
- 10~12 m
- 超過12米
第9章 市場估價與預測:依車軸類型分類,2022-2035年
- 單軸
- 多軸
第10章 市場估價與預測:依應用領域分類,2022-2035年
- 定期城際交通服務
- 包機服務
- 旅遊服務
- 企業和員工的交通運輸
第11章 市場估價與預測:依所有權類型分類,2022-2035年
- 私人車隊營運商
- 政府/公共運輸業者
第12章 市場估計與預測:依地區分類,2022-2035年
- 北美洲
- 美國
- 加拿大
- 歐洲
- 德國
- 英國
- 法國
- 義大利
- 西班牙
- 俄羅斯
- 挪威
- 荷蘭
- 瑞典
- 亞太地區
- 中國
- 印度
- 日本
- 澳洲
- 韓國
- 新加坡
- 泰國
- 印尼
- 越南
- 拉丁美洲
- 巴西
- 墨西哥
- 阿根廷
- 中東和非洲
- 南非
- 沙烏地阿拉伯
- UAE
- 土耳其
第13章:公司簡介
- 世界公司
- Higer Bus
- King Long
- Scania
- Tata Motors
- Volvo Buses
- Yutong Bus
- 當地公司
- Ankai(Anhui Ankai Automobile)
- Ashok Leyland
- Irizar
- MAN Truck &Bus SE
- Marcopolo
- SML Isuzu
- THACO
- VE Commercial Vehicles(Eicher Trucks &Buses)
- Zhongtong Bus
- 新興企業/顛覆者
- LeafyBus
- NueGo(GreenCell Mobility)
- Olectra Greentech
- Switch Mobility
- Zhengzhou Yutong New Energy
The Global Sleeper Buses Market was valued at USD 3.1 billion in 2025 and is estimated to grow at a CAGR of 10% to reach USD 8.5 billion by 2035.
The market is witnessing strong growth momentum driven by the expansion of long-distance road transport networks and continuous improvements in highway connectivity across regions. Rising intercity and interstate mobility is increasing reliance on long-haul passenger transport solutions, particularly sleeper buses designed for overnight travel. Growing population mobility, expanding tourism activity, and increasing preference for cost-efficient long-distance travel are further strengthening market demand. Fleet modernization initiatives across public and private operators are accelerating the adoption of advanced sleeper buses equipped with enhanced comfort features, improved suspension systems, digital monitoring tools, and connected vehicle technologies. Operators are also integrating telematics and GPS-enabled fleet management systems to improve operational efficiency, safety, and route optimization. In addition, tightening environmental regulations and sustainability goals are encouraging the shift toward electric and alternative fuel-powered sleeper buses, gradually reshaping fleet composition. Continuous infrastructure upgrades, combined with rising demand for efficient passenger mobility solutions, are expected to sustain long-term market growth across the global sleeper buses industry.
| Market Scope | |
|---|---|
| Start Year | 2025 |
| Forecast Year | 2026-2035 |
| Start Value | $3.1 Billion |
| Forecast Value | $8.5 Billion |
| CAGR | 10% |
The full sleeper segment held a 45% share in 2025 and is projected to grow at a CAGR of 9.2% through 2035. This segment continues to dominate due to increasing demand for enhanced comfort during long-distance overnight travel. Full sleeper configurations are widely preferred on extended intercity and interstate routes where passenger rest and convenience are key priorities. Their strong adoption is supported by growing expectations for improved travel comfort, especially on journeys exceeding 500 km, where rest-enabled seating solutions significantly enhance passenger experience and travel efficiency.
The diesel segment accounted for 82% share in 2025 and is expected to grow at a CAGR of 5.6% between 2026 and 2035. Diesel-powered sleeper buses continue to lead due to their operational reliability, extended driving range, and well-established refueling infrastructure. These vehicles remain the preferred choice for long-distance transport operators because of their cost-effectiveness and consistent performance across highway networks. Widespread fuel availability and lower initial investment requirements further support their dominance in the sleeper buses market.
China Sleeper Buses Market held a 60% share, generating USD 937.8 million in 2025. Market growth in the country is supported by expanding intercity transportation networks, increasing passenger mobility, and rising demand for economical overnight travel options. Continuous upgrades in highway infrastructure and the expansion of long-distance transport corridors have significantly improved operational efficiency for sleeper bus fleets. The presence of organized private operators and strong passenger movement between urban and regional centers further strengthens market demand across the country.
Major companies operating in the Sleeper Buses Market include Tata Motors, Volvo Buses, Scania, Marcopolo, Ashok Leyland, Zhongtong Bus, Yutong Bus, Higer Bus, Irizar, and King Long. Companies operating in the sleeper buses market are adopting multiple strategies to strengthen their market presence and expand operational reach. Leading manufacturers are focusing on advanced vehicle engineering, enhanced passenger comfort systems, and improved safety features to differentiate their offerings. Investment in electric and alternative fuel technologies is increasing as companies align with global emission reduction targets and sustainability goals. Strategic partnerships with fleet operators, transport authorities, and tourism companies are supporting the wider deployment of sleeper bus solutions. Manufacturers are also integrating digital technologies such as telematics, GPS tracking, and smart fleet management systems to improve efficiency and route optimization.
Table of Contents
Chapter 1 Research Methodology
- 1.1 Research approach
- 1.2 Quality Commitments
- 1.2.1 GMI AI policy & data integrity commitment
- 1.2.1.1 Source consistency protocol
- 1.2.1 GMI AI policy & data integrity commitment
- 1.3 Research Trail & Confidence Scoring
- 1.3.1 Research Trail Components
- 1.3.2 Scoring Components
- 1.4 Data Collection
- 1.4.1 Partial list of primary sources
- 1.5 Data mining sources
- 1.5.1 Paid sources
- 1.5.1.1 Sources, by region
- 1.5.1 Paid sources
- 1.6 Base estimates and calculations
- 1.6.1 Base year calculation for any one approach
- 1.7 Forecast model
- 1.7.1 Quantified market impact analysis
- 1.7.1.1 Mathematical impact of growth parameters on forecast
- 1.7.1 Quantified market impact analysis
- 1.8 Research transparency addendum
- 1.8.1 Source attribution framework
- 1.8.2 Quality assurance metrics
- 1.8.3 Our commitment to trust
Chapter 2 Executive Summary
- 2.1 Industry 360° synopsis, 2022 - 2035
- 2.2 Key market trends
- 2.2.1 Regional
- 2.2.2 Configuration
- 2.2.3 Propulsion
- 2.2.4 Deck Type
- 2.2.5 Bus Length
- 2.2.6 Axle Type
- 2.2.7 Application
- 2.2.8 Ownership
- 2.3 TAM Analysis, 2026-2035
- 2.4 CXO perspectives: Strategic imperatives
Chapter 3 Industry Insights
- 3.1 Industry ecosystem analysis
- 3.1.1 Supplier landscape
- 3.1.2 Profit margin analysis
- 3.1.3 Cost structure
- 3.1.4 Value addition at each stage
- 3.1.5 Factor affecting the value chain
- 3.1.6 Disruptions
- 3.2 Industry impact forces
- 3.2.1 Growth drivers
- 3.2.1.1 Rising long distance and intercity passenger travel demand
- 3.2.1.2 Expansion of highway and road transportation infrastructure
- 3.2.1.3 Growth in tourism and group travel activities
- 3.2.1.4 Fleet modernization by transport operators
- 3.2.2 Industry pitfalls and challenges
- 3.2.2.1 High initial procurement and maintenance costs
- 3.2.2.2 Regulatory compliance and emission standards
- 3.2.3 Market opportunities
- 3.2.3.1 Rising adoption of electric and alternative fuel sleeper buses
- 3.2.3.2 Expansion of premium and luxury bus transportation services
- 3.2.3.3 Growth in smart transportation and connected fleet technologies
- 3.2.1 Growth drivers
- 3.3 Growth potential analysis
- 3.4 Technology and innovation landscape
- 3.4.1 Current technological trends
- 3.4.2 Emerging technologies
- 3.5 Pricing Analysis (Driven by primary research)
- 3.5.1 Historical Price Trend Analysis
- 3.5.2 Pricing Strategy by Player Type
- 3.6 Regulatory landscape
- 3.6.1 North America
- 3.6.1.1 U.S. Federal Motor Carrier Safety Administration passenger transportation regulations
- 3.6.1.2 National Highway Traffic Safety Administration bus safety standards
- 3.6.1.3 Environmental Protection Agency heavy duty vehicle emission regulations
- 3.6.1.4 Americans with Disabilities Act accessibility standards
- 3.6.1.5 Transport Canada commercial passenger vehicle regulations
- 3.6.2 Europe
- 3.6.2.1 European Union General Safety Regulation for commercial vehicles
- 3.6.2.2 Euro VI emission standards for buses
- 3.6.2.3 UNECE passenger vehicle safety standards
- 3.6.2.4 European passenger rights regulations for bus transportation
- 3.6.2.5 Cross border road transportation compliance frameworks
- 3.6.3 Asia Pacific
- 3.6.3.1 China commercial bus safety and emission regulations
- 3.6.3.2 China VI heavy duty vehicle emission standards
- 3.6.3.3 India Central Motor Vehicles Rules and AIS standards
- 3.6.3.4 Japan commercial passenger vehicle inspection regulations
- 3.6.3.5 Australia heavy passenger vehicle safety standards
- 3.6.4 Latin America
- 3.6.4.1 Brazil commercial passenger transportation regulations
- 3.6.4.2 Brazil PROCONVE emission standards
- 3.6.4.3 Mexico commercial vehicle safety regulations
- 3.6.4.4 Mercosur regional transportation compliance frameworks
- 3.6.5 Middle East & Africa
- 3.6.5.1 GCC commercial vehicle technical regulations
- 3.6.5.2 Saudi Arabia SASO vehicle conformity standards
- 3.6.5.3 UAE passenger transportation operational regulations
- 3.6.5.4 South Africa commercial vehicle safety standards
- 3.6.5.5 African regional transportation harmonization frameworks
- 3.6.1 North America
- 3.7 Porter’s analysis
- 3.8 PESTEL analysis
- 3.9 Patent analysis (Driven by primary research)
- 3.10 Trade Data Analysis (Driven by paid database)
- 3.10.1 Import/export volume & value trends
- 3.10.2 Key trade corridors & tariff impact
- 3.11 Cost breakdown analysis
- 3.12 Impact of AI and Generative AI on the Market
- 3.12.1 AI Driven Disruption of Existing Business Models
- 3.12.2 GenAI Use Cases and Adoption Roadmap by Segment
- 3.12.3 Risks Limitations and Regulatory Considerations
- 3.13 Capacity & Production Landscape (Driven by Primary Research)
- 3.13.1 Installed Capacity by Region & Key Producer
- 3.13.2 Capacity Utilization Rates & Expansion Pipelines
- 3.14 Sustainability and environmental aspects
- 3.14.1 Sustainable practices
- 3.14.2 Waste reduction strategies
- 3.14.3 Energy efficiency in production
- 3.14.4 Eco-friendly Initiatives
- 3.14.5 Carbon footprint considerations
- 3.15 Forecast assumptions & scenario analysis (Driven by Primary Research)
- 3.15.1 Base Case- Key Macro & Industry Variables Driving CAGR
- 3.15.2 Optimistic Scenarios- Favorable macro and industry tailwinds
- 3.15.3 Pessimistic Scenario - Macroeconomic slowdown or industry headwinds
Chapter 4 Competitive Landscape, 2025
- 4.1 Introduction
- 4.2 Company market share analysis
- 4.2.1 North America
- 4.2.2 Europe
- 4.2.3 Asia Pacific
- 4.2.4 LATAM
- 4.2.5 MEA
- 4.3 Competitive analysis of major market players
- 4.4 Competitive positioning matrix
- 4.5 Key developments
- 4.5.1 Mergers & acquisitions
- 4.5.2 Partnerships & collaborations
- 4.5.3 New Product Launches
- 4.5.4 Expansion Plans and funding
- 4.6 Company tier benchmarking
- 4.6.1 Tier classification criteria & qualifying thresholds
- 4.6.2 Tier positioning matrix by revenue, geography & innovation
Chapter 5 Market Estimates & Forecast, By Configuration, 2022 - 2035 (USD Mn, Units)
- 5.1 Key trends
- 5.2 Semi-Sleeper
- 5.3 Full Sleeper
- 5.4 Seater-Sleeper Combination
Chapter 6 Market Estimates & Forecast, By Propulsion, 2022 - 2035 (USD Mn, Units)
- 6.1 Key trends
- 6.2 Diesel
- 6.3 CNG/LNG
- 6.4 Hybrid
- 6.5 Electric
Chapter 7 Market Estimates & Forecast, By Deck Type, 2022 - 2035 (USD Mn, Units)
- 7.1 Key trends
- 7.2 Single Deck
- 7.3 Double Deck
Chapter 8 Market Estimates & Forecast, By Bus Length, 2022 - 2035 (USD Mn, Units)
- 8.1 Key trends
- 8.2 Below 10 m
- 8.3 10-12 m
- 8.4 Above 12 m
Chapter 9 Market Estimates & Forecast, By Axle Type, 2022 - 2035 (USD Mn, Units)
- 9.1 Key trends
- 9.2 Single Axle
- 9.3 Multi-Axle
Chapter 10 Market Estimates & Forecast, By Application, 2022 - 2035 (USD Mn, Units)
- 10.1 Key trends
- 10.2 Scheduled Intercity Services
- 10.3 Charter Services
- 10.4 Tourism Services
- 10.5 Corporate/Staff Transportation
Chapter 11 Market Estimates & Forecast, By Ownership, 2022 - 2035 (USD Mn, Units)
- 11.1 Key trends
- 11.2 Private Fleet Operators
- 11.3 Government/Public Transport Operators
Chapter 12 Market Estimates & Forecast, By Region, 2022 - 2035 (USD Mn, Units)
- 12.1 Key trends
- 12.2 North America
- 12.2.1 US
- 12.2.2 Canada
- 12.3 Europe
- 12.3.1 Germany
- 12.3.2 UK
- 12.3.3 France
- 12.3.4 Italy
- 12.3.5 Spain
- 12.3.6 Russia
- 12.3.7 Norway
- 12.3.8 Netherlands
- 12.3.9 Sweden
- 12.4 Asia Pacific
- 12.4.1 China
- 12.4.2 India
- 12.4.3 Japan
- 12.4.4 Australia
- 12.4.5 South Korea
- 12.4.6 Singapore
- 12.4.7 Thailand
- 12.4.8 Indonesia
- 12.4.9 Vietnam
- 12.5 Latin America
- 12.5.1 Brazil
- 12.5.2 Mexico
- 12.5.3 Argentina
- 12.6 MEA
- 12.6.1 South Africa
- 12.6.2 Saudi Arabia
- 12.6.3 UAE
- 12.6.4 Turkey
Chapter 13 Company Profiles
- 13.1 Global Players
- 13.1.1 Higer Bus
- 13.1.2 King Long
- 13.1.3 Scania
- 13.1.4 Tata Motors
- 13.1.5 Volvo Buses
- 13.1.6 Yutong Bus
- 13.2 Regional Players
- 13.2.1 Ankai (Anhui Ankai Automobile)
- 13.2.2 Ashok Leyland
- 13.2.3 Irizar
- 13.2.4 MAN Truck & Bus SE
- 13.2.5 Marcopolo
- 13.2.6 SML Isuzu
- 13.2.7 THACO
- 13.2.8 VE Commercial Vehicles (Eicher Trucks & Buses)
- 13.2.9 Zhongtong Bus
- 13.3 Emerging Players / Disruptors
- 13.3.1 LeafyBus
- 13.3.2 NueGo (GreenCell Mobility)
- 13.3.3 Olectra Greentech
- 13.3.4 Switch Mobility
- 13.3.5 Zhengzhou Yutong New Energy
 2026年全球巴士市場報告2026年全球長途客車市場報告
 豪華巴士市場規模、佔有率和成長分析:按燃料類型、巴士類型、應用和地區分類-2026-2033年產業預測
 歐洲巴士市場:市場佔有率分析、產業趨勢與統計、成長預測(2026-2031)
 全球鉸接式巴士市場
 公車市場機會、成長要素、產業趨勢分析及2026-2035年預測。
 城際電動巴士市場預測至2034年-全球動力系統、電池容量、巴士長度、座位數、續航里程、應用及區域分析
 公車市場規模、佔有率、趨勢和預測:按類型、燃料類型、座位容量、應用和地區分類,2026-2034 年2026年全球巴士和長途客車市場報告
 受電弓充電器市場規模、佔有率和趨勢分析報告:按組件、充電方式、充電基礎設施類型、地區和細分市場預測(2026-2033 年)