


 |
市場調查報告書
商品編碼
2061416
商業及工業太陽能發電組件市場機會、成長要素、產業趨勢分析及2026-2035年預測Commercial and Industrial Solar PV Module Market Opportunity, Growth Drivers, Industry Trend Analysis, and Forecast 2026 - 2035 |
||||||
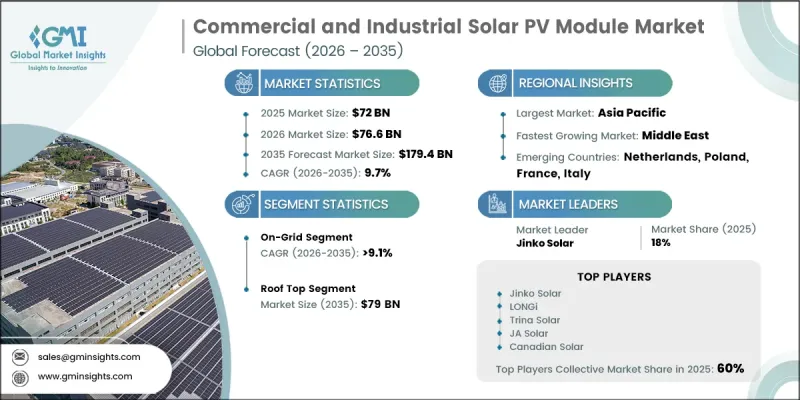
2025年全球商業和工業太陽能發電組件市場價值為720億美元,預計到2035年將以9.7%的複合年成長率成長至1794億美元。
受商業建築、工業設施、倉庫、資料中心和製造地等企業加強投資、擴大太陽能發電系統應用範圍以降低電費並實現永續性目標的推動,全球光學模組的需求進一步促進了全球市場成長。政府支持持續發揮關鍵作用,稅額扣抵、補貼和淨計量計劃等獎勵加速了太陽能解決方案的大規模部署。這些政策措施降低了初始安裝成本,提高了企業採用太陽能發電的經濟可行性,並推動了市場在各地區的滲透。持續的技術創新,包括高效能電池結構、雙面組件設計和材料耐久性的提升,使得在有限的安裝空間內能夠實現更高的發電量。這種性能的提升顯著提高了投資回報率,從而推動了小規模和大型商業及工業用戶的廣泛採用。對能源成本管理和長期營運效率日益成長的關注也加速了全球市場的普及,而企業的永續發展措施則進一步推動了向可再生能源系統的轉型。
| 市場範圍 | |
|---|---|
| 開始年份 | 2025 |
| 預測期 | 2026-2035 |
| 上市時的市場規模 | 720億美元 |
| 預計金額 | 1794億美元 |
| 複合年成長率 | 9.7% |
預計到2035年,併網光伏市場將以9.1%的複合年成長率成長。這一成長主要得益於市場對可靠、經濟高效且能與現有電網基礎設施無縫整合的電力解決方案的需求不斷成長。對傳統能源依賴的減少,加上政府的支持、淨計量電價的優勢以及稅收優惠,正在推動工業用戶對併網光伏系統的應用。組件效率、系統可靠性和智慧電網相容性的持續提升,進一步增強了併網光電系統的吸引力。
預計到2035年,屋頂光電市場規模將達到790億美元。人們對最佳化能源成本和實現長期節能的日益關注,正推動商業和工業用戶採用屋頂光電發電系統。電價波動促使企業透過自發電模式穩定能源支出。此外,支持性的法規結構和獎勵計畫也進一步促進了各行業屋頂光電系統的普及。
美國商業和工業太陽能組件市場預計到2035年將以8%的複合年成長率成長。市場成長的主要驅動力是企業日益重視環境責任和永續性舉措,這影響了它們的投資決策。企業正在部署太陽能解決方案,以提升品牌聲譽並增強相關人員的信心。優惠的獎勵計劃、稅收減免和可再生能源政策進一步推動了太陽能系統在工業和商業設施中的大規模部署。
目錄
第1章:調查方法和範圍
第2章執行摘要
第3章 行業洞察
- 產業生態系統
- 原物料供應及採購分析
- 生產能力評估
- 供應鏈韌性與風險因素
- 配電網路分析
- 監理情勢
- 北美洲
- 歐洲
- 亞太地區
- 中東
- 非洲
- 拉丁美洲
- 影響產業的因素
- 促進因素
- 產業潛在風險與挑戰
- 成長潛力分析
- 波特的分析
- PESTLE分析
- 成本結構分析
- 材料清單細分
- 製造成本和學習曲線的趨勢
- 系統平衡(BOS)成本趨勢
- 價格趨勢分析
- 對過去價格趨勢的分析
- 定價策略:按業務類型分類
- 貿易數據分析
- 進出口額趨勢
- 主要貿易路線及關稅的影響
- 生產能力和運轉率
- 各國具體生產能力
- 運轉率和擴張計劃
- 人工智慧和生成式人工智慧對市場的影響
- 預測性維護和故障檢測
- 電網最佳化和負載預測
- 利用數位雙胞胎進行模擬和測試
- 風險、限制和監管考量
- 新機會和趨勢
- 農用電動車和兩用車
- 建築一體化光伏發電(BIPV)
- 用於工業水域的浮體式太陽能發電
- 電動車充電基礎設施的整合
- 數位化和物聯網整合
- 智慧模組技術和監控系統
- 用於能源交易和認證的區塊鏈
- 專案管理數位平台生態系統
- 投資分析及未來展望
第4章 競爭情勢
- 介紹
- 企業市佔率分析:按地區分類
- 北美洲
- 歐洲
- 亞太地區
- 中東
- 非洲
- 拉丁美洲
- 主要市場公司的競爭分析
- 競爭定位矩陣
- 主要進展
- 併購
- 夥伴關係和聯盟
- 新產品發布
- 業務拓展計劃及資金籌措
- 按公司規模進行基準測試
- 排名分類標準與遴選標準
- 按銷售額、地區和創新能力分類的層級定位矩陣。
第5章 市場規模及預測:依性別分類的互聯互通情況,2022-2035年
- 並網型
- 離網
第6章 市場規模及預測:依安裝方式分類,2022-2035年
- 地面安裝
- 屋頂
第7章 市場規模及預測:依技術分類,2022-2035年
- 單晶
- PERC
- TopCon
- HJT
- IBC
- 多晶
- 薄膜
- 碲化鎘(CdTe)
- 非晶質(a-Si)
- CIGS(銅銦鎵硒)
第8章 市場規模及預測:依地區分類,2022-2035年
- 北美洲
- 美國
- 加拿大
- 墨西哥
- 歐洲
- 奧地利
- 挪威
- 丹麥
- 芬蘭
- 德國
- 義大利
- 瑞士
- 西班牙
- 瑞典
- 英國
- 荷蘭
- 波蘭
- 比利時
- 愛爾蘭
- 波羅的海國家
- 葡萄牙
- 亞太地區
- 中國
- 澳洲
- 印度
- 日本
- 韓國
- 泰國
- 菲律賓
- 越南
- 馬來西亞
- 新加坡
- 中東
- 以色列
- 沙烏地阿拉伯
- UAE
- 約旦
- 阿曼
- 科威特
- 土耳其
- 非洲
- 南非
- 埃及
- 阿爾及利亞
- 奈及利亞
- 摩洛哥
- 拉丁美洲
- 巴西
- 智利
- 阿根廷
- 秘魯
第9章:公司簡介
- AIKO Solar
- Boviet Solar
- Canadian Solar
- CHINT Solar
- First Solar
- Hanwha Group
- JA SOLAR Technology
- JinkoSolar
- LONGi
- Maysun Solar
- Mission Solar
- Risen Energy
- Rayzon Solar
- REC Solar Panels
- Reliance Industries Limited
- Standard Solar
- SunPower Corporation
- Trina Solar
- Vikram Solar
- Waaree
The Global Commercial & Industrial Solar PV Module Market was valued at USD 72 billion in 2025 and is estimated to grow at a CAGR of 9.7% to reach USD 179.4 billion by 2035.
The market is experiencing strong expansion driven by rising investments from commercial buildings, industrial facilities, warehouses, data centers, and manufacturing units that are increasingly adopting solar energy systems to reduce electricity expenses and achieve sustainability targets. Demand for high-efficiency PV modules specifically designed for commercial and industrial applications is further strengthening market growth worldwide. Government support continues to play a pivotal role, with incentives such as tax credits, subsidies, and net metering frameworks encouraging large-scale adoption of solar solutions. These policy measures reduce upfront installation costs, making solar energy more financially viable for enterprises and expanding market penetration across regions. Ongoing technological advancements, including high-efficiency cell architectures, bifacial module designs, and improved material durability, are enabling higher energy output within limited installation spaces. This improved performance significantly enhances return on investment, driving wider adoption across both small and large-scale commercial and industrial users. Increasing focus on energy cost control and long-term operational efficiency is also accelerating deployment across global markets, while corporate sustainability commitments continue to reinforce the transition toward renewable energy systems.
| Market Scope | |
|---|---|
| Start Year | 2025 |
| Forecast Year | 2026-2035 |
| Start Value | $72 Billion |
| Forecast Value | $179.4 Billion |
| CAGR | 9.7% |
The on-grid segment is expected to grow at a CAGR of 9.1% through 2035. Growth in this segment is supported by rising demand for dependable and cost-effective electricity solutions that integrate seamlessly with existing grid infrastructure. Reduced reliance on conventional power sources, combined with supportive government incentives, net metering benefits, and tax advantages, is strengthening adoption across industrial users. Continuous improvements in module efficiency, system reliability, and smart grid compatibility are further enhancing the attractiveness of on-grid solar systems.
The rooftop segment is projected to reach USD 79 billion by 2035. Increasing emphasis on energy cost optimization and long-term savings is driving widespread adoption of rooftop solar systems among commercial and industrial users. Fluctuating electricity prices are encouraging businesses to stabilize energy expenditures through self-generation models. Supportive regulatory frameworks and incentive programs are further contributing to the expansion of rooftop installations across various sectors.
United States Commercial & Industrial Solar PV Module Market is projected to grow at a CAGR of 8% through 2035. Market growth is driven by increasing corporate focus on environmental responsibility and sustainability initiatives that are influencing investment decisions. Companies are adopting solar solutions to enhance brand reputation and strengthen stakeholder trust. Favorable incentive programs, tax benefits, and renewable energy policies are further encouraging large-scale deployment of solar PV systems across industrial and commercial facilities.
Major players operating in the Global Commercial & Industrial Solar PV Module Industry include First Solar, JinkoSolar, LONGi, Trina Solar, JA SOLAR Technology Co., Ltd, Canadian Solar, Risen Energy, SunPower Corporation, Vikram Solar, Waaree, Hanwha Group, Reliance Industries Limited, REC Solar Panels, AIKO Solar, Boviet Solar, CHINT Solar, Maysun Solar, Mission Solar, Rayzon Solar, and Standard Solar. Companies in the commercial & industrial solar PV module market are strengthening their competitive position through continuous innovation in high-efficiency solar technologies and advanced module designs such as bifacial and high-density cell structures. They are expanding production capacity and investing in vertically integrated supply chains to reduce costs and improve reliability. Strategic partnerships with commercial developers and industrial operators are enabling large-scale project deployments. Firms are also focusing on regional expansion in high-growth markets supported by favorable policies and incentives. In addition, digital monitoring solutions and smart energy management systems are being integrated to enhance performance tracking and operational efficiency.
Table of Contents
Chapter 1 Methodology & Scope
- 1.1 Research design
- 1.2 Quality commitment
- 1.2.1 GMI AI policy & data integrity commitment
- 1.2.1.1 Source consistency protocol
- 1.2.1 GMI AI policy & data integrity commitment
- 1.3 Research trail & confidence scoring
- 1.3.1 Research trail components
- 1.3.2 Scoring components
- 1.4 Data collection
- 1.4.1 Partial list of primary sources
- 1.5 Data mining sources
- 1.5.1 Paid sources
- 1.5.1.1 Sources, by region
- 1.5.1 Paid sources
- 1.6 Base estimates and calculations
- 1.6.1 Base year calculation for any one approach
- 1.7 Forecast model
- 1.8 Research transparency addendum
- 1.8.1 Source attribution framework
- 1.8.2 Quality assurance metrics
- 1.8.3 Our commitment to trust
- 1.9 Market definitions
Chapter 2 Executive Summary
- 2.1 Industry synopsis, 2022 - 2035
- 2.2 Business trends
- 2.3 Connectivity trends
- 2.4 Mounting trends
- 2.5 Technology trends
- 2.6 Regional trends
Chapter 3 Industry Insights
- 3.1 Industry ecosystem
- 3.1.1 Raw material availability & sourcing analysis
- 3.1.2 Manufacturing capacity assessment
- 3.1.3 Supply chain resilience & risk factors
- 3.1.4 Distribution network analysis
- 3.2 Regulatory landscape
- 3.2.1 North America
- 3.2.2 Europe
- 3.2.3 Asia Pacific
- 3.2.4 Middle East
- 3.2.5 Africa
- 3.2.6 Latin America
- 3.3 Industry impact forces
- 3.3.1 Growth drivers
- 3.3.2 Industry pitfalls & challenges
- 3.4 Growth potential analysis
- 3.5 Porter's analysis
- 3.5.1 Bargaining power of suppliers
- 3.5.2 Bargaining power of buyers
- 3.5.3 Threat of new entrants
- 3.5.4 Threat of substitutes
- 3.6 PESTEL analysis
- 3.6.1 Political factors
- 3.6.2 Economic factors
- 3.6.3 Social factors
- 3.6.4 Technological factors
- 3.6.5 Legal factors
- 3.6.6 Environmental factors
- 3.7 Cost structure analysis
- 3.7.1 Bill of Materials Breakdown
- 3.7.2 Manufacturing Cost Evolution & Learning Curve
- 3.7.3 Balance of System Cost Trends
- 3.8 Price trend analysis (Driven by Primary Research)
- 3.8.1 Historical price trend analysis
- 3.8.2 Pricing strategy by player type
- 3.9 Trade data analysis (Driven by Primary Research)
- 3.9.1 Import/export value trends
- 3.9.2 Key trade corridors & tariff impact
- 3.10 Production capacity & utilization (Driven by Primary Research)
- 3.10.1 Production capacity by country
- 3.10.2 Utilization rates and expansion pipeline
- 3.11 Impact of AI & generative AI on the market [SOLUTION CORE]
- 3.11.1 Predictive maintenance & fault detection
- 3.11.2 Grid optimization & load forecasting
- 3.11.3 Digital twin simulation & testing
- 3.11.4 Risks, limitations & regulatory considerations
- 3.12 Emerging opportunities & trends
- 3.12.1 Agrivoltaics & Dual-Use Applications
- 3.12.2 Building-Integrated Photovoltaics (BIPV)
- 3.12.3 Floating Solar for Industrial Water Bodies
- 3.12.4 EV Charging Infrastructure Integration
- 3.13 Digitalization & IoT integration
- 3.13.1 Smart module technology and monitoring systems
- 3.13.2 Blockchain for Energy Trading & Certification
- 3.13.3 Digital Platform Ecosystems for Project Management
- 3.14 Investment analysis and future outlook
Chapter 4 Competitive landscape, 2026
- 4.1 Introduction
- 4.2 Company market share analysis, by region, 2025
- 4.2.1 North America
- 4.2.2 Europe
- 4.2.3 Asia Pacific
- 4.2.4 Middle East
- 4.2.5 Africa
- 4.2.6 Latin America
- 4.3 Competitive analysis of major market players
- 4.4 Competitive positioning matrix
- 4.5 Key developments
- 4.5.1 Mergers & acquisitions
- 4.5.2 Partnerships & collaborations
- 4.5.3 New product launches
- 4.5.4 Expansion plans & funding
- 4.6 Company tier benchmarking
- 4.6.1 Tier classification criteria & qualifying thresholds
- 4.6.2 Tier positioning matrix by revenue, geography & innovation
Chapter 5 Market Size and Forecast, By Connectivity, 2022 - 2035 (USD Million & MW)
- 5.1 Key trends
- 5.2 On grid
- 5.3 Off grid
Chapter 6 Market Size and Forecast, By Mounting, 2022 - 2035 (USD Million & MW)
- 6.1 Key trends
- 6.2 Ground Mounted
- 6.3 Rooftop
Chapter 7 Market Size and Forecast, By Technology, 2022 - 2035 (USD Million & MW)
- 7.1 Key trends
- 7.2 Monocrystalline
- 7.2.1 PERC
- 7.2.2 TopCon
- 7.2.3 HJT
- 7.2.4 IBC
- 7.3 Polycrystalline
- 7.4 Thin film
- 7.4.1 Cadmium Telluride (CdTe)
- 7.4.2 Amorphous Silicon (a-Si)
- 7.4.3 CIGS (Copper Indium Gallium Selenide)
Chapter 8 Market Size and Forecast, By Region, 2022 - 2035 (USD Million & MW)
- 8.1 Key trends
- 8.2 North America
- 8.2.1 U.S.
- 8.2.2 Canada
- 8.2.3 Mexico
- 8.3 Europe
- 8.3.1 Austria
- 8.3.2 Norway
- 8.3.3 Denmark
- 8.3.4 Finland
- 8.3.5 Germany
- 8.3.6 Italy
- 8.3.7 Switzerland
- 8.3.8 Spain
- 8.3.9 Sweden
- 8.3.10 UK
- 8.3.11 Netherlands
- 8.3.12 Poland
- 8.3.13 Belgium
- 8.3.14 Ireland
- 8.3.15 Baltics
- 8.3.16 Portugal
- 8.4 Asia Pacific
- 8.4.1 China
- 8.4.2 Australia
- 8.4.3 India
- 8.4.4 Japan
- 8.4.5 South Korea
- 8.4.6 Thailand
- 8.4.7 Philippines
- 8.4.8 Vietnam
- 8.4.9 Malaysia
- 8.4.10 Singapore
- 8.5 Middle East
- 8.5.1 Israel
- 8.5.2 Saudi Arabia
- 8.5.3 UAE
- 8.5.4 Jordan
- 8.5.5 Oman
- 8.5.6 Kuwait
- 8.5.7 Turkey
- 8.6 Africa
- 8.6.1 South Africa
- 8.6.2 Egypt
- 8.6.3 Algeria
- 8.6.4 Nigeria
- 8.6.5 Morocco
- 8.7 Latin America
- 8.7.1 Brazil
- 8.7.2 Chile
- 8.7.3 Argentina
- 8.7.4 Peru
Chapter 9 Company Profiles
- 9.1 AIKO Solar
- 9.2 Boviet Solar
- 9.3 Canadian Solar
- 9.4 CHINT Solar
- 9.5 First Solar
- 9.6 Hanwha Group
- 9.7 JA SOLAR Technology
- 9.8 JinkoSolar
- 9.9 LONGi
- 9.10 Maysun Solar
- 9.11 Mission Solar
- 9.12 Risen Energy
- 9.13 Rayzon Solar
- 9.14 REC Solar Panels
- 9.15 Reliance Industries Limited
- 9.16 Standard Solar
- 9.17 SunPower Corporation
- 9.18 Trina Solar
- 9.19 Vikram Solar
- 9.20 Waaree
 太陽能發電工程、採購和施工 (EPC) 市場:2026-2032 年全球市場預測(按服務類型、太陽光電技術、追蹤器類型、容量、安裝類型和最終用途分類)
 全球公用事業規模太陽能發電市場預測至2034年—按安裝類型、容量範圍、所有權/營運、技術、應用和地區分類的分析
 屋頂太陽能發電組件市場機會、成長要素、產業趨勢分析及2026-2035年預測。
 太陽能板市場規模、佔有率和成長分析:按技術類型、併網方式、安裝類型、安裝結構、電池類型、輸出和地區分類-2026-2033年產業預測
 太陽能發電組件市場-全球產業規模、佔有率、趨勢、機會和預測:按技術、產品、連接方式、安裝方式、最終用途、地區和競爭格局分類,2021-2031年住宅太陽能發電組件市場機會、成長要素、產業趨勢分析及2026-2035年預測。太陽能發電組件市場機會、成長要素、產業趨勢分析及2026-2035年預測
 全球太陽能材料,2025-2032年太陽能組件及系統市場預測至2034年-按組件、安裝方式、技術、應用和區域分類的全球分析
 永續能源研究回顧:2025