


 |
市場調查報告書
商品編碼
2061390
不斷電系統(UPS)市場機會、成長要素、產業趨勢分析及2026-2035年預測Uninterruptible Power Supply (UPS) Market Opportunity, Growth Drivers, Industry Trend Analysis, and Forecast 2026 - 2035 |
||||||
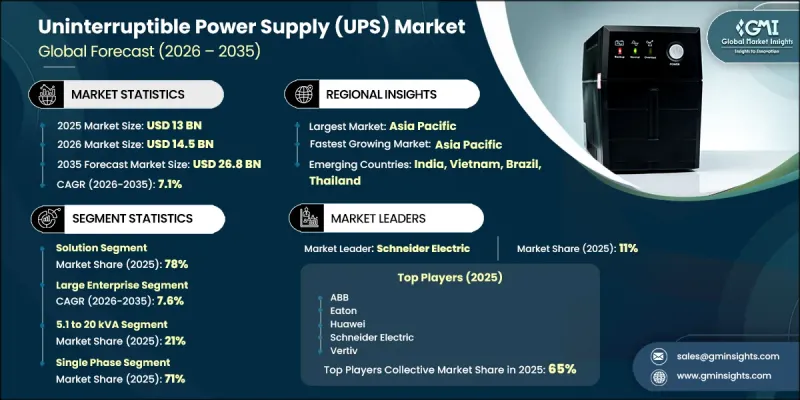
2025 年全球不斷電系統(UPS) 市值為 130 億美元,預計到 2035 年將以 7.1% 的複合年成長率成長至 268 億美元。
不斷電系統進一步加速了對 UPS 系統的需求,因為持續的電源保護對於伺服器、網路系統和關鍵任務基礎設施至關重要。此外,電壓波動和斷電頻率的增加也推動了 UPS 解決方案在住宅、商業和工業領域的應用。工業自動化的進步和互聯製造技術的應用也增加了對可靠備用電源系統的需求。由於鋰離子電池相比傳統電池技術具有更高的能量密度、更長的使用壽命和更長的正常運作等優勢,製造商正在擴大其 UPS 產品中鋰離子電池的使用。模組化 UPS 架構的應用也日益普及,尤其是在工業設施和資料中心,因為它們擴充性、易於維護以及能夠高效支援不斷成長的電力需求等優點。
| 市場範圍 | |
|---|---|
| 開始年份 | 2025 |
| 預測期 | 2026-2035 |
| 上市時的市場規模 | 130億美元 |
| 預測金額 | 268億美元 |
| 複合年成長率 | 7.1% |
預計到2025年,大型企業市場將佔據68.3%的市場佔有率,並在2026年至2035年間以7.6%的複合年成長率成長。大型企業正大力投資高容量UPS系統,以確保關鍵設施的業務連續性。這些系統被廣泛部署,用於支援先進的基礎設施,並保護關鍵電子設備免受意外斷電和電壓波動的影響。企業正在加速升級其備用電源基礎設施,以最大限度地減少停機時間,提高業務永續營運,並確保在斷電期間業務不間斷運作。數位轉型計畫的擴展以及營運韌性日益成長的重要性預計將繼續支撐該領域的需求。
到2025年,單相UPS將佔據71%的市佔率。住宅、教育、零售和小規模商業場所對緊湊型、小容量備用電源系統的需求仍然強勁。單相UPS系統適用於那些不需要高容量基礎設施,且需要可靠、經濟高效的備用電源解決方案的應用情境。其緊湊的設計、便捷的安裝以及對小規模運作的適應性,正推動著單相UPS在多個終端用戶領域的廣泛應用。
預計2025年,美國不斷電系統(UPS)市佔率將達到85%,市場規模將達37億美元。推動美國市場成長的主要因素包括:超大規模資料中心投資增加、醫療基礎設施擴建以及工業自動化技術的日益普及。此外,對雲端運算平台、人工智慧(AI)工作負載和數位金融服務的日益依賴,也進一步提升了關鍵環境中對可靠備用電源系統的需求。同時,人們對電網不穩定、惡劣天氣和意外停電的擔憂日益加劇,也推動了UPS系統在美國住宅、商業和工業領域的廣泛應用。
目錄
第1章:調查方法
第2章執行摘要
第3章 行業洞察
- 產業生態系分析
- 供應商情況
- 利潤率分析
- 成本結構
- 每個階段增加的價值
- 影響價值鏈的因素
- 中斷
- 影響產業的因素
- 促進因素
- 對資料中心和雲端基礎設施的需求不斷成長
- 停電次數增加,電網不穩定
- 工業自動化和智慧製造的發展
- 通訊和5G基礎設施的擴展
- 產業潛在風險與挑戰
- 安裝和維護成本高昂
- 電池壽命短和處置問題令人擔憂
- 市場機遇
- 擴展邊緣運算基礎設施
- 採用鋰離子電池技術
- 與可再生能源系統整合
- 促進因素
- 成長潛力分析
- 技術與創新展望
- 最新科技趨勢
- 新興技術
- 價格分析
- 對過去價格趨勢的分析
- 定價策略:按業務類型分類
- 監理情勢
- 北美洲
- 美國能源局不斷電系統標準
- UL 1778不斷電系統安全和合規性要求
- 美國國家電氣工程規範 (NEC) 對 UPS 系統的安裝要求
- NFPA 110 和 NFPA 111 關於緊急和備用電源系統的要求
- 加拿大電氣標準和 CSA C22.2 No. 107.3 UPS 系統需求
- 歐洲
- 低電壓指令 2014/35/EU
- 電磁相容性指令 2014/30/EU
- 待機和關機期間的功耗生態設計要求。
- 關於限制在電氣和電子設備中使用有害物質的指令
- 廢棄電子電氣設備指令和電池法規
- 亞太地區
- 中國電子電氣產品有害物質管理條例
- 中國關於廢棄電子電氣設備收集和處置的規定
- 印度 IS 16242 第 1 部分 UPS 通用與安全要求
- 日本《電器及材料安全法》及PSE標誌展示要求
- 澳洲電氣產品安全與能源效率框架
- 拉丁美洲
- 巴西INMETRO合格評定和強制性認證要求
- 巴西電子廢棄物和電池的逆向物流需求
- 根據 NOM 001 SEDE 2012,墨西哥電氣設備安裝要求
- 墨西哥UPS設備標準基於UL 1778和IEC 62040
- 南方共同市場貿易便利化與技術協調框架
- 中東和非洲
- 阿拉伯聯合大公國產品符合技術法規的合格證書
- 阿拉伯聯合大公國電信設備的批准和註冊要求
- 沙烏地阿拉伯電氣設備SASO合格證書和技術法規
- 南非NRCS電氣產品強制性標準
- 北美洲
- 波特的分析
- PESTLE分析
- 專利分析
- 貿易數據分析
- 進出口量及進口額趨勢
- 主要貿易路線及關稅的影響
- 成本細分分析
- 人工智慧和生成式人工智慧對市場的影響
- 利用人工智慧改造現有經營模式
- 按細分市場分類的生成式人工智慧用例和部署藍圖
- 風險、限制和監管考量
- 生產能力和生產情況
- 設備產能:按地區和主要生產商分類
- 運轉率和擴張計劃
- 永續性和環境方面
- 永續計劃
- 減少廢棄物策略
- 生產中的能源效率
- 具有環保意識的舉措
- 考慮碳足跡
- 預測假設和情境分析
- 基本案例:驅動複合年成長率的關鍵宏觀經濟與產業變量
- 樂觀情境:宏觀經濟與產業的順風
- 悲觀情景:宏觀經濟放緩或產業逆風
第4章 競爭情勢
- 介紹
- 企業市佔率分析
- 北美洲
- 歐洲
- 亞太地區
- LATAM
- 中東和非洲
- 主要市場公司的競爭分析
- 競爭定位矩陣
- 主要進展
- 併購
- 夥伴關係和聯盟
- 新產品發布
- 業務拓展計劃及資金籌措
- 按公司規模進行基準測試
- 排名分類標準與遴選標準
- 按銷售額、地區和創新能力分類的層級定位矩陣。
第5章 市場估計與預測:依組件分類,2022-2035年
- 解決方案
- 待機(離線)
- Line Interactive
- 線上UPS
- 服務
- 專業的
- 管理
第6章 市場估算與預測:依組織規模分類,2022-2035年
- 小型企業
- 大公司
第7章 市場估計與預測:依產能分類,2022-2035年
- 小於1千伏安
- 1.1~5 kVA
- 5.1~20 kVA
- 20.1~50 kVA
- 50.1~200 kVA
- 超過200千伏安
第8章 市場估算與預測:依階段分類,2022-2035年
- 單相
- 三相
第9章 市場估算與預測:依部署架構分類,2022-2035年
- 集中
- 去中心化
第10章 市場估價與預測:依通路分類,2022-2035年
- 直銷
- 間接銷售
- 經銷商
- 增值轉售商(VAR)
- 電子商務平台
第11章 市場估計與預測:依最終用途分類,2022-2035年
- BFSI
- 資料中心
- 超大規模資料中心
- 託管設施
- 企業資料中心
- 邊緣運算設施
- 衛生保健
- 電訊
- 工業應用
- 政府/國防
- 其他
第12章 市場估計與預測:依地區分類,2022-2035年
- 北美洲
- 美國
- 加拿大
- 歐洲
- 德國
- 英國
- 法國
- 義大利
- 西班牙
- 俄羅斯
- 挪威
- 荷蘭
- 瑞典
- 亞太地區
- 中國
- 印度
- 日本
- 澳洲
- 韓國
- 新加坡
- 泰國
- 印尼
- 越南
- 拉丁美洲
- 巴西
- 墨西哥
- 阿根廷
- 中東和非洲
- 南非
- 沙烏地阿拉伯
- UAE
- 土耳其
第13章:公司簡介
- 世界公司
- ABB
- CyberPower
- Delta Electronics
- Eaton
- Huawei
- Legrand
- Mitsubishi Electric
- Schneider Electric
- Socomec
- Vertiv
- 當地公司
- AEG Power Solutions
- Borri
- Fuji Electric
- Kehua Tech
- Piller Power Systems
- Riello UPS
- Toshiba International Corporation
- 新興企業/顛覆者
- Active Power
- Natron Energy
- ZincFive
The Global Uninterruptible Power Supply (UPS) Market was valued at USD 13 billion in 2025 and is estimated to grow at a CAGR of 7.1% to reach USD 26.8 billion by 2035.
The uninterruptible power supply industry is experiencing substantial growth due to rising dependence on digital infrastructure across industries such as healthcare, manufacturing, telecommunications, and data centers. Businesses are increasingly investing in advanced backup power solutions to maintain uninterrupted operations and safeguard sensitive equipment from power disruptions. Rapid expansion of hyperscale data centers is further accelerating demand for UPS systems, as continuous power protection is essential for servers, networking systems, and mission-critical infrastructure. In addition, increasing incidents of voltage fluctuations and power outages are encouraging wider deployment of UPS solutions across residential, commercial, and industrial sectors. Growing industrial automation and the adoption of connected manufacturing technologies are also strengthening the need for reliable power backup systems. Manufacturers are increasingly integrating lithium-ion batteries into UPS products because of their superior energy density, longer operational life, and extended runtime compared to conventional battery technologies. The adoption of modular UPS architecture is also gaining momentum, particularly in industrial facilities and data centers, due to its scalability, simplified maintenance, and ability to support expanding power requirements efficiently.
| Market Scope | |
|---|---|
| Start Year | 2025 |
| Forecast Year | 2026-2035 |
| Start Value | $13 Billion |
| Forecast Value | $26.8 Billion |
| CAGR | 7.1% |
The large enterprise segment accounted for 68.3% share in 2025 and is anticipated to grow at a CAGR of 7.6% from 2026 to 2035. Large organizations are making significant investments in high-capacity UPS systems to ensure continuous operations across critical facilities. These systems are widely deployed to support advanced infrastructure and protect essential electronic equipment from unexpected power interruptions and voltage instability. Enterprises are increasingly upgrading their backup power infrastructure to minimize operational downtime, improve business continuity, and maintain uninterrupted workflow during electrical disturbances. Rising digital transformation initiatives and the growing importance of operational resilience are expected to continue supporting demand within this segment.
The single-phase segment held a 71% share in 2025. Demand for compact and lower-capacity backup power systems remains steady across residential properties, educational facilities, retail spaces, and small commercial establishments. Single-phase UPS systems are preferred for applications that require reliable and cost-effective power backup solutions without the need for high-capacity infrastructure. Their compact design, ease of installation, and suitability for smaller operations continue to drive widespread adoption across multiple end-use sectors.
U.S. Uninterruptible Power Supply (UPS) Market held an 85% share in 2025 and generated USD 3.7 billion. Market growth in the country is being driven by rising investments in hyperscale data centers, expanding healthcare infrastructure, and increasing deployment of industrial automation technologies. Growing reliance on cloud computing platforms, artificial intelligence workloads, and digital financial services is further contributing to the need for dependable power backup systems in critical environments. In addition, increasing concerns related to grid instability, severe weather conditions, and unexpected power failures are encouraging the adoption of UPS systems across residential, commercial, and industrial applications throughout the country.
Major companies operating in the Global Uninterruptible Power Supply (UPS) Market include Vertiv, Eaton, ABB, Schneider Electric, Huawei, Delta Electronics, Mitsubishi Electric, Legrand, Socomec, and CyberPower. Companies in the uninterruptible power supply market are implementing several strategic initiatives to strengthen their market presence and improve competitive positioning. Leading manufacturers are focusing on the development of energy-efficient and modular UPS systems that offer higher scalability and simplified maintenance for industrial and commercial applications. Businesses are also increasing investments in lithium-ion battery technology to deliver longer-lasting and more reliable backup power solutions. Strategic partnerships with data center operators, cloud service providers, and industrial automation companies are helping market participants expand their customer base and improve product integration capabilities. In addition, companies are prioritizing digital monitoring technologies, remote management solutions, and predictive maintenance capabilities to enhance operational efficiency and customer experience. Geographic expansion, continuous product innovation, and investments in smart power infrastructure remain key strategies supporting long-term growth in the Uninterruptible Power Supply (UPS) Market.
Table of Contents
Chapter 1 Research Methodology
- 1.1 Research approach
- 1.2 Quality Commitments
- 1.2.1 GMI AI policy & data integrity commitment
- 1.2.1.1 Source consistency protocol
- 1.2.1 GMI AI policy & data integrity commitment
- 1.3 Research Trail & Confidence Scoring
- 1.3.1 Research Trail Components
- 1.3.2 Scoring Components
- 1.4 Data Collection
- 1.4.1 Partial list of primary sources
- 1.5 Data mining sources
- 1.5.1 Paid sources
- 1.5.1.1 Sources, by region
- 1.5.1 Paid sources
- 1.6 Base estimates and calculations
- 1.6.1 Base year calculation for any one approach
- 1.7 Forecast model
- 1.7.1 Quantified market impact analysis
- 1.7.1.1 Mathematical impact of growth parameters on forecast
- 1.7.1 Quantified market impact analysis
- 1.8 Research transparency addendum
- 1.8.1 Source attribution framework
- 1.8.2 Quality assurance metrics
- 1.8.3 Our commitment to trust
Chapter 2 Executive Summary
- 2.1 Industry 360° synopsis, 2022 - 2035
- 2.2 Key market trends
- 2.2.1 Regional
- 2.2.2 Component
- 2.2.3 Organization Size
- 2.2.4 Capacity
- 2.2.5 Phase
- 2.2.6 Topology
- 2.2.7 Distribution Channel
- 2.2.8 End Use
- 2.3 TAM Analysis, 2026-2035
- 2.4 CXO perspectives: Strategic imperatives
Chapter 3 Industry Insights
- 3.1 Industry ecosystem analysis
- 3.1.1 Supplier landscape
- 3.1.2 Profit margin analysis
- 3.1.3 Cost structure
- 3.1.4 Value addition at each stage
- 3.1.5 Factor affecting the value chain
- 3.1.6 Disruptions
- 3.2 Industry impact forces
- 3.2.1 Growth drivers
- 3.2.1.1 Rising demand for data centers and cloud infrastructure
- 3.2.1.2 Increasing power outages and grid instability
- 3.2.1.3 Growth in industrial automation and smart manufacturing
- 3.2.1.4 Expansion of telecommunications and 5G infrastructure
- 3.2.2 Industry pitfalls and challenges
- 3.2.2.1 High installation and maintenance costs
- 3.2.2.2 Limited battery lifespan and disposal concerns
- 3.2.3 Market opportunities
- 3.2.3.1 Expansion of edge computing infrastructure
- 3.2.3.2 Adoption of lithium-ion battery technology
- 3.2.3.3 Integration with renewable energy systems
- 3.2.1 Growth drivers
- 3.3 Growth potential analysis
- 3.4 Technology and innovation landscape
- 3.4.1 Current technological trends
- 3.4.2 Emerging technologies
- 3.5 Pricing Analysis (Driven by primary research)
- 3.5.1 Historical Price Trend Analysis
- 3.5.2 Pricing Strategy by Player Type
- 3.6 Regulatory landscape
- 3.6.1 North America
- 3.6.1.1 U.S. Department of Energy energy conservation standards for uninterruptible power supplies
- 3.6.1.2 UL 1778 safety and compliance requirements for uninterruptible power systems
- 3.6.1.3 National Electrical Code installation requirements for UPS systems
- 3.6.1.4 NFPA 110 and NFPA 111 requirements for emergency and standby power systems
- 3.6.1.5 Canadian Electrical Code and CSA C22.2 No. 107.3 requirements for UPS systems
- 3.6.2 Europe
- 3.6.2.1 Low Voltage Directive 2014 35 EU
- 3.6.2.2 Electromagnetic Compatibility Directive 2014 30 EU
- 3.6.2.3 Ecodesign requirements for standby and off mode power consumption
- 3.6.2.4 Restriction of Hazardous Substances Directive for electrical and electronic equipment
- 3.6.2.5 Waste Electrical and Electronic Equipment Directive and Batteries Regulation
- 3.6.3 Asia Pacific
- 3.6.3.1 China hazardous substance control requirements for electrical and electronic products
- 3.6.3.2 China regulations for recovery and disposal of waste electric and electronic products
- 3.6.3.3 India IS 16242 Part 1 general and safety requirements for UPS
- 3.6.3.4 Japan Electrical Appliances and Materials Safety Act and PSE marking requirements
- 3.6.3.5 Australia electrical goods safety and energy efficiency framework
- 3.6.4 Latin America
- 3.6.4.1 Brazil INMETRO conformity assessment and compulsory certification requirements
- 3.6.4.2 Brazil reverse logistics requirements for electronic waste and batteries
- 3.6.4.3 Mexico electrical installation requirements under NOM 001 SEDE 2012
- 3.6.4.4 Mexico UPS equipment standard based on UL 1778 and IEC 62040
- 3.6.4.5 Mercosur trade facilitation and technical harmonization frameworks
- 3.6.5 Middle East & Africa
- 3.6.5.1 UAE Certificates of Conformity for products subject to technical regulations
- 3.6.5.2 UAE telecommunications equipment approval and registration requirements
- 3.6.5.3 Saudi Arabia SASO conformity certificate and electrical equipment technical regulations
- 3.6.5.4 South Africa NRCS compulsory specifications for electrical products
- 3.6.1 North America
- 3.7 Porter's analysis
- 3.8 PESTEL analysis
- 3.9 Patent analysis (Driven by primary research)
- 3.10 Trade Data Analysis (Driven by paid database)
- 3.10.1 Import/export volume & value trends
- 3.10.2 Key trade corridors & tariff impact
- 3.11 Cost breakdown analysis
- 3.12 Impact of AI and Generative AI on the Market
- 3.12.1 AI Driven Disruption of Existing Business Models
- 3.12.2 GenAI Use Cases and Adoption Roadmap by Segment
- 3.12.3 Risks Limitations and Regulatory Considerations
- 3.13 Capacity & Production Landscape (Driven by Primary Research)
- 3.13.1 Installed Capacity by Region & Key Producer
- 3.13.2 Capacity Utilization Rates & Expansion Pipelines
- 3.14 Sustainability and environmental aspects
- 3.14.1 Sustainable practices
- 3.14.2 Waste reduction strategies
- 3.14.3 Energy efficiency in production
- 3.14.4 Eco-friendly Initiatives
- 3.14.5 Carbon footprint considerations
- 3.15 Forecast assumptions & scenario analysis (Driven by Primary Research)
- 3.15.1 Base Case- Key Macro & Industry Variables Driving CAGR
- 3.15.2 Optimistic Scenarios- Favorable macro and industry tailwinds
- 3.15.3 Pessimistic Scenario - Macroeconomic slowdown or industry headwinds
Chapter 4 Competitive Landscape, 2025
- 4.1 Introduction
- 4.2 Company market share analysis
- 4.2.1 North America
- 4.2.2 Europe
- 4.2.3 Asia Pacific
- 4.2.4 LATAM
- 4.2.5 MEA
- 4.3 Competitive analysis of major market players
- 4.4 Competitive positioning matrix
- 4.5 Key developments
- 4.5.1 Mergers & acquisitions
- 4.5.2 Partnerships & collaborations
- 4.5.3 New Product Launches
- 4.5.4 Expansion Plans and funding
- 4.6 Company tier benchmarking
- 4.6.1 Tier classification criteria & qualifying thresholds
- 4.6.2 Tier positioning matrix by revenue, geography & innovation
Chapter 5 Market Estimates & Forecast, By Component, 2022 - 2035 (USD Mn, Units)
- 5.1 Key trends
- 5.2 Solution
- 5.2.1 Standby (Offline)
- 5.2.2 Line-interactive
- 5.2.3 Online UPS
- 5.3 Service
- 5.3.1 Professional
- 5.3.2 Managed
Chapter 6 Market Estimates & Forecast, By Organization Size, 2022 - 2035 (USD Mn, Units)
- 6.1 Key trends
- 6.2 SME
- 6.3 Large enterprise
Chapter 7 Market Estimates & Forecast, By Capacity, 2022 - 2035 (USD Mn, Units)
- 7.1 Key trends
- 7.2 Below 1 kVA
- 7.3 1.1 - 5 kVA
- 7.4 5.1 - 20 kVA
- 7.5 20.1 - 50 kVA
- 7.6 50.1 - 200 kVA
- 7.7 Above 200 kVA
Chapter 8 Market Estimates & Forecast, By Phase, 2022 - 2035 (USD Mn, Units)
- 8.1 Key trends
- 8.2 Single phase
- 8.3 Three phase
Chapter 9 Market Estimates & Forecast, By Deployment Architecture, 2022 - 2035 (USD Mn, Units)
- 9.1 Key trends
- 9.2 Centralized
- 9.3 Decentralized
Chapter 10 Market Estimates & Forecast, By Distribution Channel, 2022 - 2035 (USD Mn, Units)
- 10.1 Key trends
- 10.2 Direct sales
- 10.3 Indirect sales
- 10.3.1 Distributors
- 10.3.2 Value-Added Resellers (VARs)
- 10.3.3 E-commerce platforms
Chapter 11 Market Estimates & Forecast, By End Use, 2022 - 2035 (USD Mn, Units)
- 11.1 Key trends
- 11.2 BFSI
- 11.3 Data center
- 11.3.1 Hyperscale data centers
- 11.3.2 Colocation facilities
- 11.3.3 Enterprise data centers
- 11.3.4 Edge computing facilities
- 11.4 Healthcare
- 11.5 Telecommunications
- 11.6 Industrial applications
- 11.7 Government & defense
- 11.8 Others
Chapter 12 Market Estimates & Forecast, By Region, 2022 - 2035 (USD Mn, Units)
- 12.1 Key trends
- 12.2 North America
- 12.2.1 US
- 12.2.2 Canada
- 12.3 Europe
- 12.3.1 Germany
- 12.3.2 UK
- 12.3.3 France
- 12.3.4 Italy
- 12.3.5 Spain
- 12.3.6 Russia
- 12.3.7 Norway
- 12.3.8 Netherlands
- 12.3.9 Sweden
- 12.4 Asia Pacific
- 12.4.1 China
- 12.4.2 India
- 12.4.3 Japan
- 12.4.4 Australia
- 12.4.5 South Korea
- 12.4.6 Singapore
- 12.4.7 Thailand
- 12.4.8 Indonesia
- 12.4.9 Vietnam
- 12.5 Latin America
- 12.5.1 Brazil
- 12.5.2 Mexico
- 12.5.3 Argentina
- 12.6 MEA
- 12.6.1 South Africa
- 12.6.2 Saudi Arabia
- 12.6.3 UAE
- 12.6.4 Turkey
Chapter 13 Company Profiles
- 13.1 Global Players
- 13.1.1 ABB
- 13.1.2 CyberPower
- 13.1.3 Delta Electronics
- 13.1.4 Eaton
- 13.1.5 Huawei
- 13.1.6 Legrand
- 13.1.7 Mitsubishi Electric
- 13.1.8 Schneider Electric
- 13.1.9 Socomec
- 13.1.10 Vertiv
- 13.2 Regional Players
- 13.2.1 AEG Power Solutions
- 13.2.2 Borri
- 13.2.3 Fuji Electric
- 13.2.4 Kehua Tech
- 13.2.5 Piller Power Systems
- 13.2.6 Riello UPS
- 13.2.7 Toshiba International Corporation
- 13.3 Emerging Players / Disruptors
- 13.3.1 Active Power
- 13.3.2 Natron Energy
- 13.3.3 ZincFive
 2026年關鍵電力領域十大成長機遇
 無變壓器UPS:市場佔有率分析、產業趨勢與統計、成長預測(2026-2031年)
 不斷電系統(UPS)市場:按技術、容量、相位和應用分類-2026-2032年全球市場預測
 無變壓器UPS市場報告:按組件、輸出、終端用戶產業及地區分類(2026-2034年)
 2026年全球汽車不斷電系統(UPS)(車載UPS)市場報告
 不斷電系統(UPS)市場:按容量、類型、應用和地區分類不斷電系統(UPS)系統市場規模、佔有率、趨勢和預測:按類型、額定功率、最終用戶和地區分類,2026-2034年2026年全球不斷電系統(UPS)市場報告
 UPS市場-全球產業規模、佔有率、趨勢、機會及預測(依容量、技術、電力消耗、地區及競爭格局分類,2021-2031年)商用UPS市場-全球產業規模、佔有率、趨勢、機會和預測:按容量、技術、最終用戶、地區和競爭格局分類,2021-2031年