


 |
市場調查報告書
商品編碼
2100668
不斷電系統(UPS):市場佔有率分析、行業趨勢和統計數據、成長預測(2026-2031)Uninterruptible Power Supply (UPS) - Market Share Analysis, Industry Trends & Statistics, Growth Forecasts (2026 - 2031) |
||||||

※ 本網頁內容可能與最新版本有所差異。詳細情況請與我們聯繫。
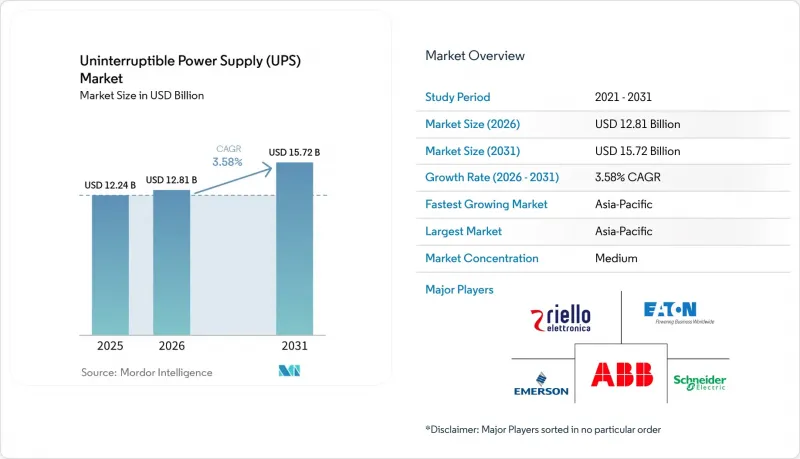
根據 Mordor Intelligence 預測,不斷電系統(UPS) 市場預計將從 2025 年的 122.4 億美元成長到 2026 年的 128.1 億美元,到 2031 年達到 157.2 億美元,2026 年至 2031 年的複合年成長率為 3.58%。
本報告按容量(小於 10 千伏安、10-100 千伏安、100 千伏安及以上)、類型(備用、線上互動、線上/雙轉換)、應用(資料中心、電信、醫療、工業製造、商業/零售、住宅)和地區(北美、歐洲、亞太、南美、中東和非洲)進行分類。
全球不斷電系統(UPS)市場趨勢與洞察
擴大資料中心容量並建造超大規模設施
到2025年,超大規模營運商將新增2.8吉瓦的容量並運作,其中AWS、微軟和谷歌將佔63%。位於北維吉尼亞、法蘭克福、新加坡和孟買的資料中心叢集佔大型系統訂單的42%,給超過1兆瓦的模組的區域供應鏈帶來了壓力。雲端服務等級協定(SLA)規定,停機每分鐘罰款高達1萬美元,這推動了「2N」和「2N+1」拓撲結構的採用,使每兆瓦的UPS面積翻倍。模組化UPS平台支援分階段部署,可在10年內減少18%的閒置資金。預製電氣室的引入將現場施工時間從14個月縮短至7個月,緩解了人手不足造成的瓶頸。歐盟能源效率指令規定的季度PUE報告要求進一步推動了採購趨勢轉向高效線上雙轉換UPS。
超過 30 kW 的高密度 AI 伺服器機架正在推動鋰離子 UPS 系統的普及。
NVIDIA H100/H200 GPU 機架的功率超過 35 kW,是傳統伺服器負載的三倍,因此向鋰離子電池的過渡正在加速推進。鋰離子電池的能量密度是 VRLA(鉛酸電池)的三倍。營運商透過將電池機房占地面積減少 40%,並將暖通空調負載降低 8 kW/MW,每年可節省 75,000 美元的冷卻成本。然而,安全隱患依然存在。 2024 年,歐洲託管資料中心發生了三起鋰離子電池起火事故,導致保險公司將 UPS 容量超過 5 MWh 的設施的保費提高了 22%。符合 IEC 62619 和 UL 1973 標準現已成為超大規模資料中心業者競標的強制性要求。電池級溫度感測器和氣溶膠滅火系統會使系統成本增加 120 美元/kWh,但有助於降低熱失控的風險。
IGBT和功率半導體供應緊張
2025年,電動車和逆變器的需求佔總產能的68%,導致1200V IGBT的前置作業時間延長至26週。 SiC MOSFET的供應仍維持40週的配額,新廠的運作已延後至2027年下半年。 600A組件的現貨價格年增34%,對中型供應商的利潤率帶來壓力。 Vertiv和Eaton目前正在設計可相容IGBT或SiC組件的平台,並允許3%的效率下降以確保生產連續性。中國供應商科華科技和英威達能源受惠於比亞迪半導體的國內IGBT生產線,而歐洲系統整合商則面臨1200V以上元件的出口限制。
細分市場分析
2025年,10 kVA以下的電力系統出貨量將佔主導地位,佔總出貨量的47.47%。這反映了邊緣辦公室和智慧零售場所對即插即用型設備的需求。 10-100 kVA的中檔系統主要供應給中小企業和通訊樞紐,但宏觀經濟的不確定性導致2025年的支出較為低迷。預計到2031年,100 kVA以上的電力系統市場將以4.43%的複合年成長率成長,因為超大規模園區將採用1 MW的模組進行並聯冗餘配置。模組化部署允許營運商分階段引入250 kW的模組,從而將10年投資回報率(ROI)提高14%。
到2025年,鋰離子電池將佔100 kVA以上UPS出貨量的62%,但僅佔10 kVA以下UPS出貨量的8%。這是因為每千瓦時400美元的高昂成本對於輕負載應用而言並不划算。採用SiC MOSFET的平台在50%負載下可實現98%的效率,每兆瓦可減少120千瓦的冷卻負荷,節省12個機架的安裝空間,並符合超大規模資料中心業者目前要求的VFI-SS-111標準。 10-100 kVA範圍內的機架式UPS可減少30%的銅線用量,並加速故障辨識速度,進而削弱集中式UPS部署的必要性。
區域分析
預計到2025年,亞太地區將佔全球銷售額的34.39%,並以3.96%的複合年成長率成長,這主要得益於中國製造業的強勁實力和印度的「數位印度」計畫。中國國內供應商憑藉垂直整合的IGBT供應鏈,佔據了國內市場28%的佔有率,使其產品價格比西方競爭對手低18%。預計到2030年,印度的資料中心容量將成長兩倍,達到2850兆瓦,這將持續推動對1兆瓦以上模組化UPS系統的需求。在日本,為符合0.6g抗震標準,正在進行抗震加固,這將使每千伏安額外的成本增加80美元。預計到2025年,東協將吸引42億美元的外國直接投資(FDI)進入資料中心領域。新加坡土地面積有限,但在高密度建設方面發揮主導作用,這需要先進的冷卻和電力供應技術。澳洲的批發需量反應計畫每兆瓦時提供 45 澳元的電網服務收入,使 UPS 系統的經濟效益提高了 6%。
北美市場以北維吉尼亞、達拉斯-沃斯堡和矽谷運作中的6.2吉瓦超大規模資料中心容量為中心。美國資料中心採用2N+1冗餘設計,導致每兆瓦的UPS面積增加兩倍,因為停機損失高達每分鐘1萬美元。水力資源豐富的加拿大省份正在吸引人工智慧叢集,這些集群需要50-200兆瓦的UPS模組,而低於每千瓦時0.04美元的電價抵消了雙轉換系統的低效。隨著IMMEX分階段投產,預計2025年,墨西哥的近岸外包將使工業UPS需求增加340兆瓦。加州的「第24號法規」即時PUE揭露要求正促使買家轉向效率高達99%的節能模式UPS。
歐洲市場由德國、英國和法國主導,三國佔全球出貨量的62%。北歐國家正利用可再生能源和寒冷氣候優勢,部署可在-20 度C低溫下運作的UPS系統,但每千伏安的溢價為50美元。歐盟的目標是到2027年將PUE值降至1.3以下,這加速了對效率高達98%的碳化矽(SiC)系統的需求。受制裁影響,俄羅斯市場先進功率半導體的採購舉步維艱,阻礙了提高UPS效率的努力。在南歐,V2G(車輛到電網)試點計畫的部署可能會蠶食小容量UPS系統的需求。
南美洲市場以巴西為中心,線上互動式UPS系統在巴西日益普及,以應對頻繁的電壓驟降。在阿根廷,由於貨幣波動和35%的進口關稅,混合發電機解決方案的使用量正在增加。在哥倫比亞,8200個新的5G基地台正在將服務網路擴展到安第斯山脈的偏遠地區。在中東和非洲,沙烏地阿拉伯的NEOM計劃部署1.5吉瓦的UPS系統;而在南非,長達200天的計劃性停電危機使得UPS系統成為必需品,儘管關稅很高。
其他好處:
- Excel格式的市場預測(ME)表
- 3個月的分析師支持
目錄
第1章:引言
- 研究假設和市場定義
- 調查範圍
第2章:調查方法
第3章執行摘要
第4章 市場狀況
- 市場概覽
- 市場促進因素
- 資料中心容量擴張的蓬勃發展和超大規模設施建設的不斷增加
- 5G 和工業 4.0 中邊緣運算的引入
- 關鍵醫療設施的備援義務
- 以模組化UPS系統取代現有設施的趨勢正在迅速成長。
- 超過 30 kW 的 AI 伺服器機架密度不斷增加,推動了鋰離子 UPS 系統的普及。
- 電池即服務 (BaaS) 合約降低了資本投資的門檻。
- 市場限制因素
- 與替代發電設施相比,其資本投資和營運成本較高。
- 收緊IGBT和功率半導體的供應鏈
- 有關併網儲能的法規正在延緩其實施。
- 高密度鋰離子電池架有熱失控風險
- 供應鏈分析
- 監理情勢
- 技術趨勢(SiC MOSFET、鋰離子電池、飛輪、燃料電池UPS)
- 波特五力模型
第5章 市場規模與成長預測
- 按產能
- 小於 10 千伏安
- 10~100 kVA
- 100千伏安或以上
- 按類型
- 支援
- 行交互類型
- 線上/雙重轉換
- 透過使用
- 資料中心
- 電訊
- 衛生保健
- 工業製造
- 商業和零售
- 住宅
- 按地區
- 北美洲
- 美國
- 加拿大
- 墨西哥
- 歐洲
- 德國
- 英國
- 法國
- 義大利
- 西班牙
- 北歐國家
- 俄羅斯
- 其他歐洲國家
- 亞太地區
- 中國
- 印度
- 日本
- 韓國
- 東南亞國協
- 澳洲和紐西蘭
- 其他亞太國家
- 南美洲
- 巴西
- 阿根廷
- 哥倫比亞
- 其他南美國家
- 中東和非洲
- 沙烏地阿拉伯
- 阿拉伯聯合大公國
- 南非
- 埃及
- 其他中東和非洲國家
- 北美洲
第6章 競爭情勢
- 市場集中度
- 策略趨勢(併購、聯盟、購電協議)
- 市場佔有率分析(主要公司的市場排名和佔有率)
- 公司簡介
- ABB
- Eaton
- Schneider Electric
- Vertiv
- Emerson(Vertiv legacy)
- Riello UPS
- Delta Electronics
- Mitsubishi Electric
- Hitachi Energy
- Huawei Digital Power
- Toshiba Infrastructure
- Socomec
- AEG Power Solutions
- CyberPower
- Kehua Tech
- Fuji Electric
- Piller Power Systems
- Tripp Lite(Eaton)
- INVT Power
- Legrand
第7章 市場機會與未來展望
According to Mordor Intelligence, the uninterruptible power supply market size is expected to increase from USD 12.24 billion in 2025 to USD 12.81 billion in 2026 and reach USD 15.72 billion by 2031, growing at a CAGR of 3.58% over 2026-2031.
This report is Segmented by Capacity (Less Than 10 KVA, 10 To 100 KVA, and Above 100 KVA), Type (Standby, Line-Interactive, and Online/Double-conversion), Application (Data Centers, Telecommunications, Healthcare, Industrial Manufacturing, Commercial and Retail, and Residential), and Geography (North America, Europe, Asia-Pacific, South America, and Middle East and Africa).
Global Uninterruptible Power Supply (UPS) Market Trends and Insights
Data-Center Capacity Boom & Hyperscale Build-Outs
Hyperscale operators commissioned 2.8 GW of new capacity in 2025, with AWS, Microsoft, and Google accounting for 63% of additions. Shipment clusters in Northern Virginia, Frankfurt, Singapore, and Mumbai absorbed 42% of large-system orders, stressing regional supply chains for >1 MW modules. Cloud SLAs now penalize downtime at USD 10,000 per minute, pushing the adoption of 2N and 2N+1 topologies that double UPS footprint per megawatt. Modular UPS platforms allow phased deployment, reducing stranded capital by 18% across a 10-year horizon. Prefabricated electrical rooms trimmed on-site build time from 14 months to 7 months, easing labor bottlenecks. The EU Energy Efficiency Directive's quarterly PUE reporting requirement further tilts procurement toward high-efficiency online double-conversion units.
AI Server Rack Densities >30 kW Driving Lithium-Ion UPS Adoption
NVIDIA H100/H200 GPU racks exceed 35 kW, tripling legacy server loads and prompting a pivot to lithium-ion batteries that deliver triple the energy density of VRLA alternatives. Operators reclaim 40% of battery-room floor space and cut HVAC load by 8 kW per megawatt, translating to USD 75,000 annual cooling savings. Safety concerns persist: three lithium-ion fires hit European colocation sites in 2024, leading insurers to lift premiums 22% for facilities with >5 MWh UPS capacity. Compliance with IEC 62619 and UL 1973 is now a must-have gate in hyperscaler tenders. Cell-level thermal sensors and aerosol suppression add USD 120 per kWh to system cost, but help contain thermal-runaway risk.
Supply-Chain Tightness in IGBTs & Power Semiconductors
Lead times for 1200 V IGBTs stretched to 26 weeks in 2025 as EV and inverter demand soaked up 68% of capacity. SiC MOSFET supply remains on 40-week allocations, with new fabs delayed until late 2027. Spot prices for 600 A modules leapt 34% year over year, compressing mid-tier vendor margins. Vertiv and Eaton now design platforms that accept either IGBT or SiC modules, trading 3% efficiency to ensure continuity. Chinese suppliers Kehua Tech and INVT Power benefit from domestic IGBT lines by BYD Semiconductor, while European integrators face export controls on >1200 V devices.
Other drivers and restraints analyzed in the detailed report include:
- Edge Computing Roll-Outs in 5G & Industry 4.0
- Battery-as-a-Service Contracts Lowering Capex Barriers
- High Capex/Opex Versus Generator Alternatives
For complete list of drivers and restraints, kindly check the Table Of Contents.
Segment Analysis
Shipments below 10 kVA dominated with 47.47% in 2025, reflecting edge offices and smart-retail nodes that favor easy plug-and-play units. Mid-tier 10-100 kVA systems serve small and medium enterprises and telecom hubs, yet macro uncertainty muted spend in 2025. The >100 kVA cohort will rise at a 4.43% CAGR through 2031 as hyperscale campuses adopt parallel-redundant 1 MW modules. Modular rollout lets operators stage 250 kW blocks, improving 10-year ROI by 14%.
Lithium-ion commanded 62% of >100 kVA shipments in 2025 but only 8% of sub-10 kVA units because its USD 400 per kWh premium is unjustified for light-duty loads. SiC MOSFET-enabled platforms hit 98% efficiency at 50% load, freeing 120 kW of cooling per MW, room for 12 extra racks, and meeting VFI-SS-111 specs that hyperscalers now demand. Rack-level UPS in the 10-100 kVA band saves 30% copper and isolates faults faster, eroding the case for centralized plant.
Complete Report Scope:
- By Capacity
- Less than 10 kVA
- 10 to 100 kVA
- Above 100 kVA
- By Type
- Standby
- Line-interactive
- Online/Double-conversion
- By Application
- Data Centers
- Telecommunications
- Healthcare
- Industrial Manufacturing
- Commercial and Retail
- Residential
- By Geography
- North America
- United States
- Canada
- Mexico
- Europe
- Germany
- United Kingdom
- France
- Italy
- Spain
- NORDIC Countries
- Russia
- Rest of Europe
- Asia-Pacific
- China
- India
- Japan
- South Korea
- ASEAN Countries
- Australia and New Zealand
- Rest of Asia-Pacific
- South America
- Brazil
- Argentina
- Colombia
- Rest of South America
- Middle East and Africa
- Saudi Arabia
- United Arab Emirates
- South Africa
- Egypt
- Rest of Middle East and Africa
- North America
Geography Analysis
Asia-Pacific delivered 34.39% of 2025 revenue and will expand at a 3.96% CAGR, buoyed by China's manufacturing engine and India's Digital India mandate. Domestic suppliers hold a 28% Chinese share by leveraging vertically integrated IGBT supply, underselling Western peers by 18%. India's data-center capacity is set to triple to 2,850 MW by 2030, creating a sustained pull for >1 MW modular UPS. Japan adds seismic reinforcement, costing an extra USD 80 per kVA, to meet 0.6 g standards. ASEAN attracted USD 4.2 billion FDI into data centers in 2025; land-constrained Singapore leads with high-density builds demanding advanced cooling and power. Australia's wholesale demand response garners AUD 45 per MWh in grid-services revenue, improving UPS economics by 6%.
North America market is centered on 6.2 GW of commissioned hyperscale capacity in Northern Virginia, Dallas-Fort Worth, and Silicon Valley. U.S. data centers employ 2N+1 redundancy, which is tripling UPS footprint per megawatt as downtime penalties hit USD 10,000 per minute. Canada's hydro-rich provinces attract AI clusters needing 50-200 MW UPS blocks, with sub-USD 0.04 per kWh electricity offsetting double-conversion inefficiency. Near-shoring in Mexico added 340 MW of industrial UPS demand in 2025 under phased IMMEX production. California Title 24's real-time PUE disclosure nudges buyers toward 99%-efficient eco-mode units.
The European market is led by Germany, the U.K., and France, which account for 62% of shipments. Nordic countries exploit renewable power and cool climates, installing UPS qualified for -20 °C operation at a USD 50 per kVA premium. The EU's sub-1.3 PUE target by 2027 accelerates demand for SiC-based 98%-efficient systems. Russia's sanctions-hit market struggles for advanced power semiconductors, capping efficiency upgrades. Southern Europe pilots vehicle-to-grid programs that could erode small-capacity UPS demand.
South America is anchored by Brazi,l where line-interactive UPScountersr frequent voltage sags. Argentina leans on hybrid generator solutions amid currency volatility and 35% import tariffs. Colombia's 8,200 new 5G sites stretch service networks across remote Andes. The Middle East and Africa market; Saudi Arabia's NEOM targets 1.5 GW UPS installs, and South Africa's 200-day load-shedding crisis makes UPS indispensable despite high duties.
- ABB
- Eaton
- Schneider Electric
- Vertiv
- Emerson (Vertiv legacy)
- Riello UPS
- Delta Electronics
- Mitsubishi Electric
- Hitachi Energy
- Huawei Digital Power
- Toshiba Infrastructure
- Socomec
- AEG Power Solutions
- CyberPower
- Kehua Tech
- Fuji Electric
- Piller Power Systems
- Tripp Lite (Eaton)
- INVT Power
- Legrand
Additional Benefits:
- The market estimate (ME) sheet in Excel format
- 3 months of analyst support
TABLE OF CONTENTS
1 Introduction
- 1.1 Study Assumptions & Market Definition
- 1.2 Scope of the Study
2 Research Methodology
3 Executive Summary
4 Market Landscape
- 4.1 Market Overview
- 4.2 Market Drivers
- 4.2.1 Data-center capacity boom & hyperscale build-outs
- 4.2.2 Edge computing roll-outs in 5G & Industry 4.0
- 4.2.3 Backup mandates for mission-critical healthcare facilities
- 4.2.4 Surge in modular UPS retrofits for brownfield sites
- 4.2.5 AI server rack densities >30 kW driving lithium-ion UPS adoption
- 4.2.6 Battery-as-a-Service (BaaS) contracts lowering capex barriers
- 4.3 Market Restraints
- 4.3.1 High capex/opex versus generator alternatives
- 4.3.2 Supply-chain tightness in IGBTs & power semiconductors
- 4.3.3 Grid-connected energy-storage regulations delaying deployments
- 4.3.4 Thermal run-away risks in high-density Li-ion racks
- 4.4 Supply-Chain Analysis
- 4.5 Regulatory Landscape
- 4.6 Technological Outlook (SiC MOSFETs, Li-ion, flywheel, fuel-cell UPS)
- 4.7 Porter's Five Forces
- 4.7.1 Bargaining Power of Suppliers
- 4.7.2 Bargaining Power of Buyers
- 4.7.3 Threat of New Entrants
- 4.7.4 Threat of Substitutes
- 4.7.5 Intensity of Rivalry
5 Market Size & Growth Forecasts
- 5.1 By Capacity
- 5.1.1 Less than 10 kVA
- 5.1.2 10 to 100 kVA
- 5.1.3 Above 100 kVA
- 5.2 By Type
- 5.2.1 Standby
- 5.2.2 Line-interactive
- 5.2.3 Online/Double-conversion
- 5.3 By Application
- 5.3.1 Data Centers
- 5.3.2 Telecommunications
- 5.3.3 Healthcare
- 5.3.4 Industrial Manufacturing
- 5.3.5 Commercial and Retail
- 5.3.6 Residential
- 5.4 By Geography
- 5.4.1 North America
- 5.4.1.1 United States
- 5.4.1.2 Canada
- 5.4.1.3 Mexico
- 5.4.2 Europe
- 5.4.2.1 Germany
- 5.4.2.2 United Kingdom
- 5.4.2.3 France
- 5.4.2.4 Italy
- 5.4.2.5 Spain
- 5.4.2.6 NORDIC Countries
- 5.4.2.7 Russia
- 5.4.2.8 Rest of Europe
- 5.4.3 Asia-Pacific
- 5.4.3.1 China
- 5.4.3.2 India
- 5.4.3.3 Japan
- 5.4.3.4 South Korea
- 5.4.3.5 ASEAN Countries
- 5.4.3.6 Australia and New Zealand
- 5.4.3.7 Rest of Asia-Pacific
- 5.4.4 South America
- 5.4.4.1 Brazil
- 5.4.4.2 Argentina
- 5.4.4.3 Colombia
- 5.4.4.4 Rest of South America
- 5.4.5 Middle East and Africa
- 5.4.5.1 Saudi Arabia
- 5.4.5.2 United Arab Emirates
- 5.4.5.3 South Africa
- 5.4.5.4 Egypt
- 5.4.5.5 Rest of Middle East and Africa
- 5.4.1 North America
6 Competitive Landscape
- 6.1 Market Concentration
- 6.2 Strategic Moves (M&A, Partnerships, PPAs)
- 6.3 Market Share Analysis (Market Rank/Share for key companies)
- 6.4 Company Profiles (includes Global level Overview, Market level overview, Core Segments, Financials as available, Strategic Information, Products & Services, and Recent Developments)
- 6.4.1 ABB
- 6.4.2 Eaton
- 6.4.3 Schneider Electric
- 6.4.4 Vertiv
- 6.4.5 Emerson (Vertiv legacy)
- 6.4.6 Riello UPS
- 6.4.7 Delta Electronics
- 6.4.8 Mitsubishi Electric
- 6.4.9 Hitachi Energy
- 6.4.10 Huawei Digital Power
- 6.4.11 Toshiba Infrastructure
- 6.4.12 Socomec
- 6.4.13 AEG Power Solutions
- 6.4.14 CyberPower
- 6.4.15 Kehua Tech
- 6.4.16 Fuji Electric
- 6.4.17 Piller Power Systems
- 6.4.18 Tripp Lite (Eaton)
- 6.4.19 INVT Power
- 6.4.20 Legrand
7 Market Opportunities & Future Outlook
- 7.1 White-space & Unmet-need Assessment

 不斷電系統(UPS) 市場:2026-2032 年全球市場預測(依 UPS 系統類型、容量、相數、安裝類型、應用和銷售管道)
 可再生能源供應鏈解決方案市場預測至2034年—按解決方案類型、部署模式、技術、應用、最終用戶和地區分類的全球分析
 UPS全球市場規模、佔有率、趨勢和成長分析報告(2026-2034年)2026年關鍵電力領域十大成長機遇
 無變壓器UPS:市場佔有率分析、產業趨勢與統計、成長預測(2026-2031年)
 不斷電系統(UPS)市場機會、成長要素、產業趨勢分析及2026-2035年預測
 機架式 UPS 市場:依產品類型、容量、應用、最終用戶和地區分類。
 無變壓器UPS市場報告:按組件、輸出、終端用戶產業及地區分類(2026-2034年)
 2026年全球汽車不斷電系統(UPS)(車載UPS)市場報告不斷電系統(UPS)市場:按容量、類型、應用和地區分類