


 |
市場調查報告書
商品編碼
2045726
2026 年至 2035 年自行車和滑板車租賃的市場機會、成長要素、產業趨勢和預測。Bike and Scooter Rental Market Opportunity, Growth Drivers, Industry Trend Analysis, and Forecast 2026 - 2035 |
||||||
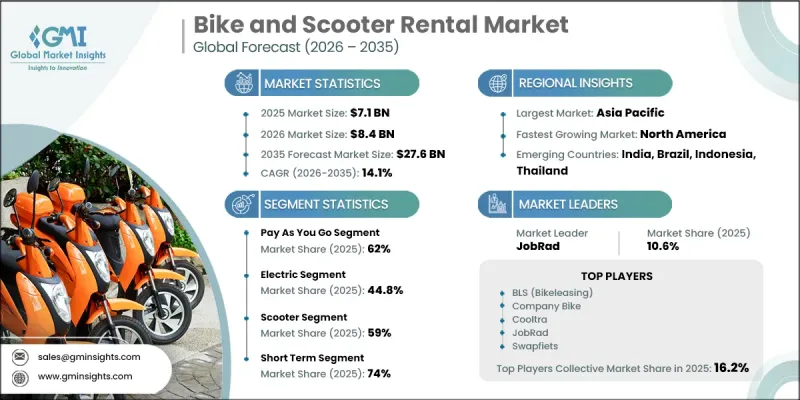
2025年全球自行車和滑板車租賃市場價值71億美元,預計到2035年將以14.1%的複合年成長率成長至276億美元。
隨著都市區持續成長,交通擁擠在全球各大城市日益嚴峻,自行車和電動滑板車租賃產業正經歷顯著的擴張。湧入都市區的人口不斷增加,推動了人們對便利、柔軟性且經濟實惠的共享出行解決方案的需求。租賃業務中數位化技術的快速應用進一步提升了客戶的便利性,用戶可以透過應用程式、數位支付和即時車輛追蹤等方式使用車輛。此外,政府支持永續交通途徑和低排放出行的措施也對市場成長產生了積極影響。許多城市正大力投資建造自行車基礎設施、專用自行車道和環保型城市交通系統,以促進共享出行服務的普及。無樁租賃系統的日益普及也正在改變整個行業,為用戶提供更大的柔軟性和無縫車輛使用體驗,無需固定停靠站。人們對永續交通途徑的日益關注以及對經濟實惠的短途出行需求的不斷成長,預計將繼續推動全球自行車和電動滑板車租賃市場的成長。
| 市場範圍 | |
|---|---|
| 開始年份 | 2025 |
| 預測期 | 2026-2035 |
| 上市時的市場規模 | 71億美元 |
| 預測市場規模 | 276億美元 |
| 複合年成長率 | 14.1% |
計量收費市場佔62%的市場佔有率,預計2026年至2035年將以12.6%的複合年成長率成長。消費者對靈活便捷的租賃方案的強勁需求持續推動著該細分市場的成長。用戶越來越傾向於短期租賃模式,以便立即獲得出行解決方案,而無需簽訂長期或訂閱合約。在需求旺盛的都市區和交通樞紐,計量型服務的需求持續成長,這要求營運商保持充足的車輛供應,並採取動態定價策略,以最大限度地提高車輛利用率和營運效率。
預計到2025年,電動車市佔率將達到44.8%,並在2026年至2035年間以17.5%的複合年成長率成長。人們對環保且經濟實惠的交通途徑的需求日益成長,正在加速城市交通網路中電動二輪車的普及。與傳統的燃油車輛相比,電動自行車和電動滑板車的運作和維護成本更低,因此越來越受歡迎。向永續交通系統的轉型以及由此帶來的電動出行解決方案的日益普及,進一步推動了全球電動車市場的強勁成長。
中國自行車和電動滑板車租賃市場佔38%的市場佔有率,預計到2025年市場規模將達到11億美元。中國的自行車和電動滑板車租賃產業已發展成為成熟的城市出行生態系統,能夠滿足日常通勤和短途出行的需求。政府部門透過交通法規、城市出行規劃和資料管理舉措,在市場形成過程中繼續發揮關鍵作用。隨著緩解交通堵塞和減少碳排放的努力不斷加強,地方政府被敦促加強對共享旅遊企業的監管,包括停車管理系統和車輛配置最佳化措施。
目錄
第1章:調查方法
第2章執行摘要
第3章 行業洞察
- 產業生態系分析
- 供應商情況
- 利潤率分析
- 成本結構
- 每個階段增加的價值
- 影響價值鏈的因素
- 中斷
- 影響產業的因素
- 促進因素
- 對靈活的短期運輸的需求日益成長
- 旅遊和休閒活動的擴展
- 企業和員工的租賃計劃
- 數位預訂和車輛管理系統
- 產業潛在風險與挑戰
- 高昂的維修和車輛管理成本
- 需求的季節性波動
- 市場機遇
- 企業租賃業的擴張
- 受旅遊需求的推動,租賃市場正在成長。
- 開發基於訂閱的租賃計劃
- 促進因素
- 成長潛力分析
- 監理情勢
- 北美洲
- 美國關於共享旅遊和電動滑板車的法律
- 城市針對自行車和滑板車共享的具體許可和車輛限制。
- 安全標準和安全帽規定
- 加拿大微型交通法規和地方政府指南
- 歐洲
- 歐盟關於微型交通工具和輕型電動車的法規
- 聯合國歐洲經濟委員會的汽車安全與技術標準
- 各國關於電動滑板車使用的法律與速度限制
- 環境與都市交通政策
- 亞太地區
- 中國共享單車法規與車輛管理政策
- 印度電動滑板車和自行車共享指南
- 日本的微型交通工具與道路交通安全法規
- 澳洲電動滑板車試運行的相關法規與安全規則
- 東協城市交通和汽車法規
- 拉丁美洲
- 巴西共享旅遊和安全法規
- 墨西哥關於電動滑板車和自行車共享的法律
- 阿根廷的微型交通法規
- 區域城市交通政策框架
- 中東和非洲
- 阿拉伯聯合大公國電動滑板車法規與許可
- 沙烏地阿拉伯的微型交通安全法規
- 南非共享旅遊法律規範
- 北美洲
- 波特的分析
- PESTLE分析
- 技術與創新展望
- 最新科技趨勢
- 新興技術
- 價格分析
- 對過去價格趨勢的分析
- 定價策略:按業務類型分類
- 成本細分分析
- 專利分析
- 永續性和環境方面
- 永續計劃
- 減少廢棄物策略
- 生產中的能源效率
- 具有環保意識的舉措
- 考慮碳足跡
- 人工智慧和生成式人工智慧對市場的影響
- 利用人工智慧改造現有經營模式
- 按細分市場分類的生成式人工智慧用例和部署藍圖
- 風險、限制和監管考量
- 預測假設和情境分析
- 基本案例:驅動複合年成長率的關鍵宏觀經濟與產業變量
- 樂觀情境:宏觀經濟與產業的順風
- 悲觀情景:宏觀經濟放緩或產業逆風
第4章 競爭情勢
- 介紹
- 企業市佔率分析
- 北美洲
- 歐洲
- 亞太地區
- LATAM
- 中東和非洲
- 主要市場公司的競爭分析
- 競爭定位矩陣
- 主要進展
- 併購
- 夥伴關係和聯盟
- 新產品發布
- 業務拓展計劃及資金籌措
第5章 市場估計與預測:依服務業分類,2022-2035年
- 付費使用制
- 基於訂閱
第6章 市場估計與預測:依促進因素分類,2022-2035年
- 踏板
- 電的
- 汽油
第7章 市場估價與預測:依車輛類型分類,2022-2035年
- 摩托車
- 小型摩托車
第8章 市場估算與預測:依租賃期限分類,2022-2035年
- 短期
- 長期
第9章 市場估價與預測:依最終用戶分類,2022-2035年
- 通勤者
- 遊客
- 學生
- 企業用戶
- 送貨司機
第10章 市場估價與預測:依地區分類,2022-2035年
- 北美洲
- 美國
- 加拿大
- 歐洲
- 德國
- 英國
- 法國
- 義大利
- 西班牙
- 俄羅斯
- 挪威
- 荷蘭
- 瑞典
- 亞太地區
- 中國
- 印度
- 日本
- 澳洲
- 韓國
- 新加坡
- 泰國
- 印尼
- 越南
- 拉丁美洲
- 巴西
- 墨西哥
- 阿根廷
- 中東和非洲
- 南非
- 沙烏地阿拉伯
- UAE
- 土耳其
第11章:公司簡介
- 世界公司
- Bird(Third Lane Mobility)
- JobRad
- Lime(Neutron)
- Swapfiets
- Vogo
- Zoomo
- 當地公司
- BLS(Bikeleasing)
- Company Bike
- Cooltra
- Donkey Republic
- Dott
- Felyx
- Lease a Bike
- Voi Technology
- Yulu
- Zypp Electric
- 新興企業/顛覆者
- CYCLE
- Dance
- PLUTO(GIN e-bikes)
- Upway Flex
The Global Bike and Scooter Rental Market was valued at USD 7.1 billion in 2025 and is estimated to grow at a CAGR of 14.1% to reach USD 27.6 billion by 2035.
The bike and scooter rental industry is experiencing significant expansion as urban populations continue to rise and transportation congestion becomes a growing challenge across major cities worldwide. Increasing migration toward urban centers has accelerated the demand for convenient, flexible, and cost-efficient shared mobility solutions. Rapid integration of digital technologies into rental operations has further improved customer convenience through app-based vehicle access, digital payments, and real-time fleet tracking. In addition, government initiatives supporting sustainable transportation and low-emission mobility are positively influencing market growth. Many cities are investing heavily in cycling infrastructure, dedicated mobility lanes, and environmentally friendly urban transportation systems to encourage the adoption of shared mobility services. The growing popularity of dockless rental systems is also transforming the industry by providing users with greater flexibility and seamless access to vehicles without requiring fixed docking stations. Rising awareness regarding sustainable transportation and the increasing preference for affordable short-distance travel options are expected to continue driving the growth of the global bike and scooter rental market.
| Market Scope | |
|---|---|
| Start Year | 2025 |
| Forecast Year | 2026-2035 |
| Start Value | $7.1 Billion |
| Forecast Value | $27.6 Billion |
| CAGR | 14.1% |
The pay-as-you-go segment held a 62% share and is expected to grow at a CAGR of 12.6% between 2026 and 2035. Strong consumer preference for flexible and convenient rental options continues to support the growth of this segment. Users increasingly favor short-term rental models that offer immediate access to mobility solutions without requiring long-term commitments or subscription-based agreements. High-demand urban locations and transportation hubs continue to generate significant demand for pay-as-you-go services, encouraging operators to maintain strong fleet availability and dynamic pricing strategies to maximize vehicle utilization and operational efficiency.
The electric segment accounted for 44.8% share in 2025 and is projected to grow at a CAGR of 17.5% during 2026-2035. Increasing demand for environmentally friendly and affordable transportation solutions is accelerating the adoption of electric two-wheelers across urban mobility networks. Electric bikes and scooters are gaining popularity due to their lower operational and maintenance costs compared to traditional fuel-powered alternatives. The growing transition toward sustainable transportation systems and the rising acceptance of electric mobility solutions are further contributing to strong segment growth worldwide.
China Bike and Scooter Rental Market held a 38% share, generating USD 1.1 billion in 2025. The country's bike and scooter rental industry has developed into a highly established urban mobility ecosystem that supports both daily commuting and short-distance transportation requirements. Government authorities continue to play a major role in shaping the market through transportation regulations, urban mobility planning, and data management initiatives. Increasing efforts to reduce traffic congestion and lower carbon emissions are encouraging local administrations to strengthen oversight of shared mobility operations, including parking management systems and fleet optimization measures.
Key companies operating in the Global Bike and Scooter Rental Market include BLS (Bikeleasing), Company Bike, Cooltra, Felyx, JobRad, Lease a Bike, Swapfiets, Yulu, Zoomo, and Zypp Electric. Companies operating in the bike and scooter rental market are implementing several strategic initiatives to strengthen their market presence and improve competitive positioning. Leading operators are investing heavily in expanding electric vehicle fleets to meet rising demand for sustainable urban transportation solutions. Businesses are also focusing on enhancing mobile applications and digital platforms to improve customer experience through seamless booking, navigation, and payment systems. Strategic partnerships with municipalities, transportation authorities, and corporate organizations are helping companies expand operational reach and strengthen infrastructure support. Many market participants are prioritizing fleet optimization technologies, AI-driven route management, and real-time monitoring systems to improve operational efficiency and reduce maintenance costs.
Table of Contents
Chapter 1 Methodology
- 1.1 Research approach
- 1.2 Quality Commitments
- 1.2.1 GMI AI policy & data integrity commitment
- 1.2.1.1 Source consistency protocol
- 1.2.1 GMI AI policy & data integrity commitment
- 1.3 Research Trail & Confidence Scoring
- 1.3.1 Research Trail Components
- 1.3.2 Scoring Components
- 1.4 Data Collection
- 1.4.1 Partial list of primary sources
- 1.5 Data mining sources
- 1.5.1 Paid sources
- 1.5.1.1 Sources, by region
- 1.5.1 Paid sources
- 1.6 Base estimates and calculations
- 1.6.1 Base year calculation for any one approach
- 1.7 Forecast model
- 1.7.1 Quantified market impact analysis
- 1.7.1.1 Mathematical impact of growth parameters on forecast
- 1.7.1 Quantified market impact analysis
- 1.8 Research transparency addendum
- 1.8.1 Source attribution framework
- 1.8.2 Quality assurance metrics
- 1.8.3 Our commitment to trust
Chapter 2 Executive Summary
- 2.1 Industry 360° synopsis, 2022 - 2035
- 2.2 Key market trends
- 2.2.1 Regional
- 2.2.2 Service
- 2.2.3 Propulsion
- 2.2.4 Vehicle
- 2.2.5 Rental Duration
- 2.2.6 End User
- 2.3 TAM Analysis, 2026-2035
- 2.4 CXO perspectives: Strategic imperatives
Chapter 3 Industry Insights
- 3.1 Industry ecosystem analysis
- 3.1.1 Supplier landscape
- 3.1.2 Profit margin analysis
- 3.1.3 Cost structure
- 3.1.4 Value addition at each stage
- 3.1.5 Factor affecting the value chain
- 3.1.6 Disruptions
- 3.2 Industry impact forces
- 3.2.1 Growth drivers
- 3.2.1.1 Growing demand for flexible short-term transportation
- 3.2.1.2 Expansion of tourism and leisure activities
- 3.2.1.3 Corporate and employee leasing programs
- 3.2.1.4 Digital booking and fleet management systems
- 3.2.2 Industry pitfalls and challenges
- 3.2.2.1 High maintenance and fleet management costs
- 3.2.2.2 Seasonal demand fluctuations
- 3.2.3 Market opportunities
- 3.2.3.1 Expansion in corporate leasing segment
- 3.2.3.2 Growth in tourism driven rentals
- 3.2.3.3 Development of subscription based rental plans
- 3.2.1 Growth drivers
- 3.3 Growth potential analysis
- 3.4 Regulatory landscape
- 3.4.1 North America
- 3.4.1.1 United States shared mobility regulations and e-scooter laws
- 3.4.1.2 City-level bike and scooter sharing permits and fleet caps
- 3.4.1.3 Safety standards and helmet regulations
- 3.4.1.4 Canada micromobility regulations and municipal guidelines
- 3.4.2 Europe
- 3.4.2.1 EU micromobility and light electric vehicle regulations
- 3.4.2.2 UNECE vehicle safety and technical standards
- 3.4.2.3 National e-scooter usage laws and speed limits
- 3.4.2.4 Environmental and urban mobility policies
- 3.4.3 Asia Pacific
- 3.4.3.1 China shared bike regulations and fleet management policies
- 3.4.3.2 India e-scooter and bike sharing guidelines
- 3.4.3.3 Japan micromobility and road safety regulations
- 3.4.3.4 Australia e-scooter trial regulations and safety rules
- 3.4.3.5 ASEAN urban mobility and vehicle regulations
- 3.4.4 Latin America
- 3.4.4.1 Brazil shared mobility and safety regulations
- 3.4.4.2 Mexico e-scooter and bike sharing laws
- 3.4.4.3 Argentina micromobility regulations
- 3.4.4.4 Regional urban transport policy frameworks
- 3.4.5 Middle East & Africa
- 3.4.5.1 UAE e-scooter regulations and licensing
- 3.4.5.2 Saudi Arabia micromobility safety regulations
- 3.4.5.3 South Africa shared mobility regulatory framework
- 3.4.1 North America
- 3.5 Porter's analysis
- 3.6 PESTEL analysis
- 3.7 Technology and innovation landscape
- 3.7.1 Current technological trends
- 3.7.2 Emerging technologies
- 3.8 Pricing Analysis (Driven by primary research)
- 3.8.1 Historical Price Trend Analysis
- 3.8.2 Pricing Strategy by Player Type
- 3.9 Cost breakdown analysis
- 3.10 Patent analysis (Driven by primary research)
- 3.11 Sustainability and environmental aspects
- 3.11.1 Sustainable practices
- 3.11.2 Waste reduction strategies
- 3.11.3 Energy efficiency in production
- 3.11.4 Eco-friendly Initiatives
- 3.11.5 Carbon footprint considerations
- 3.12 Impact of AI and Generative AI on the Market
- 3.12.1 AI Driven Disruption of Existing Business Models
- 3.12.2 GenAI Use Cases and Adoption Roadmap by Segment
- 3.12.3 Risks Limitations and Regulatory Considerations
- 3.13 Forecast assumptions & scenario analysis (Driven by Primary Research)
- 3.13.1 Base Case- Key Macro & Industry Variables Driving CAGR
- 3.13.2 Optimistic Scenarios- Favorable macro and industry tailwinds
- 3.13.3 Pessimistic Scenario - Macroeconomic slowdown or industry headwinds
Chapter 4 Competitive Landscape, 2025
- 4.1 Introduction
- 4.2 Company market share analysis
- 4.2.1 North America
- 4.2.2 Europe
- 4.2.3 Asia Pacific
- 4.2.4 LATAM
- 4.2.5 MEA
- 4.3 Competitive analysis of major market players
- 4.4 Competitive positioning matrix
- 4.5 Key developments
- 4.5.1 Mergers & acquisitions
- 4.5.2 Partnerships & collaborations
- 4.5.3 New Product Launches
- 4.5.4 Expansion Plans and funding
Chapter 5 Market Estimates & Forecast, By Service, 2022 - 2035 (USD Mn, Fleet Size)
- 5.1 Key trends
- 5.2 Pay as you go
- 5.3 Subscription-based
Chapter 6 Market Estimates & Forecast, By Propulsion, 2022 - 2035 (USD Mn, Fleet Size)
- 6.1 Key trends
- 6.2 Pedal
- 6.3 Electric
- 6.4 Gasoline
Chapter 7 Market Estimates & Forecast, By Vehicle, 2022 - 2035 (USD Mn, Fleet Size)
- 7.1 Key trends
- 7.2 Bike
- 7.3 Scooter
Chapter 8 Market Estimates & Forecast, By Rental Duration, 2022 - 2035 (USD Mn, Fleet Size)
- 8.1 Key trends
- 8.2 Short term
- 8.3 Long term
Chapter 9 Market Estimates & Forecast, By End User, 2022 - 2035 (USD Mn, Fleet Size)
- 9.1 Key trends
- 9.2 Commuters
- 9.3 Tourists
- 9.4 Students
- 9.5 Corporate Users
- 9.6 Delivery Personnel
Chapter 10 Market Estimates & Forecast, By Region, 2022 - 2035 (USD Mn, Fleet Size)
- 10.1 Key trends
- 10.2 North America
- 10.2.1 US
- 10.2.2 Canada
- 10.3 Europe
- 10.3.1 Germany
- 10.3.2 UK
- 10.3.3 France
- 10.3.4 Italy
- 10.3.5 Spain
- 10.3.6 Russia
- 10.3.7 Norway
- 10.3.8 Netherlands
- 10.3.9 Sweden
- 10.4 Asia Pacific
- 10.4.1 China
- 10.4.2 India
- 10.4.3 Japan
- 10.4.4 Australia
- 10.4.5 South Korea
- 10.4.6 Singapore
- 10.4.7 Thailand
- 10.4.8 Indonesia
- 10.4.9 Vietnam
- 10.5 Latin America
- 10.5.1 Brazil
- 10.5.2 Mexico
- 10.5.3 Argentina
- 10.6 MEA
- 10.6.1 South Africa
- 10.6.2 Saudi Arabia
- 10.6.3 UAE
- 10.6.4 Turkey
Chapter 11 Company Profiles
- 11.1 Global players
- 11.1.1 Bird (Third Lane Mobility)
- 11.1.2 JobRad
- 11.1.3 Lime (Neutron)
- 11.1.4 Swapfiets
- 11.1.5 Vogo
- 11.1.6 Zoomo
- 11.2 Regional players
- 11.2.1 BLS (Bikeleasing)
- 11.2.2 Company Bike
- 11.2.3 Cooltra
- 11.2.4 Donkey Republic
- 11.2.5 Dott
- 11.2.6 Felyx
- 11.2.7 Lease a Bike
- 11.2.8 Voi Technology
- 11.2.9 Yulu
- 11.2.10 Zypp Electric
- 11.3 Emerging players / disruptors
- 11.3.1 CYCLE
- 11.3.2 Dance
- 11.3.3 PLUTO (GIN e-bikes)
- 11.3.4 Upway Flex
 自行車和滑板車租賃市場:按租賃期限、產品類型、預訂方式、定價模式和最終用戶分類-2026-2032年全球市場預測
 踏板車租賃市場:按踏板車類型、功率輸出、預期用途和地區分類。
 自行車和Scooter租賃市場規模、佔有率和成長分析(按服務、動力方式、營運模式、車輛類型、應用領域、最終用戶、分銷管道和地區分類)—2026-2033年行業預測
 自行車/滑板車租賃市場 - 全球產業規模、佔有率、趨勢、機會和預測,按服務、動力方式、營運模式、地區和競爭格局分類,2020-2030 年預測
 2032 年摩托車和Scooter租賃市場預測:按車輛類型、推進類型、服務類型、客戶類型、時間段和地區進行的全球分析
 自行車/Scooter租賃市場規模、佔有率、趨勢分析報告:按動力、車輛、服務、地區、細分市場預測,2024-2030 年