

 |
市場調查報告書
商品編碼
2027647
健身器材市場:商機、成長要素、產業趨勢分析及2026-2035年預測Gym Equipment Market Opportunity, Growth Drivers, Industry Trend Analysis, and Forecast 2026 - 2035 |
||||||
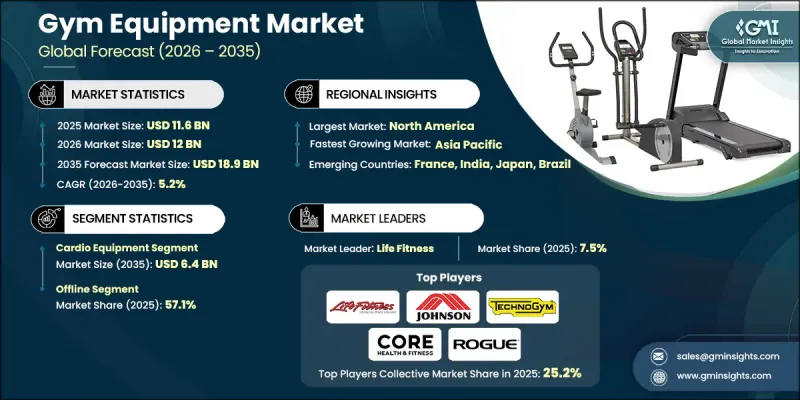
預計到 2025 年,全球健身器材市場價值將達到 116 億美元,年複合成長率為 5.2%,到 2035 年將達到 189 億美元。
全球對健康、健身和整體福祉的日益關注推動了健身器材市場的成長,人們擴大將體能鍛鍊融入日常生活。人們對保持積極生活方式重要性的認知不斷提高,促使健身房會員人數和家用健身器材的投資額雙雙成長。消費者偏好的轉變也支持了這一趨勢,他們更加重視便利性、柔軟性和長期的健康益處。此外,健身產業的擴張,以及為了滿足多樣化的訓練需求而不斷湧現的新型健身中心和工作室,也促進了對健身器材的需求成長。政府主導的體育鍛煉推廣計劃也在提高參與率和倡導更健康的生活方式方面發揮著重要作用。此外,技術進步和智慧健身解決方案的融合正在改變使用者與健身器材的互動方式,創造更個人化和互聯互通的健身體驗。預計這些因素將共同推動健身器材市場在預測期內保持穩定持續的成長。
| 市場範圍 | |
|---|---|
| 開始年份 | 2025 |
| 預測期 | 2026-2035 |
| 上市時的市場規模 | 116億美元 |
| 預計金額 | 189億美元 |
| 複合年成長率 | 5.2% |
預計2025年,心血管運動器材市場規模將達37億美元,2035年將達64億美元。該細分市場在健身器材市場中佔據重要佔有率,這主要得益於其在改善心血管健康、體重管理和耐力方面的廣泛應用。心血管運動器材兼具多功能性和便利性,適合不同健身程度的使用者。其支持個人化訓練計劃並帶來可衡量的健身效果的能力,持續推動其在個人消費者和商業健身機構中的流行。
預計到2025年,線下通路仍將佔據57.1%的市場佔有率,儘管數位銷售管道發展迅速,但線下通路仍將保持主導地位。實體店的重要性不言而喻,因為它們能夠讓消費者親身體驗產品,並提供個人化的客戶服務。消費者可以從商店演示、專家指導和售後支援中受益,從而做出明智的購買決策。此外,持續推動的促進身體健康的公共措施也間接推動了線下通路銷售的設備需求成長,進一步鞏固了線下通路的市場地位。
預計到2025年,美國健身器材市場佔有率將達到53.9%,這主要得益於人們健康意識的提高、對預防性健身解決方案需求的成長以及積極生活方式的普及。隨著運動習慣的改變和數位健身平台的普及,消費者對家用健身器材的投資也日益增加。商業健身中心和專業健身工作室的擴張也推動了市場成長。此外,智慧型設備、互聯系統和數據驅動訓練功能的不斷進步,也促使健身器材頻繁升級換代,並在全部區域創造了持續的需求。
目錄
第1章:調查方法和範圍
第2章執行摘要
第3章業界考察
- 生態系分析
- 供應商情況
- 利潤率
- 每個階段增加的價值
- 影響價值鏈的因素
- 影響產業的因素
- 促進因素
- 提高健康意識,重視預防保健
- 居家健身和混合運動模式的成長
- 智慧健身設備的技術進步
- 產業潛在風險與挑戰
- 拓展新興市場
- 智慧、高度互聯、小巧的設備迅速普及。
- 機會
- 該設備的初始成本相對較高。
- 對耐用性、維護和產品壽命的擔憂
- 促進因素
- 成長潛力分析
- 未來市場趨勢
- 科技與創新趨勢
- 當前技術趨勢
- 新興技術
- 監理情勢
- 標準和合規要求
- 區域法規結構
- 認證標準
- 貿易數據分析
- 進出口量及進口額趨勢
- 主要貿易路線及關稅的影響
- 人工智慧和生成式人工智慧對市場的影響
- 利用人工智慧改造現有經營模式
- 按細分市場分類的生成式人工智慧用例和部署藍圖
- 風險、限制和監管考量
- 定價分析(基於初步研究)
- 對過去價格趨勢的分析(基於初步研究)
- 根據業務類型分類的定價策略(高階/價值/成本加成)(基於初步調查)
- 各地區價格波動
- 原物料成本對定價的影響
- 波特五力分析
- PESTEL 分析
- 消費行為分析
- 購買模式
- 偏好分析
- 不同地區的消費行為差異
- 電子商務對購買決策的影響
第4章 競爭情勢
- 介紹
- 企業市佔率分析
- 按地區
- 企業矩陣分析
- 主要市場公司的競爭分析
- 競爭定位矩陣
- 主要進展
- 併購
- 夥伴關係與合作
- 新產品發布
- 業務拓展計劃
第5章 市場估算與預測:依產品類型分類,2022-2035年
- 有氧運動器材
- 跑步機
- 橢圓機
- 有氧踩踏機
- 划船機
- 爬樓梯機
- 其他
- 肌力訓練器材
- 選擇器式體重秤
- 自由重量器材:啞鈴、槓鈴、壺鈴
- 臥推凳和架子
- 纜繩和滑輪系統
- 平板載重式設備
- 功能訓練器材
- 懸掛訓練器
- 藥球和實心球
- 戰繩
- 跳箱
- 敏捷性和速度裝備
- 柔軟性和平衡設備
- 瑜珈墊和輔助用具
- 泡沫軸
- 平衡板/穩定設備
- 阻力帶
- 皮拉提斯器材
- 其他
第6章 市場估計與預測:依類型分類,2022-2035年
- 室內設備
- 戶外裝備
第7章 市場估計與預測:依價格分類,2022-2035年
- 低的
- 中等的
- 高的
第8章 市場估算與預測:依類別分類,2022-2035年
- 智慧型裝置
- 支援物聯網的連網設備
- 整合應用程式的設備
- 人工智慧驅動的個人訓練系統
- 相容於虛擬實境和遊戲化的設備
- 常規飛機
- 機械/類比設備
- 基本電子設備
第9章 市場估計與預測:依應用領域分類,2022-2035年
- 減重
- 健美
- 健身
- 心理健身
- 其他
第10章 市場估價與預測:依最終用途分類,2022-2035年
- 普通家庭
- 健身中心
- 運動員/職業
第11章 市場估價與預測:依通路分類,2022-2035年
- 線上
- 電子商務
- 企業網站
- 離線
- 超級市場/大賣場
- 專賣店
- 其他(個體店、百貨公司等)
第12章 市場估計與預測:依地區分類,2022-2035年
- 北美洲
- 美國
- 加拿大
- 歐洲
- 德國
- 法國
- 英國
- 義大利
- 西班牙
- 亞太地區
- 中國
- 印度
- 日本
- 韓國
- 澳洲
- 拉丁美洲
- 巴西
- 墨西哥
- 阿根廷
- 中東和非洲(MEA)
- 南非
- 沙烏地阿拉伯
- 阿拉伯聯合大公國
第13章:公司簡介
- Atlantis Strength
- Concept2
- Core Health & Fitness
- Dyaco International
- Eleiko
- Hoist Fitness
- Johnson Health Tech
- Keiser Corporation
- Life Fitness
- Rogue Fitness
- SportsArt Fitness
- Steelflex(Joong Chen)
- Technogym
- True Fitness
- Woodway
The Global Gym Equipment Market was valued at USD 11.6 billion in 2025 and is estimated to grow at a CAGR of 5.2% to reach USD 18.9 billion by 2035.
Market growth is fueled by a stronger global focus on health, fitness, and overall well-being, as individuals increasingly incorporate physical activity into their daily routines. Rising awareness about the importance of maintaining an active lifestyle is encouraging both gym memberships and investments in home fitness equipment. This shift is supported by evolving consumer preferences that prioritize convenience, flexibility, and long-term health benefits. In addition, the expansion of the fitness industry is contributing to increased demand for equipment, as new fitness centers and studios continue to emerge to cater to diverse workout preferences. Government-backed initiatives promoting physical activity are also playing a role in boosting participation levels and encouraging healthier lifestyles. Furthermore, technological advancements and the integration of smart fitness solutions are transforming how users engage with equipment, creating a more personalized and connected fitness experience. These factors collectively position the gym equipment market for steady and sustained growth over the forecast period.
| Market Scope | |
|---|---|
| Start Year | 2025 |
| Forecast Year | 2026-2035 |
| Start Value | $11.6 Billion |
| Forecast Value | $18.9 Billion |
| CAGR | 5.2% |
The cardio equipment segment generated USD 3.7 billion in 2025 and is expected to reach USD 6.4 billion by 2035. This segment represents a significant portion of the gym equipment market, driven by its widespread use in improving cardiovascular health, managing weight, and enhancing endurance. Cardio machines offer versatility and accessibility, making them suitable for users across different fitness levels. Their ability to support customized workout routines and deliver measurable fitness outcomes continues to drive their popularity among both individual consumers and commercial fitness facilities.
The offline segment accounted for 57.1% share in 2025, maintaining its leading position despite the growth of digital sales channels. Physical retail outlets remain highly relevant due to their ability to provide hands-on product experiences and personalized customer service. Consumers benefit from in-store demonstrations, expert guidance, and post-purchase support, which help them make informed decisions. Additionally, ongoing public initiatives encouraging physical fitness indirectly contribute to increased demand for equipment sold through offline channels, further reinforcing their market presence.
U.S. Gym Equipment Market accounted for 53.9% share in 2025, driven by increasing health awareness, rising demand for preventive fitness solutions, and strong adoption of active lifestyles. Consumers are increasingly investing in home fitness equipment, supported by evolving workout habits and the integration of digital fitness platforms. The expansion of commercial fitness centers and specialized studios is also contributing to market growth. Moreover, continuous advancements in smart equipment, connected systems, and data-driven training features are encouraging frequent upgrades and sustained demand across the region.
Key players operating in the Global Gym Equipment Market include Atlantis Strength, Concept2, Core Health & Fitness, Dyaco International, Eleiko, Hoist Fitness, Johnson Health Tech, Keiser Corporation, Life Fitness, Rogue Fitness, SportsArt Fitness, Steelflex (Joong Chen), Technogym, True Fitness, and Woodway. Companies in the Gym Equipment Market are strengthening their position through innovation, strategic partnerships, and expansion of product portfolios. They are investing in smart fitness technologies, including connected devices and AI-driven training features, to enhance user experience and engagement. Many players are focusing on developing multifunctional and space-efficient equipment to cater to home fitness trends. Collaborations with fitness centers, trainers, and digital platforms are helping companies expand their market reach. Additionally, brands are enhancing their distribution networks, both online and offline, to improve accessibility. Continuous research and development efforts, along with customization options and premium offerings, are enabling companies to differentiate themselves and maintain a competitive edge in the evolving fitness landscape.
Table of Contents
Chapter 1 Methodology & Scope
- 1.1 Research approach
- 1.2 Quality Commitments
- 1.3 GMI AI policy & data integrity commitment
- 1.3.1 Source consistency protocol
- 1.4 Research Trail & Confidence Scoring
- 1.4.1 Research Trail Components
- 1.4.2 Scoring Components
- 1.5 Data Collection
- 1.5.1 Partial list of primary sources
- 1.6 Data mining sources
- 1.7 Paid sources
- 1.7.1 Sources, by region
- 1.8 Base estimates and calculations
- 1.8.1 Base year calculation for any one approach
- 1.9 Forecast model
- 1.9.1 Quantified market impact analysis
- 1.9.1.1 Mathematical impact of growth parameters on forecast
- 1.9.1 Quantified market impact analysis
- 1.10 Research transparency addendum
- 1.10.1 Source attribution framework
- 1.10.2 Quality assurance metrics
- 1.10.3 Our commitment to trust
Chapter 2 Executive Summary
- 2.1 Industry 360° synopsis
- 2.2 Key market trends
- 2.2.1 Regional
- 2.2.2 Product Type
- 2.2.3 Type
- 2.2.4 Price
- 2.2.5 Category
- 2.2.6 Application
- 2.2.7 End Use
- 2.2.8 Distribution Channel
Chapter 3 Industry Insights
- 3.1 Industry ecosystem analysis
- 3.1.1 Supplier landscape
- 3.1.2 Profit margin
- 3.1.3 Value addition at each stage
- 3.1.4 Factor affecting the value chain
- 3.2 Industry impact forces
- 3.2.1 Growth drivers
- 3.2.1.1 Rising health awareness & preventive wellness focus
- 3.2.1.2 Growth of home fitness & hybrid exercise models
- 3.2.1.3 Technological advancements in smart fitness equipment
- 3.2.2 Industry pitfalls & challenges
- 3.2.2.1 Expansion across emerging markets
- 3.2.2.2 Rapid adoption of smart, connected & compact equipment
- 3.2.3 Opportunities
- 3.2.3.1 High initial cost of equipment
- 3.2.3.2 Concerns around durability, maintenance & product longevity
- 3.2.1 Growth drivers
- 3.3 Growth potential analysis
- 3.4 Future market trends
- 3.5 Technology and innovation landscape
- 3.5.1 Current technological trends
- 3.5.2 Emerging technologies
- 3.6 Regulatory landscape
- 3.6.1 Standards and compliance requirements
- 3.6.2 Regional regulatory frameworks
- 3.6.3 Certification standards
- 3.7 Trade data analysis
- 3.7.1 Import/export volume & value trends
- 3.7.2 Key trade corridors & tariff impact
- 3.8 Impact of AI & generative AI on the market
- 3.8.1 AI-driven disruption of existing business models
- 3.8.2 Gen AI use cases & adoption roadmap by segment
- 3.8.3 Risks, limitations & regulatory considerations
- 3.9 Pricing analysis (driven by primary research)
- 3.9.1 Historical price trend analysis (driven by primary research)
- 3.9.2 Pricing strategy by player type (premium / value / cost-plus) (driven by primary research)
- 3.9.3 Regional price variations
- 3.9.4 Impact of raw material costs on pricing
- 3.10 Porter's analysis
- 3.11 PESTEL analysis
- 3.12 Consumer behaviour analysis
- 3.12.1 Purchasing patterns
- 3.12.2 Preference analysis
- 3.12.3 Regional variations in consumer behaviour
- 3.12.4 Impact of e-commerce on buying decisions
Chapter 4 Competitive Landscape, 2025
- 4.1 Introduction
- 4.2 Company market share analysis
- 4.2.1 By region
- 4.2.1.1 North America
- 4.2.1.2 Europe
- 4.2.1.3 Asia Pacific
- 4.2.1.4 Latin America
- 4.2.1.5 Middle East and Africa
- 4.2.1 By region
- 4.3 Company matrix analysis
- 4.4 Competitive analysis of major market players
- 4.5 Competitive positioning matrix
- 4.6 Key developments
- 4.6.1 Mergers & acquisitions
- 4.6.2 Partnerships & collaborations
- 4.6.3 New product launches
- 4.6.4 Expansion plans
Chapter 5 Market Estimates & Forecast, By Product type, 2022-2035 (USD Billion) (Million Units)
- 5.1 Key trends
- 5.2 Cardio equipment
- 5.2.1 Treadmills
- 5.2.2 Elliptical trainers
- 5.2.3 Stationary bikes
- 5.2.4 Rowing machines
- 5.2.5 Stair climbers
- 5.2.6 Others
- 5.3 Strength training equipment
- 5.3.1 Selectorized weight machines
- 5.3.2 Free weights: dumbbells, barbells, kettlebells
- 5.3.3 Benches & racks
- 5.3.4 Cable & pulley systems
- 5.3.5 Plate loaded equipment
- 5.4 Functional training equipment
- 5.4.1 Suspension trainers
- 5.4.2 Medicine balls & slam balls
- 5.4.3 Battle ropes
- 5.4.4 Plyometric boxes
- 5.4.5 Agility & speed equipment
- 5.5 Flexibility & balance equipment
- 5.5.1 Yoga mats & props
- 5.5.2 Foam rollers
- 5.5.3 Balance boards & stability equipment
- 5.5.4 Resistance bands
- 5.5.5 Pilates equipment
- 5.6 Others
Chapter 6 Market Estimates & Forecast, By Type, 2022-2035 (USD Billion) (Million Units)
- 6.1 Key trends
- 6.2 Indoor equipment
- 6.3 Outdoor equipment
Chapter 7 Market Estimates & Forecast, By Price, 2022-2035 (USD Billion) (Million Units)
- 7.1 Key trends
- 7.2 Low
- 7.3 Medium
- 7.4 High
Chapter 8 Market Estimates & Forecast, By Category, 2022-2035 (USD Billion) (Million Units)
- 8.1 Key trends
- 8.2 Smart equipment
- 8.2.1 IoT-enabled connected devices
- 8.2.2 App-integrated equipment
- 8.2.3 AI-powered personal training systems
- 8.2.4 Virtual reality & gamification-enabled equipment
- 8.3 Conventional equipment
- 8.3.1 Mechanical/analog equipment
- 8.3.2 Basic electronic equipment
Chapter 9 Market Estimates & Forecast, By Application, 2022-2035 (USD Billion) (Million Units)
- 9.1 Key trends
- 9.2 Weight loss
- 9.3 Body building
- 9.4 Physical fitness
- 9.5 Mental fitness
- 9.6 Others
Chapter 10 Market Estimates & Forecast, By End Use, 2022-2035 (USD Billion) (Million Units)
- 10.1 Key trends
- 10.2 Household individuals
- 10.3 Fitness centers
- 10.4 Athlete/professional
Chapter 11 Market Estimates & Forecast, By Distribution Channel, 2022-2035 (USD Billion) (Million Units)
- 11.1 Key trends
- 11.2 Online
- 11.2.1 E-Commerce
- 11.2.2 Company website
- 11.3 Offline
- 11.3.1 Supermarkets/Hypermarkets
- 11.3.2 Specialty Stores
- 11.3.3 Others (Individual stores, Departmental stores, etc.)
Chapter 12 Market Estimates & Forecast, By Region, 2022-2035 (USD Billion) (Million Units)
- 12.1 Key trends
- 12.2 North America
- 12.2.1 U.S.
- 12.2.2 Canada
- 12.3 Europe
- 12.3.1 Germany
- 12.3.2 France
- 12.3.3 UK
- 12.3.4 Italy
- 12.3.5 Spain
- 12.4 Asia Pacific
- 12.4.1 China
- 12.4.2 India
- 12.4.3 Japan
- 12.4.4 South Korea
- 12.4.5 Australia
- 12.5 Latin America
- 12.5.1 Brazil
- 12.5.2 Mexico
- 12.5.3 Argentina
- 12.6 MEA
- 12.6.1 South Africa
- 12.6.2 Saudi Arabia
- 12.6.3 UAE
Chapter 13 Company Profiles
- 13.1 Atlantis Strength
- 13.2 Concept2
- 13.3 Core Health & Fitness
- 13.4 Dyaco International
- 13.5 Eleiko
- 13.6 Hoist Fitness
- 13.7 Johnson Health Tech
- 13.8 Keiser Corporation
- 13.9 Life Fitness
- 13.10 Rogue Fitness
- 13.11 SportsArt Fitness
- 13.12 Steelflex (Joong Chen)
- 13.13 Technogym
- 13.14 True Fitness
- 13.15 Woodway
 家用健身器材市場機會、成長促進因素、產業趨勢分析及預測(2026-2035年)
 全球數位化健身器材市場-按類型、最終用途、分銷管道、地區和競爭格局分類的行業規模、佔有率、趨勢、機會和預測(2021-2031年)智慧家庭健身器材市場-全球產業規模、佔有率、趨勢、機會及預測:依產品類型、通路、地區及競爭格局分類,2021-2031年
 家用健身器材市場規模、佔有率及成長分析(按產品類型、應用、分銷管道和地區分類)-2026-2033年產業預測
 日本健身器材市場規模、佔有率、趨勢及預測(按產品類型、配銷通路、買家類型和地區分類,2026-2034年)
 全球居家健身器材市場
 2026 年至 2032 年家庭健身器材市場(依產品類型、通路和地區)全球智慧家庭健身器材市場
 智慧家庭健身設備市場(產品類型:心血管訓練設備和肌力訓練設備;類型:折疊式和固定式)- 2024-2034 年全球產業分析、規模、佔有率、成長、趨勢和預測
 印度健身器材市場評估:依產品、最終用戶、定價、分銷管道和地區劃分的機會和預測(2018-2032)