


 |
市場調查報告書
商品編碼
1998779
2026 年至 2035 年住宅空調計量表市場的商業機會、成長要素、產業趨勢分析與預測。Residential Cooling Meters Market Opportunity, Growth Drivers, Industry Trend Analysis, and Forecast 2026 - 2035 |
||||||
預計到 2025 年,全球住宅空調計量表市場價值將達到 3.305 億美元,年複合成長率為 6.7%,到 2035 年將達到 6.243 億美元。
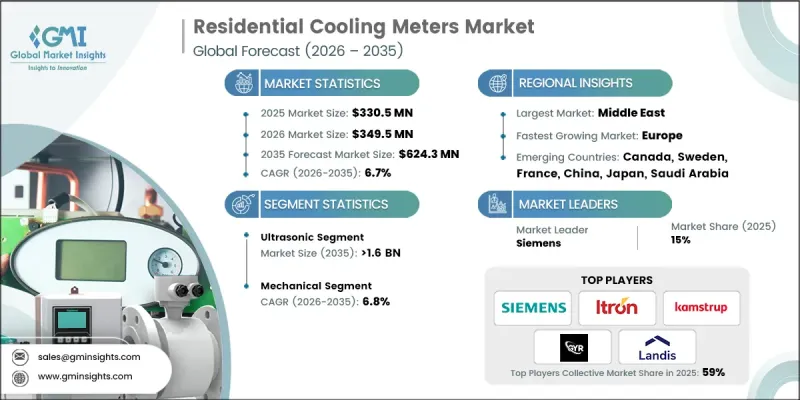
空調計量表是測量住宅空調系統和區域冷氣網路能耗的關鍵設備,確保公平收費和最佳化能源利用。物聯網智慧家庭平台的普及推動了市場擴張,使居住者能夠即時監控和控制空調能耗。中東和亞太等氣候極端地區的日益成長的需求,進一步促進了多用戶住宅獨立空調計量表的安裝。永續永續性計劃、環境法規以及政府對節能解決方案的獎勵,鼓勵業主用智慧或超音波計量表取代傳統的機械式計量表。此外,智慧城市計劃和城市基礎建設的不斷增加,也推動了先進空調計量系統的應用。
| 市場範圍 | |
|---|---|
| 開始年份 | 2025 |
| 預測期 | 2026-2035 |
| 上市時的市場規模 | 3.305億美元 |
| 預測金額 | 6.243億美元 |
| 複合年成長率 | 6.7% |
由於超音波空調電錶能夠極為精確地測量空調能耗,預計到2035年,其市場規模將達到16億美元。各國政府和公共產業正在推廣更精確的計量系統,以改善能源管理,幫助居民最佳化空調使用,並降低整體能耗。遠端抄表等功能無需人工採集數據,為多用戶住宅帶來了顯著優勢。
受監管要求、價格優勢以及中低收入家庭強勁需求的推動,預計到2035年,機械式空調計量市場將以6.8%的複合年成長率成長。其維護成本低,適用於先進技術普及率低的地區,而其成本效益也正在推動市場普及。
預計到2035年,美國住宅空調計量表市場將以5.5%的複合年成長率成長。人們日益關注降低能源成本和提高永續性,這推動了具備遠端抄表和資料登錄功能的電子計量表的普及。與智慧溫控器和智慧家居系統的整合,使居住者能夠透過應用程式和智慧平台控制空調的使用,從而提高能源效率和便利性。在公寓大樓和共享空調網路的住宅小區中,獨立計量表的應用正在不斷擴大,這推動了北美地區對先進空調計量解決方案的需求。
目錄
第1章:調查方法和範圍
第2章執行摘要
第3章業界考察
- 產業生態系統
- 原物料供應及採購分析
- 生產能力評估
- 供應鏈韌性與風險因素
- 配電網路分析
- 監理情勢
- 影響產業的因素
- 促進因素
- 產業潛在風險與挑戰
- 成長潛力分析
- 價格趨勢分析
- 依產品
- 按地區
- 波特五力分析
- PESTEL 分析
- 新機會與趨勢
- 數位化和物聯網整合
- 進入新興市場
- 投資分析及未來展望
第4章 競爭情勢
- 介紹
- 企業市佔率分析
- 北美洲
- 歐洲
- 亞太地區
- 中東
- 戰略儀錶板
- 策略舉措
- 創新與科技趨勢
第5章 市場規模及預測:依產品分類,2022-2035年
- 超音波
- 渦流
- 其他
第6章 市場規模及預測:依技術分類,2022-2035年
- 機械的
- 靜止的
第7章 市場規模及預測:依地區分類,2022-2035年
- 北美洲
- 美國
- 加拿大
- 歐洲
- 德國
- 波蘭
- 瑞典
- 義大利
- 法國
- 芬蘭
- 奧地利
- 亞太地區
- 中國
- 日本
- 韓國
- 新加坡
- 印度
- 中東
- 沙烏地阿拉伯
- 阿拉伯聯合大公國
- 卡達
- 阿曼
- 科威特
第8章:公司簡介
- ABB
- Aclara Technologies
- Axioma Metering
- Apator SA
- Badger Meter
- BMETERS
- Danfoss
- Diehl Stiftung &Co. KG
- Elster Group
- Honeywell International
- Itron
- ista Energy Solutions Limited
- Kamstrup
- Landis+Gyr
- Metrix Polska
- RB Flowmeter
- Sensus
- Schneider Electric
- Secure Meters Ltd.
- Siemens
- Sontex
- ZENNER International GmbH &Co. KG
The Global Residential Cooling Meters Market was valued at USD 330.5 million in 2025 and is estimated to grow at a CAGR of 6.7% to reach USD 624.3 million by 2035.
Cooling meters are essential devices that track the energy consumed by air conditioning systems or district cooling networks in residential units, ensuring fair billing and optimized energy usage. Market expansion is being driven by increasing adoption of IoT-enabled smart home platforms that allow residents to monitor and control cooling consumption in real time. Rising demand in regions with extreme climates, such as the Middle East and Asia Pacific, is further encouraging the installation of individual cooling meters in multi-unit residential buildings. Sustainability initiatives, environmental regulations, and government incentives for energy-efficient solutions are prompting property owners to replace traditional mechanical meters with smart and ultrasonic alternatives. Additionally, the growing number of smart city projects and urban infrastructure developments is supporting widespread adoption of advanced cooling metering systems.
| Market Scope | |
|---|---|
| Start Year | 2025 |
| Forecast Year | 2026-2035 |
| Start Value | $330.5 Million |
| Forecast Value | $624.3 Million |
| CAGR | 6.7% |
The ultrasonic cooling meters segment is expected to reach USD 1.6 billion by 2035, owing to their ability to deliver highly accurate readings of cooling energy consumption. Governments and utilities are promoting more precise metering systems to improve energy management, enabling residents to optimize cooling usage and lower overall consumption. Features such as remote reading eliminate manual data collection, providing significant benefits in multi-residential buildings.
The mechanical cooling meters segment is expected to grow at a CAGR of 6.8% by 2035, driven by regulatory requirements, affordability, and strong demand from low- to mid-income households. Their low maintenance requirements make them suitable for regions with limited access to advanced technologies, while their cost-effectiveness supports broader market adoption.
U.S. Residential Cooling Meters Market is anticipated to grow at a CAGR of 5.5% by 2035. Increasing focus on reducing energy costs and improving sustainability is driving the adoption of electronic meters equipped with remote reading and data logging capabilities. Integration with smart thermostats and home automation systems allows residents to control cooling usage through apps or smart platforms, enhancing energy efficiency and user convenience. Condominiums and housing complexes with shared cooling networks are increasingly adopting individual meters, reinforcing the demand for advanced cooling measurement solutions across North America.
Key players in the Global Residential Cooling Meters Market include ABB, Aclara Technologies, Axioma Metering, Apator SA, Badger Meter, BMETERS, Danfoss, Diehl Stiftung & Co. KG, Elster Group, Honeywell International, Itron, ista Energy Solutions Limited, Kamstrup, Landis+Gyr, Metrix Polska, RB Flowmeter, Sensus, Schneider Electric, Secure Meters Ltd., Siemens, Sontex, and ZENNER International GmbH & Co. KG. Companies in the Global Residential Cooling Meters Market are adopting multiple strategies to expand their market presence and strengthen their position. Many are investing in the development of smart and ultrasonic meters with IoT capabilities for real-time monitoring and remote management. Strategic partnerships with residential developers, utilities, and smart city projects are enabling wider distribution and faster adoption. Product differentiation through features such as energy analytics, automated reporting, and mobile app integration is helping firms attract tech-savvy consumers. Several companies are also focusing on regulatory compliance and energy efficiency certifications to gain trust among property owners and government entities.
Table of Contents
Chapter 1 Methodology & Scope
- 1.1 Research design
- 1.1.1 Research approach
- 1.1.2 Data collection methods
- 1.2 Base estimates and calculations
- 1.2.1 Base year calculation
- 1.2.2 Key trends for market estimates
- 1.3 Forecast model
- 1.3.1 Key trends for market estimates
- 1.3.1.1 Quantified market impact analysis
- 1.3.1.2 Mathematical impact of growth parameters on forecast
- 1.3.2 Scenario analysis framework
- 1.3.1 Key trends for market estimates
- 1.4 Primary research and validation
- 1.4.1 Some of the primary sources (but not limited to)
- 1.5 Data mining sources
- 1.5.1 Paid Sources
- 1.5.2 Sources, by region
- 1.6 Research trail & scoring components
- 1.6.1 Research trail components
- 1.6.2 Scoring components
- 1.7 Research transparency addendum
- 1.7.1 Source attribution framework
- 1.7.2 Quality assurance metrics
- 1.7.3 Our commitment to trust
- 1.8 Market definitions
Chapter 2 Executive Summary
- 2.1 Industry 360-degree synopsis, 2022 - 2035
- 2.2 Business trends
- 2.3 Product trends
- 2.4 Technology trends
- 2.5 Regional trends
Chapter 3 Industry Insights
- 3.1 Industry ecosystem
- 3.1.1 Raw material availability & sourcing analysis
- 3.1.2 Manufacturing capacity assessment
- 3.1.3 Supply chain resilience & risk factors
- 3.1.4 Distribution network analysis
- 3.2 Regulatory landscape
- 3.3 Industry impact forces
- 3.3.1 Growth drivers
- 3.3.2 Industry pitfalls & challenges
- 3.4 Growth potential analysis
- 3.5 Price trend analysis
- 3.5.1 By product
- 3.5.2 By region
- 3.6 Porter's analysis
- 3.6.1 Bargaining power of suppliers
- 3.6.2 Bargaining power of buyers
- 3.6.3 Threat of new entrants
- 3.6.4 Threat of substitutes
- 3.7 PESTEL analysis
- 3.7.1 Political factors
- 3.7.2 Economic factors
- 3.7.3 Social factors
- 3.7.4 Technological factors
- 3.7.5 Legal factors
- 3.7.6 Environmental factors
- 3.8 Emerging opportunities & trends
- 3.8.1 Digitalization & IoT integration
- 3.8.2 Emerging market penetration
- 3.9 Investment analysis and future outlook
Chapter 4 Competitive landscape, 2026
- 4.1 Introduction
- 4.2 Company market share analysis, 2025
- 4.2.1 North America
- 4.2.2 Europe
- 4.2.3 Asia Pacific
- 4.2.4 Middle East
- 4.3 Strategic dashboard
- 4.4 Strategic initiatives
- 4.5 Innovation & technology landscape
Chapter 5 Market Size and Forecast, By Product, 2022 - 2035 (USD Million & ‘000 Units)
- 5.1 Key trends
- 5.2 Ultrasonic
- 5.3 Vortex
- 5.4 Others
Chapter 6 Market Size and Forecast, By Technology, 2022 - 2035 (USD Million & ‘000 Units)
- 6.1 Key trends
- 6.2 Mechanical
- 6.3 Static
Chapter 7 Market Size and Forecast, By Region, 2022 - 2035 (USD Million & ‘000 Units)
- 7.1 Key trends
- 7.2 North America
- 7.2.1 U.S.
- 7.2.2 Canada
- 7.3 Europe
- 7.3.1 Germany
- 7.3.2 Poland
- 7.3.3 Sweden
- 7.3.4 Italy
- 7.3.5 France
- 7.3.6 Finland
- 7.3.7 Austria
- 7.4 Asia Pacific
- 7.4.1 China
- 7.4.2 Japan
- 7.4.3 South Korea
- 7.4.4 Singapore
- 7.4.5 India
- 7.5 Middle East
- 7.5.1 Saudi Arabia
- 7.5.2 UAE
- 7.5.3 Qatar
- 7.5.4 Oman
- 7.5.5 Kuwait
Chapter 8 Company Profiles
- 8.1 ABB
- 8.2 Aclara Technologies
- 8.3 Axioma Metering
- 8.4 Apator SA
- 8.5 Badger Meter
- 8.6 BMETERS
- 8.7 Danfoss
- 8.8 Diehl Stiftung & Co. KG
- 8.9 Elster Group
- 8.10 Honeywell International
- 8.11 Itron
- 8.12 ista Energy Solutions Limited
- 8.13 Kamstrup
- 8.14 Landis+Gyr
- 8.15 Metrix Polska
- 8.16 RB Flowmeter
- 8.17 Sensus
- 8.18 Schneider Electric
- 8.19 Secure Meters Ltd.
- 8.20 Siemens
- 8.21 Sontex
- 8.22 ZENNER International GmbH & Co. KG


