

 |
市場調查報告書
商品編碼
1982279
可變利率技術設備市場:成長機會、成長要素、產業趨勢分析及2026-2035年預測Variable Rate Technology (VRT) Equipment Market Opportunity, Growth Drivers, Industry Trend Analysis, and Forecast 2026 - 2035 |
||||||
全球可變利率技術(VRT)設備市場預計到 2025 年價值 119 億美元,預計到 2035 年將以 6% 的複合年成長率成長至 209 億美元。
市場成長與人們逐漸意識到農地並非千篇一律,需要個人化的投入管理密切相關。農民正穩步從固定施肥量轉向更具適應性的系統,以即時回應農田的變化。變數施肥技術(VRT)設備使操作人員能夠根據土壤條件、作物需求和生產力區域微調投入。這種數據驅動的方法提高了作業精度和資源效率,同時支援更永續的農場管理。隨著生產者對生產決策的透明度和控制力提出更高的要求,VRT解決方案正成為現代精密農業策略的關鍵組成部分。這個市場反映了農業系統向智慧化轉型的趨勢,智慧化農業系統旨在平衡生產力、成本最佳化和環境保護,而VRT設備正成為全球先進農業營運發展中的關鍵組成部分。
| 市場範圍 | |
|---|---|
| 開始年份 | 2025 |
| 預測期 | 2026-2035 |
| 上市時的市場規模 | 119億美元 |
| 預測金額 | 209億美元 |
| 複合年成長率 | 6% |
從商業性角度來看,實用性、可靠性和無縫整合是變數施肥技術設備市場的關鍵考量。製造商致力於開發與現有農業機械相容的系統,使農民能夠在不中斷日常作業的情況下進行升級。使用者友善的介面、直覺的操作和穩定的性能仍然是購買決策的核心要素。銷售合作夥伴和服務供應商透過技術指導、培訓和售後服務做出重要貢獻。這種協作生態系統促進了設備供應商和農業經營者之間的長期合作關係,將簡單的交易轉變為基於營運信任和可衡量結果的永續夥伴關係。
預計2025年,變數施肥設備市場規模將達到47億美元,佔據變數施肥技術設備市場的最大佔有率。變數施肥(VRA)系統憑藉其帶來的立竿見影的經濟效益,正在推動市場成長。 VRA設備能夠根據田間數據和數位化建議,逐塊地最佳化關鍵農業投入品的施用,從而減少過度使用,同時保持或提高產量。由於投入成本在農業總支出中佔比巨大,因此能夠直接最佳化這些成本的技術具有很高的投資回報率,並正在推動精密農業平台的廣泛應用。
預計到2025年,基於處方圖的施藥方案將佔據44%的市場。處方箋圖系統之所以被廣泛採用,是因為它們能夠提供穩定、精準的農藥施用和可預測的施藥效果。這些技術依賴於預先創建的數位田間地圖,這些地圖是透過農藥數據分析產生的,用於確定不同管理區域的最佳施藥量。透過在田間作業前應用數據驅動策略,農民可以更好地控制投入分配和作物產量,從而凸顯精密農業框架下系統化規劃的價值。
預計到2025年,美國可變速率耕作技術(VRT)設備市場將佔據80%的佔有率,並創造約39億美元的收入。由於精密農業技術的早期應用以及大規模商業農業企業的存在,該地區已成為VRT設備最成熟的市場。 GPS定位機械的高普及率、先進的農場管理平台以及強大的OEM生態系統,使得VRT系統能夠無縫整合。這種成熟的基礎設施正在加速VRT技術的普及,並鞏固該地區在全球市場的主導地位。
目錄
第1章:調查方法和範圍
第2章執行摘要
第3章業界考察
- 生態系分析
- 供應商情況
- 利潤率
- 每個階段增加的價值
- 影響價值鏈的因素
- 影響產業的因素
- 促進因素
- 精密農業實踐的迅速普及
- 日益成長的最佳化投入成本和提高資源效率的需求。
- 政府對數位農業的支持政策和獎勵
- 產業潛在風險與挑戰
- 高昂的初始投資和整合成本
- 技術複雜性和最終用戶技能差距
- 機會
- 新興經濟體和大型農業經濟體的擴張
- 與人工智慧、物聯網和先進的農場管理平台整合
- 促進因素
- 成長潛力分析
- 關鍵市場趨勢與顛覆性因素
- 未來市場趨勢
- 風險及風險緩解分析
- 科技與創新趨勢
- 當前技術趨勢
- 新興技術
- 價格趨勢
- 按地區
- 透過裝置
- 監理情勢
- 標準和合規要求
- 認證標準
- 波特五力分析
- PESTEL 分析
第4章 競爭情勢
- 介紹
- 企業市佔率分析
- 按地區
- 企業矩陣分析
- 主要市場公司的競爭分析
- 競爭定位矩陣
- 主要進展
- 併購
- 夥伴關係與合作
- 新產品發布
- 業務拓展計劃
第5章 市場估算與預測:依設備類型分類,2022-2035年
- GPS/GNSS導引與定位系統
- 變速控制器和主機
- 感測器和監控系統
- 可變容量噴霧器
- 軟體和決策支援系統
第6章 市場估計與預測:依技術分類,2022-2035年
- 基於處方箋圖的VRT
- 基於感測器的即時VRT
- 整合系統
第7章 市場估計與預測:依系統配置分類,2022-2035年
- 小規模家庭農場(不到600英畝)
- 中型家庭農場(600-1700英畝)
- 大型家庭農場(超過1700英畝)
第8章 市場估算與預測:依最終用途分類,2022-2035年
- 田間作物(廣域農業)
- 特種作物(高價值多年生作物)
- 飼料和牧場
- 精準畜牧業
第9章 市場估計與預測:依應用領域分類,2022-2035年
- 變數施肥(VRNT)
- 可變播種/種植
- 採用可變施用量施用殺蟲劑及除草劑
- 可變灌溉(VRI)
第10章 市場估價與預測:依通路分類,2022-2035年
- 直銷
- 間接銷售
第11章 市場估價與預測:按地區分類,2022-2035年
- 北美洲
- 美國
- 加拿大
- 歐洲
- 德國
- 英國
- 法國
- 義大利
- 西班牙
- 亞太地區
- 中國
- 日本
- 印度
- 韓國
- 澳洲
- 馬來西亞
- 印尼
- 拉丁美洲
- 巴西
- 墨西哥
- 中東和非洲
- 南非
- 沙烏地阿拉伯
- 阿拉伯聯合大公國
第12章:公司簡介
- John Deere(Deere &Company)
- Trimble Inc.
- CNH Industrial
- AGCO Corporation
- Hexagon Agriculture
- Topcon Positioning Systems
- AMAZONE
- Kverneland Group
- Rauch
- Claas
- Lindsay Corporation
- Precision Planting
- Muller-Elektronik
- Yara International
- Raven Industries
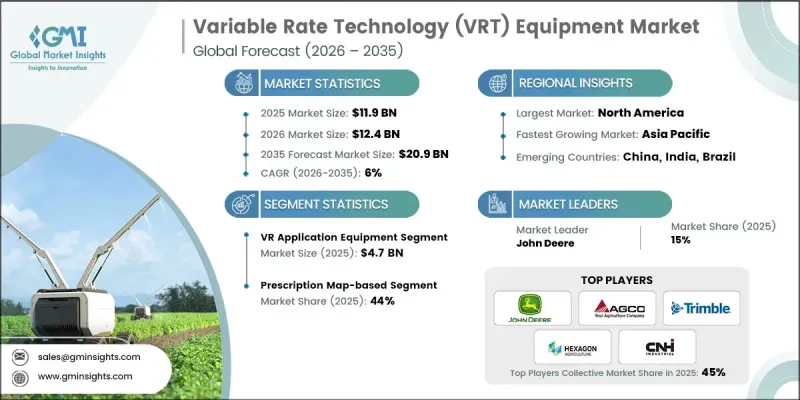
The Global Variable Rate Technology (VRT) Equipment Market was valued at USD 11.9 billion in 2025 and is estimated to grow at a CAGR of 6% to reach USD 20.9 billion by 2035.
Market growth is tied to the understanding that agricultural fields are not uniform and require tailored input management. Farmers are steadily transitioning from fixed-rate application practices to more adaptive systems that respond to real-time field variability. Variable rate technology (VRT) equipment enables operators to fine-tune input levels according to soil conditions, crop requirements, and productivity zones. This data-driven approach improves operational precision and enhances resource efficiency while supporting more sustainable farm management. As growers seek greater visibility and control over production decisions, VRT solutions are becoming integral to modern precision agriculture strategies. The market reflects a broader shift toward intelligent farming systems that balance productivity, cost optimization, and environmental stewardship, positioning VRT equipment as a critical component in the evolution of advanced agricultural operations worldwide.
| Market Scope | |
|---|---|
| Start Year | 2025 |
| Forecast Year | 2026-2035 |
| Start Value | $11.9 Billion |
| Forecast Value | $20.9 Billion |
| CAGR | 6% |
From a commercial perspective, the variable rate technology equipment market emphasizes practicality, reliability, and seamless integration. Manufacturers focus on developing systems that are compatible with existing agricultural machinery, allowing farmers to implement upgrades without disrupting routine fieldwork. User-friendly interfaces, intuitive controls, and consistent performance remain central to purchasing decisions. Distribution partners and service providers contribute significantly by delivering technical guidance, training, and post-sale support. This collaborative ecosystem fosters long-term engagement between equipment suppliers and farming operations, transforming transactions into sustained partnerships built on operational trust and measurable results.
In 2025, the variable rate application equipment segment generated USD 4.7 billion, representing the largest share of the variable rate technology equipment market. Variable Rate Application (VRA) systems lead the market because they provide immediate and quantifiable financial advantages. By enabling site-specific application of critical agricultural inputs based on field data and digital recommendations, VRA equipment helps reduce excess usage while protecting or enhancing yield performance. Since input costs represent a substantial portion of overall farm expenditure, technologies that directly optimize these expenses deliver a strong return on investment and drive widespread adoption across precision agriculture platforms.
The prescription map-based segment accounted for 44% share in 2025. Prescription-based systems are widely adopted because they deliver consistent agronomic precision and predictable results. These technologies rely on pre-developed digital field maps generated through agronomic data analysis to determine optimal application rates across different management zones. By applying data-informed strategies in advance of field operations, farmers gain greater control over input distribution and crop performance, reinforcing the value of structured planning within precision farming frameworks.
United States Variable Rate Technology (VRT) Equipment Market held 80% share in 2025, generating around USD 3.9 billion in revenue. The region represents the most established market for VRT equipment, supported by early adoption of precision agriculture practices and the presence of large-scale commercial farming enterprises. High utilization of GPS-enabled machinery, advanced farm management platforms, and strong original equipment manufacturer ecosystems enables seamless integration of VRT systems. This mature infrastructure accelerates deployment and strengthens the region's leadership position in the global market.
Key companies operating in the Global Variable Rate Technology (VRT) Equipment Market include John Deere (Deere & Company), Trimble Inc., AGCO Corporation, CNH Industrial, Hexagon Agriculture, Topcon Positioning Systems, Claas, Kverneland Group, AMAZONE, Rauch, Lindsay Corporation, Precision Planting, Muller Elektronik, Yara International, and Raven Industries. Companies in the Global Variable Rate Technology (VRT) Equipment Market are enhancing their competitive standing through continuous innovation, strategic alliances, and digital ecosystem expansion. Leading players invest heavily in research and development to improve software analytics, automation capabilities, and machine compatibility. Many manufacturers form partnerships with agronomy service providers and technology firms to deliver integrated precision farming solutions. Expanding product portfolios, strengthening dealer networks, and offering data-driven advisory services are also central strategies.
Table of Contents
Chapter 1 Methodology and Scope
- 1.1 Market scope and definition
- 1.2 Research design
- 1.2.1 Research approach
- 1.2.2 Data collection methods
- 1.3 Data mining sources
- 1.3.1 Global
- 1.3.2 Regional/Country
- 1.4 Base estimates and calculations
- 1.4.1 Base year calculation
- 1.4.2 Key trends for market estimation
- 1.5 Primary research and validation
- 1.5.1 Primary sources
- 1.6 Forecast model
- 1.7 Research assumptions and limitations
Chapter 2 Executive Summary
- 2.1 Industry 360° synopsis
- 2.2 Key market trends
- 2.2.1 regional
- 2.2.2 equipment type
- 2.2.3 farm size
- 2.2.4 end use
- 2.2.5 application
- 2.2.6 distribution channel
Chapter 3 Industry Insights
- 3.1 Industry ecosystem analysis
- 3.1.1 Supplier landscape
- 3.1.2 Profit margin
- 3.1.3 Value addition at each stage
- 3.1.4 Factor affecting the value chain
- 3.2 Industry impact forces
- 3.2.1 Growth drivers
- 3.2.1.1 Accelerated adoption of precision agriculture practices
- 3.2.1.2 Rising need for input cost optimization and resource efficiency
- 3.2.1.3 Supportive government policies and digital farming incentives
- 3.2.2 Industry pitfalls & challenges
- 3.2.2.1 High initial investment and integration costs
- 3.2.2.2 Technical complexity and skill gaps among end users
- 3.2.3 Opportunities
- 3.2.3.1 Expansion in emerging and large-scale agricultural economies
- 3.2.3.2 Integration with ai, iot, and advanced farm management platforms
- 3.2.1 Growth drivers
- 3.3 Growth potential analysis
- 3.4 Major market trends and Disruptions
- 3.5 Future market trends
- 3.6 Risk and mitigation Analysis
- 3.7 Technology and innovation landscape
- 3.7.1 Current technological trends
- 3.7.2 Emerging technologies
- 3.8 Price trends
- 3.8.1 By region
- 3.8.2 by equipment type
- 3.9 Regulatory landscape
- 3.9.1 Standards and compliance requirement
- 3.9.2 Certification standards
- 3.10 Porter's analysis
- 3.11 PESTEL analysis
Chapter 4 Competitive Landscape, 2025
- 4.1 Introduction
- 4.2 Company market share analysis
- 4.2.1 By region
- 4.2.1.1 North America
- 4.2.1.2 Europe
- 4.2.1.3 Asia Pacific
- 4.2.1.4 Latin America
- 4.2.1.5 Middle East and Africa
- 4.2.1 By region
- 4.3 Company matrix analysis
- 4.4 Competitive analysis of major market players
- 4.5 Competitive positioning matrix
- 4.6 Key developments
- 4.6.1 Mergers & acquisitions
- 4.6.2 Partnerships & collaborations
- 4.6.3 New product launches
- 4.6.4 Expansion plans
Chapter 5 Market Estimates & Forecast, By Equipment Type, 2022-2035 (USD Billion) (Tons)
- 5.1 Key trends
- 5.1.1 GPS/GNSS guidance and positioning systems
- 5.1.2 Variable rate controllers and consoles
- 5.1.3 Sensors and monitoring systems
- 5.1.4 Variable rate application equipment
- 5.1.5 Software and decision support systems
Chapter 6 Market Estimates & Forecast, By Technology Type, 2022-2035 (USD Billion) (Tons)
- 6.1 Key trends
- 6.2 Prescription map-based VRT
- 6.3 Real-time sensor-based VRT
- 6.4 Integrated systems
Chapter 7 Market Estimates & Forecast, By System Configuration, 2022-2035 (USD Billion) (Tons)
- 7.1 Key trends
- 7.2 Small family farms (<600 acres)
- 7.3 Midsize family farms (600-1,700 acres)
- 7.4 Large-scale family farms (>1,700 acres)
Chapter 8 Market Estimates & Forecast, By End Use, 2022-2035 (USD Billion) (Tons)
- 8.1 Key trends
- 8.2 Row crops (broadacre agriculture)
- 8.3 Specialty crops (high-value perennials)
- 8.4 Forage and pasture
- 8.5 Precision livestock farming
Chapter 9 Market Estimates & Forecast, By Application, 2022-2035 (USD Billion) (Tons)
- 9.1 Key trends
- 9.2 Variable rate nutrient / fertilizer application (VRNT)
- 9.3 Variable rate seeding / planting
- 9.4 Variable rate pesticide / herbicide application
- 9.5 Variable rate irrigation (VRI)
Chapter 10 Market Estimates & Forecast, By Distribution Channel, 2022-2035 (USD Billion) (Tons)
- 10.1 Key trends
- 10.2 Direct sales
- 10.3 Indirect sales
Chapter 11 Market Estimates and Forecast, By Region, 2022 - 2035 (USD Billion) (Tons)
- 11.1 Key trends
- 11.2 North America
- 11.2.1 U.S.
- 11.2.2 Canada
- 11.3 Europe
- 11.3.1 Germany
- 11.3.2 UK
- 11.3.3 France
- 11.3.4 Italy
- 11.3.5 Spain
- 11.4 Asia Pacific
- 11.4.1 China
- 11.4.2 Japan
- 11.4.3 India
- 11.4.4 South Korea
- 11.4.5 Australia
- 11.4.6 Malaysia
- 11.4.7 Indonesia
- 11.5 Latin America
- 11.5.1 Brazil
- 11.5.2 Mexico
- 11.6 Middle East and Africa
- 11.6.1 South Africa
- 11.6.2 Saudi Arabia
- 11.6.3 UAE
Chapter 12 Company Profiles
- 12.1 John Deere (Deere & Company)
- 12.2 Trimble Inc.
- 12.3 CNH Industrial
- 12.4 AGCO Corporation
- 12.5 Hexagon Agriculture
- 12.6 Topcon Positioning Systems
- 12.7 AMAZONE
- 12.8 Kverneland Group
- 12.9 Rauch
- 12.10 Claas
- 12.11 Lindsay Corporation
- 12.12 Precision Planting
- 12.13 Muller-Elektronik
- 12.14 Yara International
- 12.15 Raven Industries
 農業變數噴灑技術市場規模、佔有率和成長分析:按產品、安裝方式、應用、農場規模、作物類型和地區分類-2026年至2033年產業預測
 可變費率技術市場:按產品、技術類型、應用和農場規模分類-2026-2032年全球預測
 全球可變輸入技術市場規模、佔有率、趨勢和成長分析報告(2026-2034)
 2032年變數施肥技術(VRT)市場預測:按類型、作物類型、農場規模、技術、最終用戶和地區分類的全球分析2032年變數技術(VRT)噴霧器市場預測:按產品、實施方法、平台、農場規模、作物、應用和地區分類的全球分析
 變數施肥技術:市場佔有率分析、產業趨勢、統計和成長預測(2025-2030 年)