


 |
市場調查報告書
商品編碼
1936650
虛擬電廠市場機會、成長要素、產業趨勢分析及預測(2026年至2035年)Virtual Power Plant Market Opportunity, Growth Drivers, Industry Trend Analysis, and Forecast 2026 - 2035 |
||||||
全球虛擬電廠 (VPP) 市場預計到 2025 年將達到 55 億美元,到 2035 年將達到 395 億美元,年複合成長率為 21.9%。
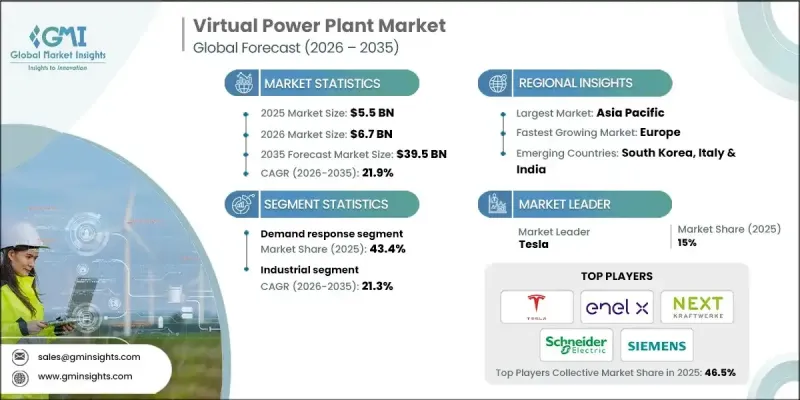
虛擬電廠(VPP)透過將太陽能板、風力發電機、電池儲能和需量反應機制等分散式能源整合到一個智慧管理的單一網路中,推動著現代能源系統的演進。透過聚合發電、儲能和用電,VPP 最佳化了能源分配,提高了電網可靠性,並增加了可再生能源發電的滲透率,同時減少了碳排放。先進能源儲存系統(尤其是鋰離子電池)的快速普及,使電力公司能夠在用電低谷期儲存多餘的能源,並在需要時釋放,從而保障電網的穩定性和效率。機器學習、先進通訊技術和即時分析的整合,進一步提升了運作性能、預測性維護和成本最佳化。隨著公共產業和消費者尋求靈活、彈性和永續的能源解決方案,VPP 的重要性日益凸顯。
| 市場覆蓋範圍 | |
|---|---|
| 開始年份 | 2025 |
| 預測年份 | 2026-2035 |
| 起始值 | 55億美元 |
| 預測金額 | 395億美元 |
| 複合年成長率 | 21.9% |
預計到2035年,混合資產板塊將以22.1%的複合年成長率成長,這主要得益於包括太陽能板、風力發電機、電池儲能系統和可控負載在內的多種分散式能源的整合。透過聚合這些多樣化的資源,虛擬電廠(VPP)能夠平衡間歇性能源產出與波動性需求,從而提高電網可靠性並即時最佳化能源調度。這種多資源模式使公共產業和營運商能夠更有效地管理尖峰負載,減少對傳統發電的依賴,並支持大規模可再生能源的採用,同時保持電網穩定。
預計2026年至2035年間,住宅市場將以22.5%的複合年成長率成長,主要受屋頂太陽能光電系統、家用儲能電池和電動車充電器普及率不斷提高的推動。住宅積極參與虛擬電廠(VPP)項目,以最佳化能源使用、降低電費,並透過出售剩餘電力獲得額外收入。意識提升的永續性、清潔能源推廣獎勵的訂定以及智慧家居的日益普及,都在加速住宅分散式能源併入虛擬電廠網路。
美國虛擬電廠市場佔據87.9%的市場佔有率,預計2035年將成長至115億美元。市場擴張的驅動力主要來自電網可靠性面臨的挑戰,例如基礎設施老化、極端天氣事件頻繁以及電力需求不斷成長。虛擬電廠利用分散式資源提供柔軟性,這對於在尖峰負載期間穩定電網至關重要。政府的支持,包括對可再生能源和儲能的聯邦補貼和稅收優惠,進一步推動了虛擬電廠解決方案的採用和廣泛應用。
目錄
第1章調查方法和範圍
第2章執行摘要
第3章業界考察
- 產業生態系統
- 原物料供應及採購分析
- 製造能力評估
- 供應鏈韌性與風險因素
- 配電網路分析
- 監管環境
- 產業影響因素
- 促進要素
- 產業潛在風險與挑戰
- 成長潛力分析
- 成本結構分析
- 波特五力分析
- PESTEL 分析
- 新的機會與趨勢
- 數位化和物聯網整合
- 拓展新興市場
- 投資分析及未來展望
第4章 競爭情勢
- 介紹
- 按地區分類的公司市佔率分析
- 北美洲
- 歐洲
- 亞太地區
- 世界其他地區
- 戰略儀錶板
- 策略舉措
- 企業標竿管理
- 創新與科技趨勢
第5章 依技術分類的市場規模及預測(2022-2035年)
- 分散式能源
- 需量反應
- 複雜資產
第6章 依最終用途分類的市場規模及預測(2022-2035年)
- 住宅
- 工業的
- 商業的
第7章 2022-2035年各地區市場規模及預測
- 北美洲
- 美國
- 加拿大
- 歐洲
- 德國
- 法國
- 英國
- 義大利
- 亞太地區
- 中國
- 日本
- 韓國
- 印度
- 世界其他地區
第8章 公司簡介
- AGL Energy
- Bosch Global
- Enbala Power Networks
- Enel X
- EnergyHub
- ENGIE
- Flexitricity
- Hitachi
- Lumenaza
- Next Kraftwerke
- Schneider Electric
- Shell
- Siemens
- Statkraft
- Sunrun
- Sunnova Energy International
- Tesla
- Tiko Energy Solutions
- Toshiba Corporation
- Virtual Peaker
The Global Virtual Power Plant Market was valued at USD 5.5 billion in 2025 and is estimated to grow at a CAGR of 21.9% to reach USD 39.5 billion by 2035.
Virtual power plants (VPPs) are driving the evolution of modern energy systems by combining decentralized energy resources such as solar panels, wind turbines, batteries, and demand-response mechanisms into a single, intelligently managed network. By aggregating generation, storage, and consumption, VPPs optimize energy dispatch, improve grid reliability, and enable higher penetration of renewable energy while reducing carbon emissions. The rapid adoption of advanced energy storage systems, particularly lithium-ion batteries, allows operators to store excess power during low-demand periods and release it when needed, supporting grid stability and efficiency. Integration of machine learning, advanced communication technologies, and real-time analytics further enhances operational performance, predictive maintenance, and cost optimization. VPPs are increasingly essential as utilities and consumers seek flexible, resilient, and sustainable energy solutions.
| Market Scope | |
|---|---|
| Start Year | 2025 |
| Forecast Year | 2026-2035 |
| Start Value | $5.5 Billion |
| Forecast Value | $39.5 Billion |
| CAGR | 21.9% |
The mixed assets segment is projected to grow at a CAGR of 22.1% through 2035, driven by the integration of varied distributed energy resources such as solar panels, wind turbines, battery storage systems, and controllable loads. By aggregating these diverse resources, virtual power plants can balance intermittent energy generation with fluctuating demand, enhance grid reliability, and optimize energy dispatch in real time. This multi-resource approach also enables utilities and operators to manage peak loads more effectively, reduce reliance on conventional power generation, and support large-scale renewable adoption while maintaining grid stability.
The residential segment is expected to grow at a CAGR of 22.5% through 2026-2035, propelled by increasing adoption of rooftop solar installations, home battery storage, and electric vehicle chargers. Homeowners are actively participating in VPP programs to optimize energy usage, cut electricity expenses, and generate additional revenue by selling excess power to the grid. The combination of rising consumer awareness of sustainability, incentives for clean energy adoption, and smart home integration is accelerating the integration of residential distributed energy resources into VPP networks.
U.S. Virtual Power Plant Market held 87.9% share and is expected to generate USD 11.5 billion by 2035. Market expansion is driven by challenges related to grid reliability caused by aging infrastructure, extreme weather events, and rising electricity demand. VPPs provide critical flexibility by leveraging distributed resources to stabilize the grid during peak loads. Supportive government measures, including federal grants and tax incentives for renewable energy and energy storage, are further encouraging deployment and adoption of virtual power plant solutions.
Key players in the Global Virtual Power Plant Market include AGL Energy, Bosch Global, Enbala Power Networks, Enel X, EnergyHub, ENGIE, Flexitricity, Hitachi, Lumenaza, Next Kraftwerke, Schneider Electric, Shell, Siemens, Statkraft, Sunrun, Sunnova Energy International, Tesla, Tiko Energy Solutions, Toshiba Corporation, and Virtual Peaker. Companies in the virtual power plant market are focusing on expanding their footprint by developing integrated software platforms for energy management, forming strategic partnerships with utilities and energy providers, and investing in advanced analytics and predictive maintenance solutions. They are diversifying product portfolios to include both residential and commercial applications, enhancing scalability, and improving interoperability across distributed energy resources. Key strategies also include acquiring startups or smaller technology providers to gain innovative solutions, collaborating with regulators to ensure compliance, and offering flexible financing models to accelerate customer adoption of VPP solutions.
Table of Contents
Chapter 1 Methodology & Scope
- 1.1 Research design
- 1.2 Quality commitment
- 1.2.1 GMI AI policy & data integrity commitment
- 1.2.1.1 Source consistency protocol
- 1.2.1 GMI AI policy & data integrity commitment
- 1.3 Research Trail & Confidence Scoring
- 1.3.1 Research Trail Components
- 1.3.2 Scoring Components
- 1.4 Data Collection
- 1.4.1 Partial list of primary sources
- 1.5 Data mining sources
- 1.5.1 Paid sources
- 1.5.1.1 Sources, by region
- 1.5.1 Paid sources
- 1.6 Base estimates and calculations
- 1.6.1 Base year calculation for any one approach
- 1.7 Forecast model
- 1.8 Research transparency addendum
- 1.8.1 Source attribution framework
- 1.8.2 Quality assurance metrics
- 1.8.3 Our commitment to trust
- 1.9 Market definitions
Chapter 2 Executive Summary
- 2.1 Industry synopsis, 2022 - 2035
- 2.2 Business trends
- 2.3 Technology trends
- 2.4 End use trends
- 2.5 Regional trends
Chapter 3 Industry Insights
- 3.1 Industry ecosystem
- 3.1.1 Raw material availability & sourcing analysis
- 3.1.2 Manufacturing capacity assessment
- 3.1.3 Supply chain resilience & risk factors
- 3.1.4 Distribution network analysis
- 3.2 Regulatory landscape
- 3.3 Industry impact forces
- 3.3.1 Growth drivers
- 3.3.2 Industry pitfalls & challenges
- 3.4 Growth potential analysis
- 3.5 Cost structure analysis
- 3.6 Porter's analysis
- 3.6.1 Bargaining power of suppliers
- 3.6.2 Bargaining power of buyers
- 3.6.3 Threat of new entrants
- 3.6.4 Threat of substitutes
- 3.7 PESTEL analysis
- 3.7.1 Political factors
- 3.7.2 Economic factors
- 3.7.3 Social factors
- 3.7.4 Technological factors
- 3.7.5 Legal factors
- 3.7.6 Environmental factors
- 3.8 Emerging opportunities & trends
- 3.8.1 Digitalization & IoT integration
- 3.8.2 Emerging market penetration
- 3.9 Investment analysis and future outlook
Chapter 4 Competitive landscape, 2025
- 4.1 Introduction
- 4.2 Company market share analysis, by region, 2025
- 4.2.1 North America
- 4.2.2 Europe
- 4.2.3 Asia Pacific
- 4.2.4 Rest of world
- 4.3 Strategic dashboard
- 4.4 Strategic initiatives
- 4.5 Company benchmarking
- 4.6 Innovation & technology landscape
Chapter 5 Market Size and Forecast, By Technology, 2022 - 2035 (USD Billion)
- 5.1 Key trends
- 5.2 Distributed energy resource
- 5.3 Demand response
- 5.4 Mixed asset
Chapter 6 Market Size and Forecast, By End Use, 2022 - 2035 (USD Billion)
- 6.1 Key trends
- 6.2 Residential
- 6.3 Industrial
- 6.4 Commercial
Chapter 7 Market Size and Forecast, By Region, 2022 - 2035 (USD Billion)
- 7.1 Key trends
- 7.2 North America
- 7.2.1 U.S.
- 7.2.2 Canada
- 7.3 Europe
- 7.3.1 Germany
- 7.3.2 France
- 7.3.3 UK
- 7.3.4 Italy
- 7.4 Asia Pacific
- 7.4.1 China
- 7.4.2 Japan
- 7.4.3 South Korea
- 7.4.4 India
- 7.5 Rest of world
Chapter 8 Company Profiles
- 8.1 AGL Energy
- 8.2 Bosch Global
- 8.3 Enbala Power Networks
- 8.4 Enel X
- 8.5 EnergyHub
- 8.6 ENGIE
- 8.7 Flexitricity
- 8.8 Hitachi
- 8.9 Lumenaza
- 8.10 Next Kraftwerke
- 8.11 Schneider Electric
- 8.12 Shell
- 8.13 Siemens
- 8.14 Statkraft
- 8.15 Sunrun
- 8.16 Sunnova Energy International
- 8.17 Tesla
- 8.18 Tiko Energy Solutions
- 8.19 Toshiba Corporation
- 8.20 Virtual Peaker
 全球虛擬電廠市場:機會與策略展望(至2035年)
 住宅虛擬電廠軟體市場(第一版)
 虛擬電廠市場-全球產業規模、佔有率、趨勢、機會、預測:按技術、組件、電源、最終用戶、地區和競爭格局分類,2021-2031年
 虛擬電廠市場:按組件、技術、能源來源、部署類型和最終用戶分類-2026-2032年全球市場預測
 虛擬電廠市場報告:按技術、電源、最終用戶和地區分類(2026-2034 年)
 虛擬電廠市場規模、佔有率、成長及全球產業分析:按類型、應用和地區分類的洞察,2026-2034 年預測全球虛擬電廠市場規模、佔有率、趨勢和成長分析報告(2026-2034年)
 全球虛擬電廠市場:市場規模、佔有率和趨勢分析(按技術、最終用途和地區分類),細分市場預測(2026-2033 年)
 全球虛擬電廠市場預測至2034年:按組件、電源、技術、應用、最終用戶和地區分類
 全球虛擬電廠市場洞察及預測(至2032年)