


 |
市場調查報告書
商品編碼
1936504
乘用車數位雙胞胎市場機會、成長要素、產業趨勢分析及2026年至2035年預測Passenger Car Digital Twin Market Opportunity, Growth Drivers, Industry Trend Analysis, and Forecast 2026 - 2035 |
||||||
全球乘用車數位雙胞胎市場預計到 2025 年價值 17 億美元,到 2035 年達到 199 億美元,年複合成長率為 28.7%。
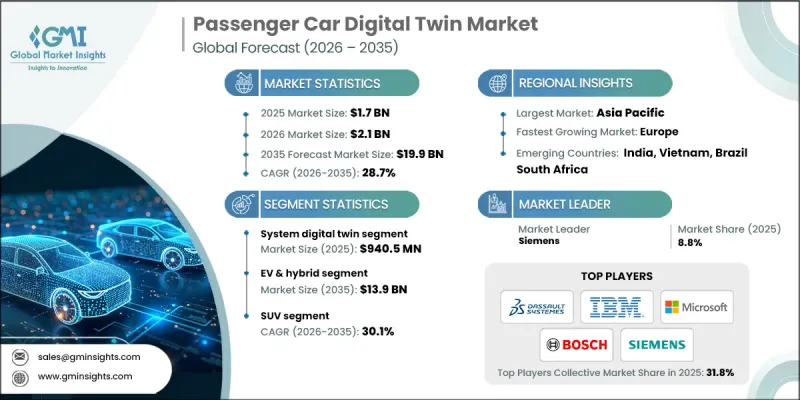
汽車生產需要先進技術來縮短開發週期、減少返工、降低原型成本並防止設備和零件故障。數位雙胞胎平台透過在實際生產開始前對整個車輛生命週期進行虛擬檢驗來滿足這些需求。製造商正在利用這些系統,透過即時模擬設計、製造和營運行為,顯著改善決策和成本控制。人工智慧 (AI) 和機器學習透過實現早期故障偵測、效能檢驗和預測性故障分析,進一步提升了數位雙胞胎的價值。這些功能使製造商和供應商能夠在車輛上市前識別問題。隨著向數據驅動製造、互聯工廠和軟體定義車輛的轉變,對數位雙胞胎的依賴性持續成長,並成為現代汽車生產策略的核心驅動力。
| 市場覆蓋範圍 | |
|---|---|
| 開始年份 | 2025 |
| 預測年份 | 2026-2035 |
| 起始值 | 17億美元 |
| 預測金額 | 199億美元 |
| 複合年成長率 | 28.7% |
系統級數位雙胞胎市場預計將佔據55.2%的市場佔有率,到2025年將創造約9.405億美元的收入。此細分市場佔據主導地位的原因在於市場對連網車輛系統全面模擬的需求日益成長。系統級數位雙胞胎使製造商能夠分析子系統(例如動力傳輸、安全架構和數位介面)之間複雜的交互作用。這些模型支援即時系統監控和預測性維護,從而在生產和營運階段提高可靠性並減少停機時間。
預計到2025年,電動和混合動力汽車市場佔有率將達到64.6%,到2035年市場規模將達到139億美元。這些車輛整合了先進的電子元件和感測器,能夠與數位雙胞胎平台無縫協作。數位雙胞胎技術使製造商能夠模擬電池劣化、熱性能、能源效率和軟體行為——這些都是電動和混合動力平台的關鍵要素。這項能力使數位雙胞胎成為最佳化下一代汽車架構的必備工具。
預計到2025年,美國乘用車數位雙胞胎市場規模將達到3.482億美元。隨著製造商將數位雙胞胎納入智慧製造舉措,以最佳化生產線、減少營運中斷並應對供應鏈的複雜性,其應用正在不斷成長。製造環境的即時數位副本能夠更快地解決問題並持續改進效能。雲端平台和互聯系統進一步支援了數位雙胞胎在生產和生產後分析的應用。
目錄
第1章調查方法
第2章執行摘要
第3章業界考察
- 生態系分析
- 供應商情況
- 利潤率
- 成本結構
- 每個階段的附加價值
- 影響價值鏈的因素
- 中斷
- 產業影響因素
- 促進要素
- 軟體定義車輛(SDV)的日益普及
- 乘用車架構日益複雜化
- 對虛擬原型製作和模擬技術的需求日益成長
- 原始設備製造商 (OEM) 專注於縮短產品上市時間
- 產業潛在風險與挑戰
- 較高的初始實施和整合成本
- 網路安全和資料隱私問題
- 市場機遇
- 在車輛生命週期的每個階段引入數位雙胞胎技術
- 用於在運作中車輛監控的即時數位雙胞胎
- 基於數位雙胞胎的按使用量付費(UBI)模型
- 聯合開發用於組件檢驗的數位雙胞胎解決方案
- 促進要素
- 成長潛力分析
- 監管環境
- 北美洲
- 美國國家公路交通安全管理局(NHTSA)
- FMVSS(聯邦機動車輛安全標準)
- 美國環保署(EPA)
- 加拿大機動車輛安全標準(運輸部)
- 歐洲
- 歐盟委員會(EC)
- 聯合國歐洲經濟委員會(UNECE)
- 一般資料保護規則(GDPR)
- 亞太地區
- 日本汽車標準國際化中心(JASIC)
- 中國汽車工程師學會(SAE China)
- KATS(韓國汽車科技研究院)
- AIS(汽車產業標準)
- 拉丁美洲
- 全國汽車製造商協會
- 國家計量與工業研究院(INMETRO)
- 拉丁美洲的車輛安全法規
- 中東和非洲
- 海灣合作理事會標準組織(GSO)
- 南非標準局 (SABS)
- 沙烏地阿拉伯標準、計量和品質組織(SASO)
- 北美洲
- 波特五力分析
- PESTEL 分析
- 科技與創新趨勢
- 當前技術趨勢
- 新興技術
- 成本細分分析
- 永續性和環境影響
- 環境影響評估
- 社會影響和社區效益
- 公司管治與企業社會責任
- 永續金融與投資趨勢
- 數位雙胞胎資料架構
- 即時資料流架構
- 感測器數據管理和處理
- 數據品質與管治框架
- 互通性和資料交換通訊協定
- 網路安全和隱私框架
- 數位雙胞胎網路安全威脅情勢
- 資料加密和存取控制機制
- 實施零信任架構
- 隱私保護技術
- 合規框架
- 案例研究
- 未來前景與機遇
第4章 競爭情勢
- 介紹
- 公司市佔率分析
- 北美洲
- 歐洲
- 亞太地區
- 拉丁美洲
- 中東和非洲
- 主要市場公司的競爭分析
- 競爭定位矩陣
- 戰略展望矩陣
- 重大進展
- 併購
- 夥伴關係與合作
- 新產品發布
- 企業擴張計畫和資金籌措
第5章 按組件分類的市場估算與預測,2022-2035年
- 硬體
- 物聯網感測器和設備
- 邊緣運算硬體
- 數據採集系統
- 連接基礎設施
- 軟體
- 服務
- 專業服務
- 系統整合
- 培訓和諮詢
- 支援與維護
- 託管服務
- 專業服務
第6章數位雙胞胎市場估算與預測,2022-2035年
- 系統數位雙胞胎
- 產品數位雙胞胎
- 流程數位雙胞胎
第7章 依實施類型分類的市場估計與預測,2022-2035年
- 基於雲端的
- 本地部署
- 混合
第8章 按車輛類型分類的市場估算與預測,2022-2035年
- 掀背車
- 轎車
- SUV
9. 2022-2035年按推進方式分類的市場估計與預測
- 內燃機(ICE)
- 電動車和混合動力汽車
- 電池式電動車(BEV)
- 插電式混合動力電動車(PHEV)
- 混合動力電動車(HEV)
- 燃料電池電動車(FCEV)
第10章 依應用領域分類的市場估計與預測,2022-2035年
- 產品設計與開發
- 預測性維護和效能監控
- 製造和製程最佳化
- 運作中營運和車隊管理
第11章 依最終用途分類的市場估計與預測,2022-2035年
- OEM
- 一級和二級供應商
- 汽車軟體和技術公司
- 行動服務供應商
- 保險公司
- 售後市場及服務中心
第12章 2022-2035年各地區市場估算與預測
- 北美洲
- 美國
- 加拿大
- 歐洲
- 德國
- 英國
- 法國
- 義大利
- 西班牙
- 俄羅斯
- 捷克共和國
- 比利時
- 荷蘭
- 亞太地區
- 中國
- 印度
- 日本
- 韓國
- 澳洲
- 新加坡
- 馬來西亞
- 印尼
- 越南
- 泰國
- 拉丁美洲
- 巴西
- 墨西哥
- 阿根廷
- 哥倫比亞
- 中東和非洲
- 南非
- 沙烏地阿拉伯
- 阿拉伯聯合大公國
第13章:公司簡介
- 世界公司
- ANSYS
- Autodesk
- Dassault
- GE Vernova
- Hexagon
- IBM
- Microsoft
- NVIDIA
- PTC
- Robert Bosch
- SAP
- Siemens
- 當地公司
- ABB
- AVEVA
- Emerson
- Honeywell
- Oracle
- Rockwell
- Schneider
- TCS
- 新興企業
- Amazon Web Services
- Lauterbach
- Toobler
- Unity
- Valeo
The Global Passenger Car Digital Twin Market was valued at USD 1.7 billion in 2025 and is estimated to grow at a CAGR of 28.7% to reach USD 19.9 billion by 2035.
Automotive production demands advanced technologies that reduce development cycles, minimize rework, lower prototype costs, and prevent equipment or component failures. Digital twin platforms address these needs by enabling virtual validation across the vehicle lifecycle before physical production begins. Manufacturers rely on these systems to simulate design, manufacturing, and operational behavior in real time, significantly improving decision-making and cost control. Artificial intelligence and machine learning further enhance digital twin value by enabling early fault detection, performance validation, and predictive failure analysis. These capabilities allow manufacturers and suppliers to identify issues before vehicles reach the market. The shift toward data-driven manufacturing, connected factories, and software-defined vehicles continues to increase reliance on digital twins as a core enabler of modern automotive production strategies.
| Market Scope | |
|---|---|
| Start Year | 2025 |
| Forecast Year | 2026-2035 |
| Start Value | $1.7 Billion |
| Forecast Value | $19.9 Billion |
| CAGR | 28.7% |
The system-level digital twins segment held a 55.2% share in 2025, generating approximately USD 940.5 million. This segment dominates due to the rising demand for holistic simulation of interconnected vehicle systems. System digital twins allow manufacturers to analyze complex interactions between subsystems such as power delivery, safety architecture, and digital interfaces. These models support real-time system monitoring and predictive maintenance, improving reliability and reducing downtime across production and operational stages.
The electric and hybrid vehicles segment held 64.6% share in 2025 and is projected to reach USD 13.9 billion by 2035. These vehicles integrate advanced electronic components and sensors that connect seamlessly with digital twin platforms. Digital twins help manufacturers simulate battery aging, thermal performance, power efficiency, and software behavior, which are critical factors for electric and hybrid platforms. This capability positions digital twins as essential tools for optimizing next-generation vehicle architectures.
United States Passenger Car Digital Twin Market reached USD 348.2 million in 2025. Adoption grows as manufacturers deploy digital twins within smart manufacturing initiatives to optimize production lines, reduce operational disruptions, and address supply chain complexity. Real-time digital replicas of manufacturing environments enable faster issue resolution and continuous performance improvement. Cloud-based platforms and connected systems further support digital twin adoption across production and post-production analytics.
Key companies active in the Global Passenger Car Digital Twin Market include Siemens, NVIDIA, SAP, Dassault, PTC, Microsoft, ANSYS, IBM, GE Vernova, and Robert Bosch. Companies in the passenger car digital twin market strengthen their competitive position by investing in AI-driven simulation, cloud-native platforms, and scalable digital engineering solutions. Many focus on integrating digital twins across design, manufacturing, and after-sales operations to deliver end-to-end lifecycle value. Strategic partnerships with automakers and suppliers accelerate platform adoption and customization. Continuous innovation in predictive analytics, real-time monitoring, and system interoperability enhances differentiation. Vendors emphasize compatibility with connected factory infrastructure and vehicle software ecosystems.
Table of Contents
Chapter 1 Methodology
- 1.1 Research approach
- 1.2 Quality commitments
- 1.2.1 GMI AI policy & data integrity commitment
- 1.3 Research trail & confidence scoring
- 1.3.1 Research trail components
- 1.3.2 Scoring components
- 1.4 Data collection
- 1.4.1 Partial list of primary sources
- 1.5 Data mining sources
- 1.5.1 Paid sources
- 1.6 Base estimates and calculations
- 1.6.1 Base year calculation
- 1.7 Forecast model
- 1.8 Research transparency addendum
Chapter 2 Executive Summary
- 2.1 Industry 360° synopsis
- 2.2 Key market trends
- 2.2.1 Regional
- 2.2.2 Component
- 2.2.3 Digital Twin
- 2.2.4 Deployment Mode
- 2.2.5 Vehicle
- 2.2.6 Propulsion
- 2.2.7 Application
- 2.2.8 End-Use
- 2.3 TAM analysis, 2026-2035
- 2.4 CXO perspectives: Strategic imperatives
- 2.4.1 Executive decision points
- 2.4.2 Critical success factors
- 2.5 Future outlook and recommendations
Chapter 3 Industry Insights
- 3.1 Industry ecosystem analysis
- 3.1.1 Supplier landscape
- 3.1.2 Profit margin
- 3.1.3 Cost structure
- 3.1.4 Value addition at each stage
- 3.1.5 Factor affecting the value chain
- 3.1.6 Disruptions
- 3.2 Industry impact forces
- 3.2.1 Growth drivers
- 3.2.1.1 Rising adoption of software-defined vehicles (SDVs)
- 3.2.1.2 Increasing complexity of passenger car architectures
- 3.2.1.3 Growing demand for virtual prototyping and simulation
- 3.2.1.4 OEM focus on reducing time-to-market
- 3.2.2 Industry pitfalls and challenges
- 3.2.2.1 High initial implementation and integration costs
- 3.2.2.2 Cybersecurity and data privacy concerns
- 3.2.3 Market opportunities
- 3.2.3.1 Digital twin deployment across vehicle lifecycle phases
- 3.2.3.2 Real-time digital twins for in-use vehicle monitoring
- 3.2.3.3 Usage-based insurance (UBI) models enhanced by digital twins
- 3.2.3.4 Co-development of digital twin solutions for component validations
- 3.2.1 Growth drivers
- 3.3 Growth potential analysis
- 3.4 Regulatory landscape
- 3.4.1 North America
- 3.4.1.1 National Highway Traffic Safety Administration (NHTSA)
- 3.4.1.2 FMVSS (Federal Motor Vehicle Safety Standards)
- 3.4.1.3 EPA (Environmental Protection Agency)
- 3.4.1.4 Canadian Motor Vehicle Safety Standards (Transport Canada)
- 3.4.2 Europe
- 3.4.2.1 European Commission (EC)
- 3.4.2.2 UNECE (United Nations Economic Commission for Europe)
- 3.4.2.3 EU General Data Protection Regulation (GDPR)
- 3.4.3 Asia Pacific
- 3.4.3.1 JASIC (Japan Automobile Standards Internationalization Center)
- 3.4.3.2 SAE China (Society of Automotive Engineers of China)
- 3.4.3.3 KATS (Korea Automotive Technology Institute)
- 3.4.3.4 AIS (Automotive Industry Standard)
- 3.4.4 Latin America
- 3.4.4.1 Associacao Nacional dos Fabricantes de Veiculos Automotores
- 3.4.4.2 National Institute of Metrology, Standardization and Industrial Standards (INMETRO)
- 3.4.4.3 LATAM Vehicle Safety Regulations
- 3.4.5 Middle East & Africa
- 3.4.5.1 GCC Standardization Organization (GSO)
- 3.4.5.2 South African Bureau of Standards (SABS)
- 3.4.5.3 Saudi Standards, Metrology and Quality Organization (SASO)
- 3.4.1 North America
- 3.5 Porter's analysis
- 3.6 PESTEL analysis
- 3.7 Technology and innovation landscape
- 3.7.1 Current technological trends
- 3.7.2 Emerging technologies
- 3.8 Cost breakdown analysis
- 3.9 Sustainability and environmental impact
- 3.9.1 Environmental impact assessment
- 3.9.2 Social impact & community benefits
- 3.9.3 Governance & corporate responsibility
- 3.9.4 Sustainable finance & investment trends
- 3.10 Data architecture for digital twins
- 3.10.1 Real-time data streaming architecture
- 3.10.2 Sensor data management & processing
- 3.10.3 Data quality & governance frameworks
- 3.10.4 Interoperability & data exchange protocols
- 3.11 Cybersecurity & privacy frameworks
- 3.11.1 Cybersecurity threat landscape for digital twins
- 3.11.2 Data encryption & access control mechanisms
- 3.11.3 Zero trust architecture implementation
- 3.11.4 Privacy-preserving technologies
- 3.11.5 Compliance frameworks
- 3.12 Case studies
- 3.13 Future outlook & opportunities
Chapter 4 Competitive Landscape, 2025
- 4.1 Introduction
- 4.2 Company market share analysis
- 4.2.1 North America
- 4.2.2 Europe
- 4.2.3 Asia Pacific
- 4.2.4 LATAM
- 4.2.5 MEA
- 4.3 Competitive analysis of major market players
- 4.4 Competitive positioning matrix
- 4.5 Strategic outlook matrix
- 4.6 Key developments
- 4.6.1 Mergers & acquisitions
- 4.6.2 Partnerships & collaborations
- 4.6.3 New product launches
- 4.6.4 Expansion plans and funding
Chapter 5 Market Estimates & Forecast, By Component, 2022 - 2035 ($Bn)
- 5.1 Key trends
- 5.2 Hardware
- 5.2.1 IoT sensors & devices
- 5.2.2 Edge computing hardware
- 5.2.3 Data acquisition systems
- 5.2.4 Connectivity infrastructure
- 5.3 Software
- 5.4 Services
- 5.4.1 Professional services
- 5.4.1.1 System integration
- 5.4.1.2 Training & consulting
- 5.4.1.3 Support & maintenance
- 5.4.2 Managed services
- 5.4.1 Professional services
Chapter 6 Market Estimates & Forecast, By Digital Twin, 2022 - 2035 ($Bn)
- 6.1 Key trends
- 6.2 System digital twin
- 6.3 Product digital twin
- 6.4 Process digital twin
Chapter 7 Market Estimates & Forecast, By Deployment Mode, 2022 - 2035 ($Bn)
- 7.1 Key trends
- 7.2 Cloud-based
- 7.3 On-premises
- 7.4 Hybrid
Chapter 8 Market Estimates & Forecast, By Vehicle, 2022 - 2035 ($Bn)
- 8.1 Key trends
- 8.2 Hatchback
- 8.3 Sedan
- 8.4 SUV
Chapter 9 Market Estimates & Forecast, By Propulsion, 2022 - 2035 ($Bn)
- 9.1 Key trends
- 9.2 Internal Combustion Engine (ICE)
- 9.3 EV & Hybrid
- 9.3.1 Battery electric vehicle (BEV)
- 9.3.2 Plug-in hybrid electric vehicle (PHEV)
- 9.3.3 Hybrid electric vehicle (HEV)
- 9.3.4 Fuel cell electric vehicle (FCEV)
Chapter 10 Market Estimates & Forecast, By Application, 2022 - 2035 ($Bn)
- 10.1 Key trends
- 10.2 Product design & development
- 10.3 Predictive maintenance & performance monitoring
- 10.4 Manufacturing & process optimization
- 10.5 In-service operations & fleet management
Chapter 11 Market Estimates & Forecast, By End Use, 2022 - 2035 ($Bn)
- 11.1 Key trends
- 11.2 Original equipment manufacturers
- 11.3 Tier 1 & Tier 2 Suppliers
- 11.4 Automotive software & technology companies
- 11.5 Mobility service providers
- 11.6 Insurance companies
- 11.7 Aftermarket & service centers
Chapter 12 Market Estimates & Forecast, By Region, 2022 - 2035 ($Bn)
- 12.1 Key trends
- 12.2 North America
- 12.2.1 US
- 12.2.2 Canada
- 12.3 Europe
- 12.3.1 Germany
- 12.3.2 UK
- 12.3.3 France
- 12.3.4 Italy
- 12.3.5 Spain
- 12.3.6 Russia
- 12.3.7 Czech Republic
- 12.3.8 Belgium
- 12.3.9 Netherlands
- 12.4 Asia Pacific
- 12.4.1 China
- 12.4.2 India
- 12.4.3 Japan
- 12.4.4 South Korea
- 12.4.5 Australia
- 12.4.6 Singapore
- 12.4.7 Malaysia
- 12.4.8 Indonesia
- 12.4.9 Vietnam
- 12.4.10 Thailand
- 12.5 Latin America
- 12.5.1 Brazil
- 12.5.2 Mexico
- 12.5.3 Argentina
- 12.5.4 Colombia
- 12.6 MEA
- 12.6.1 South Africa
- 12.6.2 Saudi Arabia
- 12.6.3 UAE
Chapter 13 Company Profiles
- 13.1 Global companies
- 13.1.1 ANSYS
- 13.1.2 Autodesk
- 13.1.3 Dassault
- 13.1.4 GE Vernova
- 13.1.5 Hexagon
- 13.1.6 IBM
- 13.1.7 Microsoft
- 13.1.8 NVIDIA
- 13.1.9 PTC
- 13.1.10 Robert Bosch
- 13.1.11 SAP
- 13.1.12 Siemens
- 13.2 Regional companies
- 13.2.1 ABB
- 13.2.2 AVEVA
- 13.2.3 Emerson
- 13.2.4 Honeywell
- 13.2.5 Oracle
- 13.2.6 Rockwell
- 13.2.7 Schneider
- 13.2.8 TCS
- 13.3 Emerging companies
- 13.3.1 Amazon Web Services
- 13.3.2 Lauterbach
- 13.3.3 Toobler
- 13.3.4 Unity
- 13.3.5 Valeo
 洪水災後重建市場:依服務類型、災害原因、重建服務、最終用戶和通路-2026-2032年全球預測電破碎平台市場:按類型、壓力等級、最終用戶和應用分類,全球預測,2026-2032年
 全球生態系修復服務市場規模、佔有率、趨勢和成長分析報告(2026-2034年)
 汽車數位孿生市場-全球產業規模、佔有率、趨勢、機會及預測(依車輛類型、零件類型、最終用戶產業、地區及競爭格局分類,2021-2031年預測)
 汽車數位孿生硬體市場機會、成長促進因素、產業趨勢分析及預測(2025-2034年)
 2025年數位雙胞胎血庫物流全球市場報告電動車平台市場-全球產業規模、佔有率、趨勢、機會和預測,按車輛類型、推進類型、組件、地區和競爭細分,2020-2030 年汽車市場的數位孿生機會、成長動力、產業趨勢分析及 2025 - 2034 年預測
 全球物流數位雙胞胎市場全球汽車數位雙胞胎市場