


 |
市場調查報告書
商品編碼
1822563
汽車市場的數位孿生機會、成長動力、產業趨勢分析及 2025 - 2034 年預測Digital Twin in Automotive Market Opportunity, Growth Drivers, Industry Trend Analysis, and Forecast 2025 - 2034 |
||||||
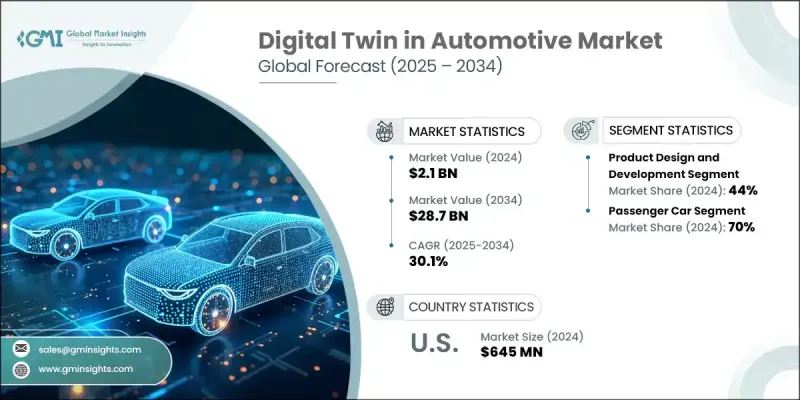
2024 年全球汽車數位孿生市場價值為 21 億美元,預計到 2034 年將以 30.1% 的複合年成長率成長至 287 億美元。
這一顯著成長得益於汽車產業持續的數位轉型。對互聯技術、物聯網 (IoT)、工業物聯網 (IIoT) 和工業 4.0 原則的日益依賴,正在將傳統汽車轉變為智慧的數據驅動機器。隨著汽車從機械硬體發展到複雜的軟體平台,數位孿生技術正被用於管理來自感測器、系統和車載電腦的大量資料。汽車製造商正在利用這些資料來提升性能、預防故障,並透過人工智慧、機器學習和進階分析技術實現預測性維護。事實證明,數位孿生不僅在類比設計和工程變更方面至關重要,而且在提高營運效率、指導員工培訓和精簡生產方面也發揮著重要作用。電動車和自動駕駛汽車需求的激增進一步加速了對支援更快原型設計和即時監控的虛擬複製品的需求。隨著汽車產業朝著永續發展、零排放出行和智慧基礎設施的方向發展,數位孿生的採用率預計將迅速上升。各大公司正積極應對,加強投資並制定策略性舉措,以在高成長環境中保持競爭力。
| 市場範圍 | |
|---|---|
| 起始年份 | 2024 |
| 預測年份 | 2025-2034 |
| 起始值 | 21億美元 |
| 預測值 | 287億美元 |
| 複合年成長率 | 30.1% |
在這一市場中,產品設計和開發部門在2024年佔據了44%的佔有率,預計在2025年至2034年期間的複合年成長率將達到29%。汽車製造商正在使用數位孿生技術在生產前開發和驗證車輛零件。這使得團隊能夠降低原型設計成本,縮短開發週期,並加快電動車電池、動力系統和車輛空氣動力學等複雜系統的創新。在早期階段對複雜元素進行仿真,可加快測試速度、精確迭代並縮短上市時間。這些優勢正在幫助原始設備製造商滿足消費者日益成長的效能和客製化需求,同時保持領先於監管時間表。
2024年,乘用車市場佔了70%的市場佔有率,預計到2034年將以29%的複合年成長率成長。汽車公司正在使用數位孿生技術來評估電動車電池在不同駕駛模式和環境條件下的性能。這種方法有助於最佳化熱效率、能量密度和電池安全性等關鍵參數。透過提升電動車動力系統的性能和使用壽命,數位孿生技術直接有助於減少排放,並促進電動乘用車的更廣泛應用。全球對永續交通解決方案的日益重視,進一步推動了數位孿生平台在該領域的應用。
2024年,美國汽車數位孿生市場佔90%的市場佔有率,產值達6.45億美元。美國汽車生態系統持續突破汽車創新的界限,尤其是在電動車和自動駕駛領域。各大公司正在利用數位孿生環境進行組件虛擬測試、效能微調,並應對電池管理等挑戰,而無需等待實際故障發生。這些解決方案顯著縮短了產品開發時間,同時提高了可靠性。對快速設計到部署週期的需求日益成長,在加速整個地區市場發展勢頭方面發揮關鍵作用。
全球汽車數位孿生市場的領先公司包括凱捷、西門子、通用電氣、微軟、IBM、博世和達梭系統。這些參與者是汽車領域客製化模擬和建模技術進步的關鍵貢獻者。數位孿生汽車領域的頂尖公司正在透過持續創新、合作夥伴關係和有針對性的收購來擴大其市場佔有率。許多公司正在將人工智慧和高級分析整合到他們的平台中,以提供預測診斷和即時監控功能。各組織也正在開發可客製化、可擴展的解決方案,以滿足從概念到營運的車輛生命週期的不同階段的需求。為了增強競爭力,該公司正在與汽車製造商和軟體開發商建立策略聯盟,以簡化全球營運中數位孿生工具的實施。
目錄
第1章:方法論
- 市場範圍和定義
- 研究設計
- 研究方法
- 資料收集方法
- 資料探勘來源
- 全球的
- 地區/國家
- 基礎估算與計算
- 基準年計算
- 市場評估的主要趨勢
- 初步研究和驗證
- 主要來源
- 預測模型
- 研究假設和局限性
第 2 章:執行摘要
第3章:行業洞察
- 產業生態系統分析
- 供應商概況
- 利潤率
- 成本結構
- 每個階段的增值
- 影響價值鏈的因素
- 中斷
- 產業衝擊力
- 成長動力
- 人工智慧和自動化在招募中的應用日益增多
- 對集中招募平台的需求日益成長
- 遠距和混合工作文化日益發展
- 與 CRM 和 HRIS 系統整合
- 轉向數據驅動的招募決策
- 產業陷阱與挑戰
- 高昂的初始設定和訂閱成本
- 資料隱私和合規性問題
- 與遺留系統的整合複雜性
- 過度使用自動化導致候選人體驗問題
- 針對利基行業的有限客製化
- 市場機會
- 人工智慧驅動的候選人搜尋和技能匹配
- 新興市場的擴張
- 與視訊面試和評估工具整合
- 自由職業和零工經濟招聘
- 以行動優先的 ATS 採用
- 人力資源技術生態系合作夥伴關係
- 成長動力
- 數位孿生技術基礎與架構
- 數位孿生基礎與發展
- 數位孿生的類型:產品、流程、績效、資產、系統
- 數位線程和資料互通性
- 基於模型的系統工程(MBSE)
- 物理-數位-物理(PDP)環路
- 即時數據同步與回饋
- 成長潛力分析
- 監管格局
- 北美洲
- 歐洲
- 亞太地區
- 拉丁美洲
- 中東和非洲
- 波特的分析
- PESTEL分析
- 技術創新與先進功能
- 類比引擎和求解器技術
- 物聯網感測器整合和數據採集
- 邊緣運算、5G 和即時數位孿生
- AI/ML 模型管理與模擬自動化
- AR/VR與沉浸式視覺化
- 雲端、本機和混合架構
- API和系統整合能力
- 價格趨勢分析
- 成本分解分析
- 專利分析
- 依技術領域分析專利組合
- 專利申請趨勢與創新活動
- 競爭專利情報
- 永續性和環境方面
- 永續實踐
- 減少廢棄物的策略
- 生產中的能源效率
- 環保舉措
- 碳足跡考量
- 用例
- 產品設計與虛擬原型設計
- 概念設計、模擬和測試
- 輕量化和材料最佳化
- 碰撞和衝擊模擬
- 製造與智慧工廠
- 生產計劃與調度
- 機器人與自動化整合
- 品質控制和即時監控
- 工廠佈局和流程最佳化
- 車輛性能與生命週期管理
- 預測性維護和狀態監測
- 保固分析和召回管理
- 車隊管理和使用情況分析
- OTA 更新與線上升級
- 供應鍊和物流最佳化
- 供應鏈數位孿生與可視性
- 庫存最佳化和需求預測
- 供應商協作與風險管理
- 物流網路仿真
- 客戶體驗和售後
- 個人化車輛配置及銷售
- 數位展廳和VR/AR視覺化
- 互聯服務和遠端診斷
- 客戶回饋循環和產品改進
- 監管、保固和合規性數位孿生
- 監理合規和數字報告
- 保固索賠和根本原因分析
- 安全認證和審計追蹤
- 產品設計與虛擬原型設計
- 最佳情況
- 報廢、回收和循環經濟
- 拆解回收的數位孿生
- 再製造、再利用和循環供應鏈
- 監理報告與合規
- 生命週期評估和碳影響
- 商業模式創新與貨幣化
- 數位孿生即服務(DTaaS)
- 按使用付費和訂閱模式
- 基於價值的定價和基於結果的模型
- 數位孿生貨幣化和數據許可
- 組織變革、勞動力與流程轉型
- 變更管理與數位孿生採用
- 勞動力再培訓和人才發展
- 數位孿生成熟度模型與組織準備狀況
- 流程再造與敏捷轉型
- 生態系、標準和聯盟
- 業界標準與參考架構
- 數位孿生聯盟、ASAM 和其他聯盟
- 開源與專有解決方案
- 生態系夥伴關係與互通性
- 永續性、ESG和生命週期評估
- 碳足跡分析和報告
- ESG指標與合規性
- 永續設計與綠色製造
- 循環經濟與資源最佳化
- 投資報酬率、成本效益和回報分析
- 實施成本結構和投資要求
- 營運和財務效益
- 策略利益和競爭優勢
- 投資報酬率架構與投資回收期分析
- 未來情境和中斷分析
- 自動駕駛汽車與數位孿生整合
- MaaS、智慧城市與 V2 X
- 監管演變和政策影響
- 科技顛覆與產業轉型
第4章:競爭格局
- 介紹
- 公司市佔率分析
- 主要市場參與者的競爭分析
- 競爭定位矩陣
- 戰略展望矩陣
- 關鍵進展
- 併購
- 夥伴關係與合作
- 新產品發布
- 擴張計劃和資金
第5章:市場估計與預測:依部署模式,2021-2034
- 主要趨勢
- 雲
- 本地
- 混合
第6章:市場估計與預測:依車型,2021-2034
- 主要趨勢
- 搭乘用車
- 掀背車
- 轎車
- SUV
- 商用車
- 輕型
- 中型
- 重負
第7章:市場估計與預測:依技術,2021-2034
- 主要趨勢
- 系統數位孿生
- 產品數位孿生
- 流程數位孿生
第 8 章:市場估計與預測:按應用,2021-2034 年
- 主要趨勢
- 產品設計與開發
- 機器和設備健康監測
- 流程支援和服務
第9章:市場估計與預測:依最終用途,2021-2034
- 主要趨勢
- 原始設備製造商
- 一級供應商
- 汽車軟體和技術公司
- 行動服務提供者
- 售後市場及服務中心
第 10 章:市場估計與預測:按地區,2021-2034 年
- 主要趨勢
- 北美洲
- 美國
- 加拿大
- 歐洲
- 英國
- 德國
- 法國
- 義大利
- 西班牙
- 俄羅斯
- 北歐人
- 亞太地區
- 中國
- 印度
- 日本
- 韓國
- 澳新銀行
- 東南亞
- 拉丁美洲
- 巴西
- 墨西哥
- 阿根廷
- 多邊環境協定
- 南非
- 沙烏地阿拉伯
- 阿拉伯聯合大公國
第 11 章:公司簡介
- Global Leaders
- Altair
- Ansys
- Autodesk
- Capgemini
- Dassault Systemes
- General Electric
- IBM
- Microsoft
- Oracle
- PTC
- SAP
- Siemens
- Regional Champions
- AVL
- Bentley Systems
- Bosch
- Cognizant
- Hexagon
- KPIT Technologies
- Tata Technologies
- 新興參與者/顛覆者
- Bosch
- General Electric
- Siemens Energy
The Global Digital Twin in Automotive Market was valued at USD 2.1 billion in 2024 and is estimated to grow at a CAGR of 30.1% to reach USD 28.7 billion by 2034.
This significant growth is being fueled by the ongoing digital transformation across the automotive sector. Increasing reliance on connected technologies, IoT, IIoT, and Industry 4.0 principles is transforming traditional vehicles into intelligent, data-driven machines. As vehicles evolve from mechanical hardware to complex software platforms, digital twin technology is being used to manage large-scale data from sensors, systems, and onboard computers. Automakers are leveraging this data to improve performance, prevent breakdowns, and enable predictive maintenance using AI, machine learning, and advanced analytics. Digital twins are proving vital not only in simulating design and engineering changes but also in enhancing operational efficiency, guiding workforce training, and streamlining production. The surge in demand for electric and autonomous vehicles is further accelerating the need for virtual replicas that support faster prototyping and real-time monitoring. As the industry pushes toward sustainability, zero-emission mobility, and smart infrastructure, digital twin adoption is expected to rise rapidly. Companies are responding with strong investment and strategic initiatives to remain competitive in this high-growth environment.
| Market Scope | |
|---|---|
| Start Year | 2024 |
| Forecast Year | 2025-2034 |
| Start Value | $2.1 Billion |
| Forecast Value | $28.7 Billion |
| CAGR | 30.1% |
Within this market, the product design and development segment held a 44% share in 2024 and is set to grow at a CAGR of 29% between 2025 and 2034. Automakers are using digital twin technology to develop and validate vehicle components before manufacturing. This allows teams to reduce prototyping costs, shorten development cycles, and speed up innovation for complex systems like EV batteries, powertrains, and vehicle aerodynamics. The simulation of intricate elements at an early stage enables faster testing, accurate iteration, and quicker time-to-market. These benefits are helping OEMs meet growing consumer demands for performance and customization while staying ahead of regulatory timelines.
The passenger car segment held a 70% share in 2024 and is expected to grow at a CAGR of 29% through 2034. Automotive companies are using digital twins to evaluate how EV batteries behave under diverse driving patterns and environmental conditions. This approach helps optimize key parameters such as thermal efficiency, energy density, and battery safety. By improving the performance and lifespan of EV power systems, digital twins contribute directly to reducing emissions and encouraging broader adoption of electric passenger vehicles. The growing global push toward sustainable transport solutions is further intensifying the use of digital twin platforms in this segment.
United States Digital Twin in Automotive Market held a 90% share in 2024, generating USD 645 million. The US automotive ecosystem continues to push the boundaries of vehicle innovation, especially in the electric and autonomous space. Companies are using digital twin environments to test components virtually, fine-tune performance, and address challenges like battery management all without waiting for real-world failures. These solutions are significantly cutting down product development time while increasing dependability. The growing demand for rapid design-to-deployment cycles is playing a critical role in accelerating market momentum across the region.
Leading companies in the Global Digital Twin in Automotive Market include Capgemini, Siemens, General Electric, Microsoft, IBM, Bosch, and Dassault Systemes. These players are key contributors to the advancement of simulation and modeling technologies tailored for the automotive landscape. Top companies in the digital twin automotive space are expanding their market presence through continuous innovation, collaborative partnerships, and focused acquisitions. Many are integrating AI and advanced analytics into their platforms to offer predictive diagnostics and real-time monitoring features. Organizations are also developing customizable, scalable solutions that cater to different stages of the vehicle lifecycle from concept to operation. To enhance competitiveness, firms are forming strategic alliances with automakers and software developers to streamline the implementation of digital twin tools across global operations.
Table of Contents
Chapter 1 Methodology
- 1.1 Market scope and definition
- 1.2 Research design
- 1.2.1 Research approach
- 1.2.2 Data collection methods
- 1.3 Data mining sources
- 1.3.1 Global
- 1.3.2 Regional/Country
- 1.4 Base estimates and calculations
- 1.4.1 Base year calculation
- 1.4.2 Key trends for market estimation
- 1.5 Primary research and validation
- 1.5.1 Primary sources
- 1.6 Forecast model
- 1.7 Research assumptions and limitations
Chapter 2 Executive Summary
- 2.1 Industry 360° synopsis, 2021 - 2034
- 2.2 Key market trends
- 2.2.1 Regional
- 2.2.2 Deployment Mode
- 2.2.3 Vehicle
- 2.2.4 Technology
- 2.2.5 Application
- 2.2.6 End Use
- 2.3 TAM Analysis, 2025-2034
- 2.4 CXO perspectives: Strategic imperatives
- 2.4.1 Executive decision points
- 2.4.2 Critical success factors
- 2.5 Future outlook and strategic recommendations
Chapter 3 Industry Insights
- 3.1 Industry ecosystem analysis
- 3.1.1 Supplier Landscape
- 3.1.2 Profit Margin
- 3.1.3 Cost structure
- 3.1.4 Value addition at each stage
- 3.1.5 Factor affecting the value chain
- 3.1.6 Disruptions
- 3.2 Industry impact forces
- 3.2.1 Growth drivers
- 3.2.1.1 Rising adoption of AI & automation in recruitment
- 3.2.1.2 Increasing need for centralized recruitment platforms
- 3.2.1.3 Growing remote & hybrid work culture
- 3.2.1.4 Integration with CRM and HRIS systems
- 3.2.1.5 Shift toward data-driven hiring decisions
- 3.2.2 Industry pitfalls and challenges
- 3.2.2.1 High initial setup and subscription costs
- 3.2.2.2 Data privacy & compliance concerns
- 3.2.2.3 Integration complexity with legacy systems
- 3.2.2.4 Candidate experience issues from automation overuse
- 3.2.2.5 Limited customization for niche industries
- 3.2.3 Market opportunities
- 3.2.3.1 AI-driven candidate sourcing & skill-matching
- 3.2.3.2 Expansion in emerging markets
- 3.2.3.3 Integration with video interviewing & assessment tools
- 3.2.3.4 Freelance & gig economy recruitment
- 3.2.3.5 Mobile-first ATS adoption
- 3.2.3.6 HR tech ecosystem partnerships
- 3.2.1 Growth drivers
- 3.3 Digital Twin Technology Foundation and Architecture
- 3.3.1 Digital Twin Fundamentals and Evolution
- 3.3.2 Types of Digital Twins: Product, Process, Performance, Asset, System
- 3.3.3 Digital Thread and Data Interoperability
- 3.3.4 Model-Based Systems Engineering (MBSE)
- 3.3.5 Physical-Digital-Physical (PDP) Loop
- 3.3.6 Real-Time Data Synchronization and Feedback
- 3.4 Growth potential analysis
- 3.5 Regulatory landscape
- 3.5.1 North America
- 3.5.2 Europe
- 3.5.3 Asia Pacific
- 3.5.4 Latin America
- 3.5.5 Middle East & Africa
- 3.6 Porter's analysis
- 3.7 PESTEL analysis
- 3.8 Technology innovation and advanced features
- 3.8.1 Simulation Engines and Solver Technology
- 3.8.2 IoT Sensor Integration and Data Acquisition
- 3.8.3 Edge Computing, 5G, and Real-Time Digital Twins
- 3.8.4 AI/ML Model Management and Simulation Automation
- 3.8.5 AR/VR and Immersive Visualization
- 3.8.6 Cloud, On-Premises, and Hybrid Architectures
- 3.8.7 API and System Integration Capabilities
- 3.9 Price trend analysis
- 3.10 Cost breakdown analysis
- 3.11 Patent analysis
- 3.11.1 Patent Portfolio Analysis by Technology Area
- 3.11.2 Patent Filing Trends and Innovation Activity
- 3.11.3 Competitive Patent Intelligence
- 3.12 Sustainability and Environmental Aspects
- 3.12.1 Sustainable Practices
- 3.12.2 Waste Reduction Strategies
- 3.12.3 Energy Efficiency in Production
- 3.12.4 Eco-friendly Initiatives
- 3.12.5 Carbon Footprint Considerations
- 3.13 Use cases
- 3.13.1 Product Design and Virtual Prototyping
- 3.13.1.1 Concept Design, Simulation, and Testing
- 3.13.1.2 Lightweighting and Material Optimization
- 3.13.1.3 Crash and Impact Simulation
- 3.13.2 Manufacturing and Smart Factory
- 3.13.2.1 Production Planning and Scheduling
- 3.13.2.2 Robotics and Automation Integration
- 3.13.2.3 Quality Control and Real-Time Monitoring
- 3.13.2.4 Factory Layout and Process Optimization
- 3.13.3 Vehicle Performance and Lifecycle Management
- 3.13.3.1 Predictive Maintenance and Condition Monitoring
- 3.13.3.2 Warranty Analytics and Recall Management
- 3.13.3.3 Fleet Management and Usage Analytics
- 3.13.3.4 OTA Updates and In-Service Upgrades
- 3.13.4 Supply Chain and Logistics Optimization
- 3.13.4.1 Supply Chain Digital Twin and Visibility
- 3.13.4.2 Inventory Optimization and Demand Forecasting
- 3.13.4.3 Supplier Collaboration and Risk Management
- 3.13.4.4 Logistics Network Simulation
- 3.13.5 Customer Experience and Aftersales
- 3.13.5.1 Personalized Vehicle Configuration and Sales
- 3.13.5.2 Digital Showroom and VR/AR Visualization
- 3.13.5.3 Connected Services and Remote Diagnostics
- 3.13.5.4 Customer Feedback Loop and Product Improvement
- 3.13.6 Regulatory, Warranty, and Compliance Digital Twins
- 3.13.6.1 Regulatory Compliance and Digital Reporting
- 3.13.6.2 Warranty Claims and Root Cause Analysis
- 3.13.6.3 Safety Certification and Audit Trail
- 3.13.1 Product Design and Virtual Prototyping
- 3.14 Best-case scenario
- 3.15 End-of-Life, Recycling, and Circular Economy
- 3.15.1 Digital Twin for Dismantling and Recycling
- 3.15.2 Remanufacturing, Reuse, and Circular Supply Chains
- 3.15.3 Regulatory Reporting and Compliance
- 3.15.4 Lifecycle Assessment and Carbon Impact
- 3.16 Business Model Innovation & Monetization
- 3.16.1 Digital Twin as a Service (DTaaS)
- 3.16.2 Pay-per-Use and Subscription Models
- 3.16.3 Value-Based Pricing and Outcome-Based Models
- 3.16.4 Digital Twin Monetization and Data Licensing
- 3.17 Organizational Change, Workforce, and Process Transformation
- 3.17.1 Change Management and Digital Twin Adoption
- 3.17.2 Workforce Reskilling and Talent Development
- 3.17.3 Digital Twin Maturity Models and Organizational Readiness
- 3.17.4 Process Reengineering and Agile Transformation
- 3.18 Ecosystem, Standards, and Consortia
- 3.18.1 Industry Standards and Reference Architectures
- 3.18.2 Digital Twin Consortium, ASAM, and Other Alliances
- 3.18.3 Open Source vs Proprietary Solutions
- 3.18.4 Ecosystem Partnerships and Interoperability
- 3.19 Sustainability, ESG, and Lifecycle Assessment
- 3.19.1 Carbon Footprint Analytics and Reporting
- 3.19.2 ESG Metrics and Compliance
- 3.19.3 Sustainable Design and Green Manufacturing
- 3.19.4 Circular Economy and Resource Optimization
- 3.20 ROI, Cost-Benefit, and Payback Analysis
- 3.20.1 Implementation Cost Structure and Investment Requirements
- 3.20.2 Operational and Financial Benefits
- 3.20.3 Strategic Benefits and Competitive Advantage
- 3.20.4 ROI Frameworks and Payback Period Analysis
- 3.21 Future Scenarios and Disruption Analysis
- 3.21.1 Autonomous Vehicles and Digital Twin Integration
- 3.21.2. MaaS, Smart Cities, and V2 X
- 3.21.3 Regulatory Evolution and Policy Impact
- 3.21.4 Technology Disruption and Industry Transformation
Chapter 4 Competitive Landscape, 2024
- 4.1 Introduction
- 4.2 Company market share analysis
- 4.2.1 North America
- 4.2.2 Europe
- 4.2.3 Asia Pacific
- 4.2.4 Latin America
- 4.2.5 MEA
- 4.3 Competitive analysis of major market players
- 4.4 Competitive positioning matrix
- 4.5 Strategic outlook matrix
- 4.6 Key developments
- 4.6.1 Mergers & acquisitions
- 4.6.2 Partnerships & collaborations
- 4.6.3 New Product Launches
- 4.6.4 Expansion Plans and funding
Chapter 5 Market Estimates & Forecast, By Deployment Mode, 2021-2034 ($Bn)
- 5.1 Key trends
- 5.2 Cloud
- 5.3 On-premises
- 5.4 Hybrid
Chapter 6 Market Estimates & Forecast, By Vehicle, 2021-2034 ($Bn)
- 6.1 Key trends
- 6.2 Passenger car
- 6.2.1 Hatchback
- 6.2.2 Sedan
- 6.2.3 SUV
- 6.3 Commercial vehicle
- 6.3.1 Light duty
- 6.3.2 Medium-duty
- 6.3.3 Heavy-duty
Chapter 7 Market Estimates & Forecast, By Technology, 2021-2034 ($Bn)
- 7.1 Key trends
- 7.2 System digital twin
- 7.3 Product digital twin
- 7.4 Process digital twin
Chapter 8 Market Estimates & Forecast, By Application, 2021-2034 ($Bn)
- 8.1 Key trends
- 8.2 Product design and development
- 8.3 Machine and equipment health monitoring
- 8.4 Process support and service
Chapter 9 Market Estimates & Forecast, By End Use, 2021-2034 ($Bn)
- 9.1 Key trends
- 9.2 OEMs
- 9.3 Tier 1 suppliers
- 9.4 Automotive software and technology companies
- 9.5 Mobility service providers
- 9.6 Aftermarket and service centers
Chapter 10 Market Estimates & Forecast, By Region, 2021-2034 ($Bn)
- 10.1 Key trends
- 10.2 North America
- 10.2.1 US
- 10.2.2 Canada
- 10.3 Europe
- 10.3.1 UK
- 10.3.2 Germany
- 10.3.3 France
- 10.3.4 Italy
- 10.3.5 Spain
- 10.3.6 Russia
- 10.3.7 Nordics
- 10.4 Asia Pacific
- 10.4.1 China
- 10.4.2 India
- 10.4.3 Japan
- 10.4.4 South Korea
- 10.4.5 ANZ
- 10.4.6 Southeast Asia
- 10.5 Latin America
- 10.5.1 Brazil
- 10.5.2 Mexico
- 10.5.3 Argentina
- 10.6 MEA
- 10.6.1 South Africa
- 10.6.2 Saudi Arabia
- 10.6.3 UAE
Chapter 11 Company Profiles
- 11.1 Global Leaders
- 11.1.1 Altair
- 11.1.2 Ansys
- 11.1.3 Autodesk
- 11.1.4 Capgemini
- 11.1.5 Dassault Systemes
- 11.1.6 General Electric
- 11.1.7 IBM
- 11.1.8 Microsoft
- 11.1.9 Oracle
- 11.1.10 PTC
- 11.1.11 SAP
- 11.1.12 Siemens
- 11.2 Regional Champions
- 11.2.1 AVL
- 11.2.2 Bentley Systems
- 11.2.3 Bosch
- 11.2.4 Cognizant
- 11.2.5 Hexagon
- 11.2.6 KPIT Technologies
- 11.2.7 Tata Technologies
- 11.3 Emerging Players / Disruptors
- 11.3.1 Bosch
- 11.3.2 General Electric
- 11.3.3 Siemens Energy
 洪水災後重建市場:依服務類型、災害原因、重建服務、最終用戶和通路-2026-2032年全球預測電破碎平台市場:按類型、壓力等級、最終用戶和應用分類,全球預測,2026-2032年
 全球生態系修復服務市場規模、佔有率、趨勢和成長分析報告(2026-2034年)
 乘用車數位雙胞胎市場機會、成長要素、產業趨勢分析及2026年至2035年預測
 汽車數位孿生市場-全球產業規模、佔有率、趨勢、機會及預測(依車輛類型、零件類型、最終用戶產業、地區及競爭格局分類,2021-2031年預測)汽車數位孿生硬體市場機會、成長促進因素、產業趨勢分析及預測(2025-2034年)
 2025年數位雙胞胎血庫物流全球市場報告電動車平台市場-全球產業規模、佔有率、趨勢、機會和預測,按車輛類型、推進類型、組件、地區和競爭細分,2020-2030 年
 全球物流數位雙胞胎市場全球汽車數位雙胞胎市場