


 |
市場調查報告書
商品編碼
1936478
汽車人工智慧模擬與合成資料生成市場機會、成長要素、產業趨勢分析及2026年至2035年預測Automotive AI Simulation and Synthetic Data Generation Market Opportunity, Growth Drivers, Industry Trend Analysis, and Forecast 2026 - 2035 |
||||||
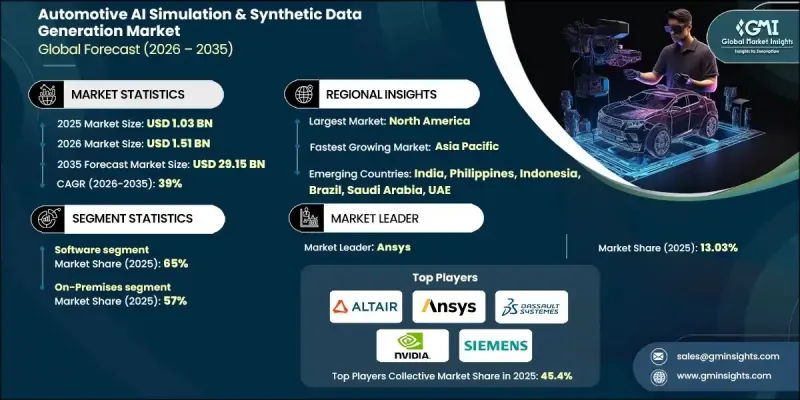
全球汽車人工智慧模擬和合成數據生成市場預計到 2025 年將達到 10.3 億美元,到 2035 年將達到 291.5 億美元,年複合成長率為 39%。
隨著進階駕駛輔助系統 (ADAS) 和自動駕駛技術全面進入量產階段,車輛設計和檢驗方式正在發生根本性轉變,而人工智慧驅動的模擬和合成資料工具正成為日益複雜的汽車軟體虛擬開發、大規模人工智慧訓練和安全檢驗的核心基礎技術。這些平台使製造商和供應商能夠在受控環境中數位化地模擬大量的駕駛場景、感測器互動和環境變量,從而顯著減少對成本高且耗時的物理測試的依賴。市場也受惠於整個生態系統內日益密切的合作,汽車製造商、一級供應商、雲端基礎設施供應商和模擬軟體供應商攜手合作,簡化開發流程。以模擬為先的開發模式現已廣泛應用於自動駕駛和 ADAS 專案中,整合解決方案有助於降低工程複雜性、提高模型精度並降低整車開發成本。
| 市場覆蓋範圍 | |
|---|---|
| 開始年份 | 2025 |
| 預測年份 | 2026-2035 |
| 起始值 | 10.3億美元 |
| 預測金額 | 291.5億美元 |
| 複合年成長率 | 39% |
預計到2025年,軟體領域將佔據65%的市場佔有率,並在2035年之前以38.5%的複合年成長率成長。這一主導地位反映了產業加速向軟體定義車輛轉型的趨勢,在這種模式下,核心駕駛智慧的建構、測試和改進不再依賴實體原型,而是透過數位環境進行。模擬軟體能夠對車輛行為、感測器性能和交通動態進行廣泛的虛擬測試,從而可以高效且反覆地評估數百萬種應用場景。
預計到2025年,本地部署方案將佔據57%的市場佔有率,並在2026年至2035年間以37.9%的複合年成長率成長。這一趨勢的驅動力源於對資料隱私、智慧財產權保護以及汽車安全和網路安全框架合規性的嚴格要求。汽車製造商和一級供應商管理著高度敏感的車輛系統、感知邏輯和專有資料集,這些通常受到外部環境的限制。本地部署基礎設施能夠提供對資料、模擬資產和人工智慧工作流程的完全所有權和管治,同時符合內部安全和監管標準。
預計到2025年,北美汽車人工智慧模擬和合成數據生成市場將佔據85%的市場佔有率,市場規模達3.283億美元。該地區的成長主要得益於對自動駕駛和高級駕駛輔助系統(ADAS)技術的大力投資,以及對安全檢驗和法規遵循日益成長的期望。隨著企業尋求在確保系統效能高度可靠的同時,盡可能減少實體測試,基於場景的模擬和虛擬測試的應用正在加速發展。
目錄
第1章調查方法
第2章執行摘要
第3章業界考察
- 生態系分析
- 供應商情況
- 利潤率分析
- 成本結構
- 每個階段的附加價值
- 影響價值鏈的因素
- 中斷
- 產業影響因素
- 促進要素
- 對高級駕駛輔助系統(ADAS)和自動駕駛汽車開發的需求不斷成長
- 車輛軟體系統日益複雜
- 對虛擬檢驗和基於場景的測試的需求激增
- 人工智慧/機器學習在感測器融合和感知系統中的應用日益廣泛
- 產業潛在風險與挑戰
- 高昂的初始投資成本
- 模擬工具複雜度
- 市場機遇
- 基於雲端的仿真即服務模式的成長
- 對經認證的虛擬檢驗框架的需求日益成長
- 車輛開發中數位雙胞胎的應用日益廣泛
- 將模擬應用擴展到乘用車以外領域
- 促進要素
- 成長潛力分析
- 監管環境
- 北美洲
- 美國:NHTSA自動駕駛系統引導與自動駕駛車輛測試舉措
- 歐洲
- 歐盟:聯合國歐洲經濟委員會第R157號條例(ALKS)
- 德國:自動駕駛法
- 英國:互聯與自動駕駛(CAM)法規
- 法國:自動駕駛車輛實驗框架
- 亞太地區
- 中國:智慧網連網汽車(ICV)模擬標準
- 日本:國土交通省自動駕駛安全指南
- 韓國:自動駕駛汽車法
- 新加坡:自動駕駛車輛安全評估框架
- 拉丁美洲
- 巴西:國家智慧交通與物聯網策略
- 墨西哥:智慧運輸和自動駕駛汽車試點法規
- 智利:智慧型運輸系統(ITS)政策
- 中東和非洲
- 阿拉伯聯合大公國:杜拜自動駕駛交通戰略
- 沙烏地阿拉伯:2030願景智慧運輸框架
- 南非:綠色交通與自動駕駛政策
- 北美洲
- 波特五力分析
- PESTEL 分析
- 科技與創新趨勢
- 當前技術趨勢
- 新興技術
- 專利分析
- 永續性和環境影響分析
- 永續實踐
- 減少廢棄物策略
- 生產中的能源效率
- 環保舉措
- 碳足跡考量
- 未來前景與機遇
- OEM實施框架
- 評估與策略
- 基礎設施建設
- 試驗計畫
- 整合與擴張
- 最佳化和改進
- 成功的關鍵要素
- 常見陷阱及解決方法
- 使用案例和應用場景
- 都市區自動駕駛模擬
- 高速公路自動駕駛和卡車編隊行駛
- 用於安全測試的極端情況生成
- 用於訓練感知模型的合成數據
- 駕駛員監控系統檢驗
- V2X通訊仿真
- 在寒冷地區和極端環境下進行測試
- 停車和低速行駛
第4章 競爭情勢
- 介紹
- 公司市佔率分析
- 主要市場公司的競爭分析
- 競爭定位矩陣
- 戰略展望矩陣
- 重大進展
- 併購
- 夥伴關係與合作
- 新產品發布
- 企業擴張計畫和資金籌措
第5章 依產品類型分類的市場估算與預測,2022-2035年
- 軟體
- 服務
6. 按模擬類型分類的市場估算與預測,2022-2035 年
- 感測器仿真
- 場景生成
- 車輛動力學
- HIL/SIL 測試
7. 基於綜合資料的市場估算與預測,2022-2035年
- 圖片和影片
- 表格形式
- 時間序列
- 其他
第8章 按應用領域分類的市場估算與預測,2022-2035年
- ADAS測試
- 自動駕駛汽車的研發
- 人工智慧/機器學習模型訓練
- 安全與合規
- 設計檢驗
9. 依最終用途分類的市場估計與預測,2022-2035 年
- OEM
- 一級供應商
- 科技公司
- 研究所
第10章 依實施類型分類的市場估計與預測,2022-2035年
- 本地部署
- 基於雲端的
- 混合
第11章 依車輛類型分類的市場估價與預測,2022-2035年
- 搭乘用車
- 轎車
- 掀背車
- SUV
- 商用車輛
- 輕型商用車(LCV)
- MCV
- 重型商用車(HCV)
第12章 2022-2035年各地區市場估算與預測
- 北美洲
- 美國
- 加拿大
- 歐洲
- 德國
- 英國
- 法國
- 義大利
- 西班牙
- 俄羅斯
- 比利時
- 荷蘭
- 瑞典
- 亞太地區
- 中國
- 印度
- 日本
- 澳洲
- 韓國
- 菲律賓
- 印尼
- 新加坡
- 拉丁美洲
- 巴西
- 墨西哥
- 阿根廷
- 中東和非洲
- 南非
- 沙烏地阿拉伯
- 阿拉伯聯合大公國
第13章:公司簡介
- 世界公司
- Altair Engineering
- Ansys
- Autodesk
- Dassault Systemes
- IBM
- MSC Software(Hexagon)
- NVIDIA
- PTC
- Siemens
- Synopsys
- The MathWorks
- 當地公司
- AVL List
- AVSimulation
- dSPACE
- ESI Group(Keysight)
- IPG Automotive
- SIMUL8
- 新興企業
- Anyverse
- Applied Intuition
- Cognata
- Foretellix
- Mechanical Simulation
- MOOG
- Parallel Domain
- SimScale
The Global Automotive AI Simulation & Synthetic Data Generation Market was valued at USD 1.03 billion in 2025 and is estimated to grow at a CAGR of 39% to reach USD 29.15 billion by 2035.
The rapid expansion reflects a fundamental transformation in how vehicles are designed and validated as advanced driver assistance systems and autonomous technologies move deeper into production. AI-driven simulation and synthetic data tools are becoming core enablers of virtual development, large-scale AI training, and safety validation for increasingly complex automotive software. These platforms allow manufacturers and suppliers to digitally replicate massive volumes of driving scenarios, sensor interactions, and environmental variables in controlled settings, significantly reducing dependence on costly and time-intensive real-world testing. The market is also benefiting from growing collaboration across the ecosystem, as vehicle manufacturers, Tier-1 suppliers, cloud and infrastructure providers, and simulation software vendors align to streamline development workflows. Sim-first development models are now widely embedded into autonomous and ADAS programs, while integrated solutions are helping reduce engineering complexity, improve model accuracy, and lower overall vehicle development costs.
| Market Scope | |
|---|---|
| Start Year | 2025 |
| Forecast Year | 2026-2035 |
| Start Value | $1.03 Billion |
| Forecast Value | $29.15 Billion |
| CAGR | 39% |
The software segment accounted for 65% share in 2025 and is forecast to grow at a CAGR of 38.5% through 2035. This dominance reflects the industry's accelerated transition toward software-defined vehicles, where core driving intelligence is built, tested, and refined through digital environments rather than physical prototypes. Simulation software enables extensive virtual testing of vehicle behavior, sensor performance, and traffic dynamics, allowing millions of use cases to be evaluated efficiently and repeatedly.
The on-premises segment held 57% share in 2025 and is expected to grow at a CAGR of 37.9% from 2026 to 2035. This preference is driven by strict requirements around data privacy, intellectual property protection, and compliance with automotive safety and cybersecurity frameworks. Automotive manufacturers and Tier-1 suppliers manage highly confidential vehicle systems, perception logic, and proprietary datasets that are often restricted from external environments. On-premises infrastructure provides full ownership and governance over data, simulation assets, and AI workflows while aligning with internal security and regulatory standards.
North America Automotive AI Simulation & Synthetic Data Generation Market held 85% share and generated USD 328.3 million in 2025. Growth in the country is being fueled by strong investment in autonomous and ADAS technologies, alongside rising expectations for safety validation and regulatory readiness. The adoption of scenario-based simulation and virtual testing is accelerating as organizations seek to limit physical testing while maintaining high confidence in system performance.
Key companies active in the Global Automotive AI Simulation & Synthetic Data Generation Market include NVIDIA, Siemens, Dassault Systemes, Ansys, The MathWorks, dSPACE, Altair Engineering, PTC, Autodesk, and ESI Group. Leading companies in the Automotive AI simulation and synthetic data generation market are strengthening their positions through platform integration, strategic partnerships, and continuous innovation. Many vendors are expanding end-to-end simulation ecosystems that combine scenario creation, sensor modeling, AI validation, and regression testing into unified offerings. Collaboration with OEMs and Tier-1 suppliers is being used to tailor solutions to real-world development needs and accelerate adoption.
Table of Contents
Chapter 1 Methodology
- 1.1 Research approach
- 1.2 Quality commitments
- 1.2.1 GMI AI policy & data integrity commitment
- 1.3 Research trail & confidence scoring
- 1.3.1 Research trail components
- 1.3.2 Scoring components
- 1.4 Data collection
- 1.4.1 Partial list of primary sources
- 1.5 Data mining sources
- 1.5.1 Paid sources
- 1.6 Base estimates and calculations
- 1.6.1 Base year calculation
- 1.7 Forecast model
- 1.8 Research transparency addendum
Chapter 2 Executive Summary
- 2.1 Industry 3600 synopsis, 2022 - 2035
- 2.2 Key market trends
- 2.2.1 Regional
- 2.2.2 Offering
- 2.2.3 Simulation type
- 2.2.4 Synthetic data type
- 2.2.5 Application
- 2.2.6 End use
- 2.2.7 Deployment mode
- 2.2.8 Vehicle
- 2.3 TAM Analysis, 2026-2035
- 2.4 CXO perspectives: Strategic imperatives
- 2.4.1 Executive decision points
- 2.4.2 Critical success factors
- 2.5 Future outlook and strategic recommendations
Chapter 3 Industry Insights
- 3.1 Industry ecosystem analysis
- 3.1.1 Supplier landscape
- 3.1.2 Profit margin analysis
- 3.1.3 Cost structure
- 3.1.4 Value addition at each stage
- 3.1.5 Factor affecting the value chain
- 3.1.6 Disruptions
- 3.2 Industry impact forces
- 3.2.1 Growth drivers
- 3.2.1.1 Increasing demand for ADAS & autonomous vehicle development
- 3.2.1.2 Rising complexity of vehicle software systems
- 3.2.1.3 Surge in demand for virtual validation and scenario-based testing
- 3.2.1.4 Increase in AI/ML adoption for sensor fusion and perception systems
- 3.2.2 Industry pitfalls and challenges
- 3.2.2.1 High initial investment costs
- 3.2.2.2 Complexity of simulation tools
- 3.2.3 Market opportunities
- 3.2.3.1 Growth in cloud-based simulation-as-a-service models
- 3.2.3.2 Increase in demand for certified virtual validation frameworks
- 3.2.3.3 Rise in digital twin adoption for vehicle development
- 3.2.3.4 Expansion of simulation use beyond passenger vehicles
- 3.2.1 Growth drivers
- 3.3 Growth potential analysis
- 3.4 Regulatory landscape
- 3.4.1 North America
- 3.4.1.1 United States: NHTSA ADS Guidance & AV TEST Initiative.
- 3.4.2 Europe
- 3.4.2.1 European Union: UNECE Regulation R157 (ALKS)
- 3.4.2.2 Germany: Autonomous Driving Act
- 3.4.2.3 United Kingdom: Connected and Automated Mobility (CAM) Regulations
- 3.4.2.4 France: Autonomous Vehicle Experimentation Framework
- 3.4.3 Asia Pacific
- 3.4.3.1 China: Intelligent Connected Vehicle (ICV) Simulation Standards
- 3.4.3.2 Japan: MLIT Automated Driving Safety Guidelines
- 3.4.3.3 South Korea: Autonomous Vehicle Act
- 3.4.3.4 Singapore: Autonomous Vehicle Safety Assessment Framework
- 3.4.4 Latin America
- 3.4.4.1 Brazil: National Intelligent Mobility & IoT Strategy
- 3.4.4.2 Mexico: Smart Mobility & AV Pilot Regulations
- 3.4.4.3 Chile: Intelligent Transport Systems (ITS) Policy
- 3.4.5 MEA
- 3.4.5.1 United Arab Emirates: Dubai Autonomous Transport Strategy
- 3.4.5.2 Saudi Arabia: Vision 2030 Smart Mobility Framework
- 3.4.5.3 South Africa: Green Transport & Automated Mobility Policy
- 3.4.1 North America
- 3.5 Porter's analysis
- 3.6 PESTEL analysis
- 3.7 Technology and Innovation landscape
- 3.7.1 Current technological trends
- 3.7.2 Emerging technologies
- 3.8 Patent analysis
- 3.9 Sustainability and environmental impact analysis
- 3.9.1 Sustainable practices
- 3.9.2 Waste reduction strategies
- 3.9.3 Energy efficiency in production
- 3.9.4 Eco-friendly initiatives
- 3.9.5 Carbon footprint considerations
- 3.10 Future outlook & opportunities
- 3.11 OEM implementation framework
- 3.11.1 Assessment & strategy
- 3.11.2 Infrastructure setup
- 3.11.3 Pilot program
- 3.11.4 Integration & scaling
- 3.11.5 Optimization & expansion
- 3.11.6 Critical success factors
- 3.11.7 Common pitfalls & mitigation
- 3.12 Use Cases & application scenarios
- 3.12.1 Urban autonomous driving simulation
- 3.12.2 Highway autopilot & truck platooning
- 3.12.3 Edge case generation for safety testing
- 3.12.4 Synthetic data for perception model training
- 3.12.5 Driver monitoring system validation
- 3.12.6. V2X communication simulation
- 3.12.7 Cold weather & extreme climate testing
- 3.12.8 Parking & low-speed maneuvering
Chapter 4 Competitive Landscape, 2025
- 4.1 Introduction
- 4.2 Company market share analysis
- 4.2.1 North America
- 4.2.2 Europe
- 4.2.3 Asia Pacific
- 4.2.4 Latin America
- 4.2.5 MEA
- 4.3 Competitive analysis of major market players
- 4.4 Competitive positioning matrix
- 4.5 Strategic outlook matrix
- 4.6 Key developments
- 4.6.1 Mergers & acquisitions
- 4.6.2 Partnerships & collaborations
- 4.6.3 New Product Launches
- 4.6.4 Expansion Plans and funding
Chapter 5 Market Estimates & Forecast, By Offering, 2022 - 2035 ($Bn)
- 5.1 Key trends
- 5.2 Software
- 5.3 Services
Chapter 6 Market Estimates & Forecast, By Simulation Type, 2022 - 2035 ($Bn)
- 6.1 Key trends
- 6.2 Sensor Simulation
- 6.3 Scenario Generation
- 6.4 Vehicle Dynamics
- 6.5 HIL/SIL Testing
Chapter 7 Market Estimates & Forecast, By Synthetic Data, 2022 - 2035 ($Bn)
- 7.1 Key trends
- 7.2 Image & Video
- 7.3 Tabular
- 7.4 Time-Series
- 7.5 Others
Chapter 8 Market Estimates & Forecast, By Application, 2022 - 2035 ($Bn)
- 8.1 Key trends
- 8.2 ADAS Testing
- 8.3 Autonomous Vehicle Development
- 8.4 AI/ML Model Training
- 8.5 Safety & Compliance
- 8.6 Design Validation
Chapter 9 Market Estimates & Forecast, By End Use, 2022 - 2035 ($Bn)
- 9.1 Key trends
- 9.2 OEMs
- 9.3 Tier 1 Suppliers
- 9.4 Technology Companies
- 9.5 Research Institutions
Chapter 10 Market Estimates & Forecast, By Deployment Mode, 2022 - 2035 ($Bn)
- 10.1 Key trends
- 10.2 On-Premises
- 10.3 Cloud-Based
- 10.4 Hybrid
Chapter 11 Market Estimates & Forecast, By Vehicle, 2022 - 2035 ($Bn)
- 11.1 Key trends
- 11.2 Passenger vehicle
- 11.2.1 Sedan
- 11.2.2 Hatchback
- 11.2.3 SUV
- 11.3 Commercial vehicle
- 11.3.1 LCV
- 11.3.2 MCV
- 11.3.3 HCV
Chapter 12 Market Estimates & Forecast, By Region, 2022 - 2035 ($Bn, Units)
- 12.1 Key trends
- 12.2 North America
- 12.2.1 US
- 12.2.2 Canada
- 12.3 Europe
- 12.3.1 Germany
- 12.3.2 UK
- 12.3.3 France
- 12.3.4 Italy
- 12.3.5 Spain
- 12.3.6 Russia
- 12.3.7 Belgium
- 12.3.8 Netherlands
- 12.3.9 Sweden
- 12.4 Asia Pacific
- 12.4.1 China
- 12.4.2 India
- 12.4.3 Japan
- 12.4.4 Australia
- 12.4.5 South Korea
- 12.4.6 Philippines
- 12.4.7 Indonesia
- 12.4.8 Singapore
- 12.5 Latin America
- 12.5.1 Brazil
- 12.5.2 Mexico
- 12.5.3 Argentina
- 12.6 MEA
- 12.6.1 South Africa
- 12.6.2 Saudi Arabia
- 12.6.3 UAE
Chapter 13 Company Profiles
- 13.1 Global Players
- 13.1.1 Altair Engineering
- 13.1.2 Ansys
- 13.1.3 Autodesk
- 13.1.4 Dassault Systemes
- 13.1.5 IBM
- 13.1.6 MSC Software (Hexagon)
- 13.1.7 NVIDIA
- 13.1.8 PTC
- 13.1.9 Siemens
- 13.1.10 Synopsys
- 13.1.11 The MathWorks
- 13.2 Regional Players
- 13.2.1 AVL List
- 13.2.2 AVSimulation
- 13.2.3 dSPACE
- 13.2.4 ESI Group (Keysight)
- 13.2.5 IPG Automotive
- 13.2.6 SIMUL8
- 13.3 Emerging Players
- 13.3.1 Anyverse
- 13.3.2 Applied Intuition
- 13.3.3 Cognata
- 13.3.4 Foretellix
- 13.3.5 Mechanical Simulation
- 13.3.6 MOOG
- 13.3.7 Parallel Domain
- 13.3.8 SimScale
 2026-2030年全球人工智慧模擬市場
 2026-2030年全球封閉式源平台模型市場
 汽車人工智慧市場:2026-2032年全球市場預測(按交付方式、核心技術、車輛類型、應用和最終用戶分類)
 汽車人工智慧處理器市場預測至2034年——按處理器類型、車輛類型、部署等級、應用和地區分類的全球分析
 汽車技術研究展望:2025
 汽車人工智慧市場報告:按組件、技術、工藝、應用和地區分類(2026-2034 年)
 遙感器市場報告:趨勢、預測及競爭分析(至2035年)
 2026年全球汽車元宇宙宇宙市場報告2026年全球汽車與交通運輸人工智慧市場報告2026年全球車載人工智慧助理市場報告