


 |
市場調查報告書
商品編碼
1913376
貨車市場:市場機會、成長促進因素、產業趨勢分析及預測(2026-2035)Cargo Vans Market Opportunity, Growth Drivers, Industry Trend Analysis, and Forecast 2026 - 2035 |
||||||
全球貨車市場預計到 2025 年價值 927 億美元,到 2035 年將達到 1,529 億美元,年複合成長率為 5.1%。
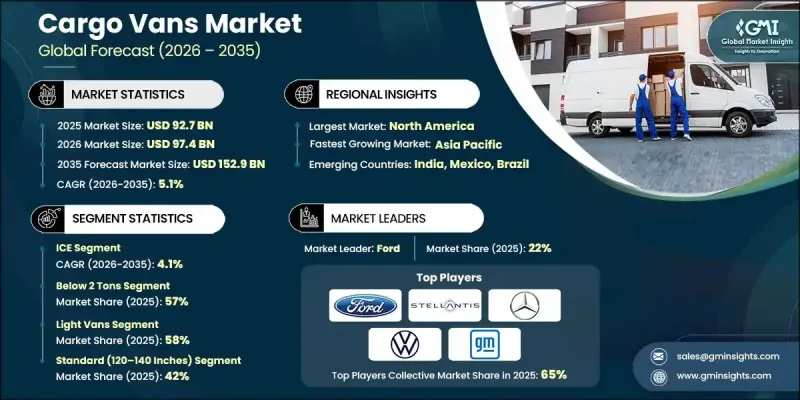
都市區物流活動的穩定成長以及全球對高效商務傳輸解決方案日益成長的需求,是推動市場擴張的主要動力。電子商務平台、零售分銷網路和服務業的快速發展,顯著提升了都市區和郊區對貨車運輸的需求。小包裹量的增加和車輛正常運作的延長,促使物流業者投資可靠且經濟高效的車輛。同時,提高燃油效率和減少排放氣體的監管壓力,也影響車輛的更新換代週期,促使營運商引進性能更佳、營運成本更低的新型貨車。車輛設計、動力傳動系統技術和耐用性的不斷進步,進一步提升了貨車的可靠性和運作。隨著城市不斷擴張,最後一公里配送的重要性日益凸顯,貨車已成為現代交通物流生態系統中不可或缺的關鍵組成部分,支撐著各地區市場的持續成長。
| 市場覆蓋範圍 | |
|---|---|
| 開始年份 | 2025 |
| 預測期 | 2026-2035 |
| 初始市場規模 | 927億美元 |
| 市場規模預測 | 1529億美元 |
| 複合年成長率 | 5.1% |
預計到2025年,載重小於2噸的貨車市佔率將達到57.4%,並在2026年至2035年間以4.7%的複合年成長率成長。該負載容量級別的貨車因其機動性強、效率高、載貨能力充足,被廣泛用於最後一公里配送和服務運營。它們能夠在滿足日常配送需求的同時,在人口密集的城市環境中高效運作,這也持續支撐著它們的高普及率。
到2025年,軸距在120至140英吋之間的標準貨車將佔據42%的市場。這些車輛兼具良好的載貨空間和操控性,因此在區域和多點配送路線中廣受歡迎。這種配置有助於物流營運商有效規劃路線並最大限度地提高車隊運轉率。
預計到 2025 年,美國貨車市場將佔據 88.5% 的市場佔有率,市場規模將達到 265 億美元。物流、履約和酒店業的快速擴張正在推動需求,促使企業對其商用車輛車隊進行現代化改造和擴充。
目錄
第1章:分析方法和範圍
第2章執行摘要
第3章業界考察
- 產業生態系分析
- 供應商情況
- 利潤率分析
- 成本結構
- 每個階段的附加價值
- 影響價值鏈的因素
- 中斷
- 產業影響因素
- 促進要素
- 城市物流和最後一公里配送的成長
- 電子商務與有組織零售業的興起
- 車隊更新和效率提升
- 引入替代動力傳動系統
- 產業潛在風險與挑戰
- 高額的車輛購置成本
- 都市區擁擠和停車位有限
- 市場機遇
- 商用車電氣化
- 低溫運輸和特種物流領域的成長
- 在新興市場拓展業務
- 促進要素
- 成長潛力分析
- 監管環境
- 北美洲
- 聯邦汽車運輸安全管理局 (FMCSA) 法規
- 美國環保署(EPA)排放標準
- 加州空氣資源委員會(CARB)法規
- 歐洲
- 歐盟商用車法規
- 歐6排放氣體法規
- 通用安全規程 (GSR)
- 歐盟型式認可框架
- 數位式行車記錄器法規
- 低排放區(LEZ)和零排放區(ZEZ)
- 亞太地區
- 中國第六國排放氣體控制標準
- 印度汽車標準(AIS)
- 日本的燃油效率標準
- 東協汽車法規
- 大型和中型車輛法規
- 拉丁美洲
- 巴西Proconve排放氣體標準
- 阿根廷的燃油經濟性(CAFE)和安全標準
- 墨西哥NOM標準
- 根據美國墨加協定(USMCA)協調車輛法規
- 中東和非洲
- 阿拉伯聯合大公國聯邦交通法
- 沙烏地阿拉伯運輸和物流法規
- 南非道路交通法
- 東非共同體(EAC)車輛法規
- 北美洲
- 波特五力分析
- PESTEL 分析
- 科技與創新趨勢
- 當前技術趨勢
- 新興技術
- 價格趨勢
- 按地區
- 依產品
- 生產統計
- 生產基地
- 消費基礎
- 進出口
- 成本細分分析
- 車輛購置成本
- 運輸和配送成本
- 營運和維護成本
- 監理和合規成本
- 燃料和能源成本
- 專利分析
- 永續性和環境方面
- 永續實踐
- 減少廢棄物策略
- 生產中的能源效率
- 環保舉措
- 碳足跡考量
- 打入市場策略
- 區域市場滲透策略
- 新參與企業需要考慮的關鍵監管因素
- 定價、服務和差異化策略
第4章 競爭情勢
- 介紹
- 公司市佔率分析
- 按地區
- 北美洲
- 歐洲
- 亞太地區
- 拉丁美洲
- 中東和非洲
- 按地區
- 主要企業的競爭分析
- 競爭定位矩陣
- 戰略展望矩陣
- 主要趨勢
- 企業合併(M&A)
- 夥伴關係與合作
- 新產品發布
- 企業擴張計畫和資金籌措
第5章 依促進因素分類的市場估算與預測(2022-2035 年)
- 內燃機(ICE)
- 電的
- 電池式電動車(BEV)
- 混合動力汽車(HEV)
- 插電式混合動力汽車(PHEV)
第6章 依負載容量的市場估計與預測(2022-2035 年)
- 不足2噸
- 2至3噸
- 超過3噸
第7章 按車輛類型分類的市場估計和預測(2022-2035 年)
- 小型貨車(1-2 類)
- 中型廂型車(3級)
- 大型/廂型車(4-6級)
第8章 按軸距和尺寸分類的市場估算和預測(2022-2035 年)
- 緊湊型(軸距小於120吋)
- 標準型(120-140吋)
- 延伸部分(140-160吋)
- 超長(超過 160 吋)
第9章 按商業應用分類的市場估算與預測(2022-2035 年)
- 最後一公里配送
- 宅配/小包裹
- 現場服務
- 其他
第10章 依銷售管道分類的市場估計與預測(2022-2035 年)
- OEM
- 授權經銷商網路
第11章 各地區市場估計與預測(2022-2035 年)
- 北美洲
- 美國
- 加拿大
- 歐洲
- 德國
- 英國
- 法國
- 義大利
- 西班牙
- 俄羅斯
- 北歐國家
- 荷蘭
- 瑞典
- 亞太地區
- 中國
- 印度
- 日本
- 澳洲
- 韓國
- 新加坡
- 泰國
- 印尼
- 越南
- 拉丁美洲
- 巴西
- 墨西哥
- 阿根廷
- 中東和非洲
- 南非
- 沙烏地阿拉伯
- 阿拉伯聯合大公國
- 土耳其
第12章:公司簡介
- 世界公司
- Ford
- General Motors
- Hyundai/Kia
- Mercedes-Benz Vans
- Nissan
- Renault Group
- SAIC
- Stellantis
- Toyota
- Volkswagen
- 本地公司
- BYD
- Changan Automobile
- Dongfeng Motor Corporation
- GAC Group
- Isuzu Motors
- Iveco
- 新興企業/顛覆者
- Arrival
- Greenkraft
- Rivian
- Workhorse Group
The Global Cargo Vans Market was valued at USD 92.7 billion in 2025 and is estimated to grow at a CAGR of 5.1% to reach USD 152.9 billion by 2035.
Market expansion is driven by the steady rise in urban logistics activities and increasing demand for efficient commercial transportation solutions worldwide. The rapid growth of e-commerce platforms, retail distribution networks, and service-based industries is significantly increasing the need for cargo vans to support goods movement across both urban and semi-urban areas. Rising parcel volumes and extended fleet utilization are encouraging logistics providers to invest in reliable and cost-efficient vehicles. At the same time, regulatory pressure to improve fuel efficiency and reduce emissions is influencing fleet replacement cycles, pushing operators toward newer cargo van models with enhanced performance and lower operating expenses. Continuous advancements in vehicle design, drivetrain technologies, and durability are further improving the reliability and operational lifespan of cargo vans. As cities continue to expand and last-mile delivery becomes increasingly critical, cargo vans are emerging as a vital component of modern transportation and distribution ecosystems, supporting sustained market growth across regions.
| Market Scope | |
|---|---|
| Start Year | 2025 |
| Forecast Year | 2026-2035 |
| Start Value | $92.7 Billion |
| Forecast Value | $152.9 Billion |
| CAGR | 5.1% |
The below 2 tons segment accounted for a 57.4% share in 2025 and is expected to grow at a CAGR of 4.7% from 2026 to 2035. Cargo vans within this payload category are widely preferred for last-mile deliveries and service operations due to their maneuverability, efficiency, and adequate load capacity. Their ability to operate efficiently in dense urban settings while meeting daily delivery requirements continues to support strong adoption.
The standard cargo vans with a wheelbase ranging between 120 and 140 inches held a 42% share in 2025. These vehicles are extensively used for regional distribution and multi-stop delivery routes, as they offer an optimal balance between cargo space and ease of navigation. Their configuration supports efficient route planning and maximized fleet utilization for logistics operators.
United States Cargo Vans Market held 88.5% share, generating USD 26.5 billion in 2025. Strong demand is being driven by the rapid expansion of logistics, e-commerce fulfillment, and service-oriented businesses, prompting companies to modernize and expand their commercial vehicle fleets.
Key companies operating in the Global Cargo Vans Market include Ford, Toyota, Volkswagen, Stellantis, Mercedes-Benz Vans, General Motors, Hyundai/Kia, Rivian, SAIC through its Maxus and LDV brands, and the Shyft Group. Companies in the Global Cargo Vans Market are reinforcing their competitive position by focusing on product innovation, efficiency improvements, and portfolio diversification. Manufacturers are investing in advanced powertrain technologies and lightweight vehicle designs to meet evolving regulatory requirements and reduce the total cost of ownership for fleet operators. Strategic partnerships with logistics providers and fleet customers are being leveraged to secure long-term contracts and stable demand. Many players are also expanding manufacturing capabilities and regional footprints to improve supply chain resilience and delivery timelines.
Table of Contents
Chapter 1 Methodology
- 1.1 Market scope and definition
- 1.2 Research design
- 1.2.1 Research approach
- 1.2.2 Data collection methods
- 1.3 Data mining sources
- 1.3.1 Global
- 1.3.2 Regional/Country
- 1.4 Base estimates and calculations
- 1.4.1 Base year calculation
- 1.4.2 Key trends for market estimation
- 1.5 Primary research and validation
- 1.5.1 Primary sources
- 1.6 Forecast model
- 1.7 Research assumptions and limitations
Chapter 2 Executive Summary
- 2.1 Industry 3600 synopsis, 2022 - 2035
- 2.2 Key market trends
- 2.2.1 Regional
- 2.2.2 Propulsion
- 2.2.3 Tonnage Capacity
- 2.2.4 Vehicle Class
- 2.2.5 Wheelbase & Size
- 2.2.6 Commercial End Use
- 2.2.7 Sales Channel
- 2.3 TAM Analysis, 2026-2035
- 2.4 CXO perspectives: Strategic imperatives
- 2.4.1 Executive decision points
- 2.4.2 Critical success factors
- 2.5 Future outlook and strategic recommendations
Chapter 3 Industry Insights
- 3.1 Industry ecosystem analysis
- 3.1.1 Supplier landscape
- 3.1.2 Profit margin analysis
- 3.1.3 Cost structure
- 3.1.4 Value addition at each stage
- 3.1.5 Factor affecting the value chain
- 3.1.6 Disruptions
- 3.2 Industry impact forces
- 3.2.1.1 Growth drivers
- 3.2.1.2 Growth of urban logistics and last mile delivery
- 3.2.1.3 Expansion of e commerce and organized retail
- 3.2.1.4 Fleet renewal and efficiency improvement
- 3.2.1.5 Adoption of alternative powertrains
- 3.2.2 Industry pitfalls and challenges
- 3.2.2.1 High vehicle acquisition costs
- 3.2.2.2 Urban congestion and parking limitations
- 3.2.3 Market opportunities
- 3.2.3.1 Electrification of commercial fleets
- 3.2.3.2 Growth in cold chain and specialized logistics
- 3.2.3.3 Expansion in emerging markets
- 3.3 Growth potential analysis
- 3.4 Regulatory landscape
- 3.4.1 North America
- 3.4.1.1 Federal Motor Carrier Safety Administration (FMCSA) Regulations
- 3.4.1.2 Environmental Protection Agency (EPA) Emission Standards
- 3.4.1.3 California Air Resources Board (CARB) Regulations
- 3.4.2 Europe
- 3.4.2.1 EU Commercial Vehicle Regulations
- 3.4.2.2 Euro 6 Emission Standards
- 3.4.2.3 General Safety Regulation (GSR)
- 3.4.2.4 EU Type Approval Framework
- 3.4.2.5 Digital Tachograph Rules
- 3.4.2.6 Low Emission Zones (LEZ) and Zero Emission Zones (ZEZ)
- 3.4.3 Asia Pacific
- 3.4.3.1 China National VI Emission Standards
- 3.4.3.2 India Automotive Industry Standards (AIS)
- 3.4.3.3 Japan Fuel Economy Standards
- 3.4.3.4 ASEAN Automotive Regulations
- 3.4.3.5 Heavy and Medium Duty Vehicle Regulations
- 3.4.4 Latin America
- 3.4.4.1 Brazil Proconve Emission Standards
- 3.4.4.2 Argentina CAFE and Safety Standards
- 3.4.4.3 Mexico NOM Standards
- 3.4.4.4 USMCA Vehicle Regulatory Alignment
- 3.4.5 Middle East & Africa
- 3.4.5.1 UAE Federal Transport Law
- 3.4.5.2 Saudi Transport and Logistics Regulations
- 3.4.5.3 South African Road Traffic Act
- 3.4.5.4 East African Community (EAC) Vehicle Regulations
- 3.4.1 North America
- 3.5 Porter's analysis
- 3.6 PESTEL analysis
- 3.7 Technology and innovation landscape
- 3.7.1 Current technological trends
- 3.7.2 Emerging technologies
- 3.8 Price trends
- 3.8.1 By region
- 3.8.2 By product
- 3.9 Production statistics
- 3.9.1 Production hubs
- 3.9.2 Consumption hubs
- 3.9.3 Export and import
- 3.10 Cost breakdown analysis
- 3.10.1 Vehicle acquisition costs
- 3.10.2 Transportation and delivery costs
- 3.10.3 Operational and maintenance costs
- 3.10.4 Regulatory and compliance costs
- 3.10.5 Fuel and energy costs
- 3.11 Patent analysis
- 3.12 Sustainability and environmental aspects
- 3.12.1 Sustainable practices
- 3.12.2 Waste reduction strategies
- 3.12.3 Energy efficiency in production
- 3.12.4 Eco-friendly Initiatives
- 3.12.5 Carbon footprint considerations
- 3.13 Go-to-Market strategies
- 3.13.1 Region-specific market penetration strategies
- 3.13.2 Key regulatory considerations for new entrants
- 3.13.3 Pricing, service, and differentiation strategies
Chapter 4 Competitive Landscape, 2025
- 4.1 Introduction
- 4.2 Company market share analysis
- 4.2.1 North America
- 4.2.2 Europe
- 4.2.3 Asia Pacific
- 4.2.4 LATAM
- 4.2.5 MEA
- 4.3 Competitive analysis of major market players
- 4.4 Competitive positioning matrix
- 4.5 Strategic outlook matrix
- 4.6 Key developments
- 4.6.1 Mergers & acquisitions
- 4.6.2 Partnerships & collaborations
- 4.6.3 New Product Launches
- 4.6.4 Expansion Plans and funding
Chapter 5 Market Estimates & Forecast, By Propulsion, 2022 - 2035 ($Bn, Units)
- 5.1 Key trends
- 5.2 ICE
- 5.3 Electric
- 5.3.1 Battery Electric Vehicle (BEV)
- 5.3.2 Hybrid Electric Vehicle (HEV)
- 5.3.3 Plug-in Hybrid Electric Vehicle (PHEV)
Chapter 6 Market Estimates & Forecast, By Tonnage Capacity, 2022 - 2035 ($Bn, Units)
- 6.1 Key trends
- 6.2 Below 2 tons
- 6.3 2 to 3 tons
- 6.4 Above 3 tons
Chapter 7 Market Estimates & Forecast, By Vehicle Class, 2022 - 2035 ($Bn, Units)
- 7.1 Key trends
- 7.2 Light vans (Class 1-2)
- 7.3 Medium vans (Class 3)
- 7.4 Heavy/step vans (Class 4-6)
Chapter 8 Market Estimates & Forecast, By Wheelbase & Size, 2022 - 2035 ($Bn, Units)
- 8.1 Key trends
- 8.2 Compact (wheelbase <120 inches)
- 8.3 Standard (120-140 inches)
- 8.4 Extended (140-160 inches)
- 8.5 Extra-long (>160 inches)
Chapter 9 Market Estimates & Forecast, By Commercial End Use, 2022 - 2035 ($Bn, Units)
- 9.1 Key trends
- 9.2 Last-mile delivery
- 9.3 Courier/parcel
- 9.4 Field services
- 9.5 Others
Chapter 10 Market Estimates & Forecast, By Sales Channel, 2022 - 2035 ($Bn, Units)
- 10.1 Key trends
- 10.2 OEM
- 10.3 Authorized dealership networks
Chapter 11 Market Estimates & Forecast, By Region, 2022 - 2035 ($Bn, Units)
- 11.1 Key trends
- 11.2 North America
- 11.2.1 US
- 11.2.2 Canada
- 11.3 Europe
- 11.3.1 Germany
- 11.3.2 UK
- 11.3.3 France
- 11.3.4 Italy
- 11.3.5 Spain
- 11.3.6 Russia
- 11.3.7 Nordics
- 11.3.8 Netherlands
- 11.3.9 Sweden
- 11.4 Asia Pacific
- 11.4.1 China
- 11.4.2 India
- 11.4.3 Japan
- 11.4.4 Australia
- 11.4.5 South Korea
- 11.4.6 Singapore
- 11.4.7 Thailand
- 11.4.8 Indonesia
- 11.4.9 Vietnam
- 11.5 Latin America
- 11.5.1 Brazil
- 11.5.2 Mexico
- 11.5.3 Argentina
- 11.6 MEA
- 11.6.1 South Africa
- 11.6.2 Saudi Arabia
- 11.6.3 UAE
- 11.6.4 Turkey
Chapter 12 Company Profiles
- 12.1 Global Players
- 12.1.1 Ford
- 12.1.2 General Motors
- 12.1.3 Hyundai/Kia
- 12.1.4 Mercedes-Benz Vans
- 12.1.5 Nissan
- 12.1.6 Renault Group
- 12.1.7 SAIC
- 12.1.8 Stellantis
- 12.1.9 Toyota
- 12.1.10 Volkswagen
- 12.2 Regional Players
- 12.2.1 BYD
- 12.2.2 Changan Automobile
- 12.2.3 Dongfeng Motor Corporation
- 12.2.4 GAC Group
- 12.2.5 Isuzu Motors
- 12.2.6 Iveco
- 12.3 Emerging Players / Disruptors
- 12.3.1 Arrival
- 12.3.2 Greenkraft
- 12.3.3 Rivian
- 12.3.4 Workhorse Group
 2026年全球重型貨運市場報告2026年全球電動垃圾車市場報告
 汽車行李箱市場按類型、材料、容量、應用、最終用戶和分銷管道分類,全球預測(2026-2032年)
 貨運代理市場-全球產業規模、佔有率、趨勢、機會與預測:按貨運類型、產業、地區和競爭格局分類,2021-2031年重型貨運市場-全球產業規模、佔有率、趨勢、機會、預測:按類型、應用、地區和競爭格局分類,2021-2031年全球運輸膠帶市場:按產品類型、膠頻寬度、黏合劑類型、厚度、應用和最終用戶分類-2026-2032年全球預測超限貨物運輸市場(按車輛類型、服務類型、運輸方式、貨物類型和最終用戶產業分類),全球預測(2026-2032年)
 船對船轉運服務市場按服務類型、操作類型、安裝地點、最終用戶行業和地區分類
 寵物訂閱盒市場預測至2032年:按產品、寵物類型、目標年齡、主題和地區分類的全球分析
 全球貨車市場