


 |
市場調查報告書
商品編碼
1892863
燃氣閥門市場機會、成長促進因素、產業趨勢分析及預測(2026-2035年)Gas Valve Market Opportunity, Growth Drivers, Industry Trend Analysis, and Forecast 2026 - 2035 |
||||||
2025年全球燃氣閥門市場價值為76億美元,預計到2035年將以6.1%的複合年成長率成長至136億美元。
人們日益關注降低能源消耗,加速了高效能燃氣閥門技術的普及,促使製造商加大節能閥門解決方案的產量。全球監管機構不斷收緊安全和性能標準,促使企業升級設計、材料和控制系統。美國能源部強制執行的、符合 ANSI 和 CSA 2024 指南的要求,進一步強化了對適用於公用事業和工業環境的先進合規閥門系統的需求。隨著技術應用的普及,物聯網 (IoT) 整合的興起正在改變整個行業,為智慧燃氣閥門鋪平了道路,使用戶能夠遠端監控系統性能、即時檢測問題並最佳化燃氣流量。這些進步正在重塑競爭格局,並鼓勵製造商加大研發投入,以滿足不斷變化的安全、效率和自動化需求。
| 市場範圍 | |
|---|---|
| 起始年份 | 2025 |
| 預測年份 | 2026-2035 |
| 起始值 | 76億美元 |
| 預測值 | 136億美元 |
| 複合年成長率 | 6.1% |
2025年球閥市場規模達24億美元,預計2035年將攀升至44億美元。球閥能夠提供可靠的流量控制、快速關閉和增強的洩漏預防能力,使其成為現代燃氣系統中必不可少的組件,對運行性能和安全性都至關重要。
受全球對天然氣作為更清潔替代燃料的需求不斷成長的推動,預計到2025年,天然氣運輸領域將佔據38.5%的市場佔有率。隨著管道網路的延伸和基礎設施升級的加速,燃氣閥門在確保流量控制、可靠性和系統保護方面發揮著至關重要的作用。艾默生電氣等公司仍然是滿足大型輸電環境中這些需求的領先供應商之一。
預計到2025年,美國天然氣閥門市佔率將達到73%。美國龐大的天然氣基礎設施及其在液化天然氣(LNG)出口領域的領先地位,進一步推動了市場成長。 LNG產量的不斷成長和管道的持續擴建,顯著提升了上游、中游和出口設施對低溫和高壓閥門的需求。
目錄
第1章:方法論與範圍
第2章:執行概要
第3章:行業洞察
- 產業生態系分析
- 供應商格局
- 利潤率
- 每個階段的價值增加
- 影響價值鏈的因素
- 產業影響因素
- 成長促進因素
- 天然氣需求不斷成長
- 快速工業化
- 再生能源併網
- 產業陷阱與挑戰
- 監理合規
- 原物料價格波動
- 機會
- 氫能和液化天然氣基礎設施的成長
- 採用智慧和物聯網閥門
- 成長促進因素
- 成長潛力分析
- 未來市場趨勢
- 技術與創新格局
- 當前技術趨勢
- 新興技術
- 價格趨勢
- 依產品類型
- 按地區
- 監管環境
- 標準和合規要求
- 區域監理框架
- 認證標準
- 貿易統計(HS編碼84818090)
- 主要進口國
- 主要出口國
- 差距分析
- 風險評估與緩解
- 波特的分析
- PESTEL 分析
第4章:競爭格局
- 介紹
- 公司市佔率分析
- 按地區
- 公司矩陣分析
- 主要市場參與者的競爭分析
- 競爭定位矩陣
- 關鍵進展
- 併購
- 合作夥伴關係與合作
- 新產品發布
- 擴張計劃
第5章:市場估算與預測:依產品類型分類,2022-2035年
- 閘閥
- 控制閥
- 球閥
- 蝶閥
- 旋塞閥
- 其他(針閥、截止閥、排水閥等)
第6章:市場規模估算與預測(2022-2035年)
- 小於1英寸
- 介於 1 到 6 英吋之間
- 7 至 25 英寸
- 介於 26 至 50 英吋之間
- 大於 50 英寸
第7章:市場估算與預測:依材料分類,2022-2035年
- 不銹鋼
- 碳鋼
- 黃銅
- 合金及特殊材料
第8章:市場估算與預測:依應用領域分類,2022-2035年
- 供氣管
- 灌裝裝置
- 散裝儲罐
- 天然氣運輸
- 儲槽和管道
- 其他
第9章:市場估算與預測:依最終用途分類,2022-2035年
- 水和廢水
- 餐飲
- 化學品
- 製藥
- 紙漿和造紙
- 石油和天然氣
- 力量
- 半導體
- 其他
第10章:市場估價與預測:依配銷通路分類,2022-2035年
- 直銷
- 間接銷售
第11章:市場估計與預測:按地區分類,2022-2035年
- 北美洲
- 美國
- 加拿大
- 歐洲
- 德國
- 法國
- 英國
- 義大利
- 西班牙
- 亞太地區
- 中國
- 印度
- 日本
- 韓國
- 澳洲
- 拉丁美洲
- 巴西
- 墨西哥
- 阿根廷
- MEA
- 南非
- 沙烏地阿拉伯
- 阿拉伯聯合大公國
第12章:公司簡介
- China Yuanda Valve
- CNNC Sufa Technology
- Crane
- Dalian DV Valve
- Danfoss
- Emerson Electric
- Flowserve
- Henan Kaifeng High Pressure Valve
- Neway
- Pentair
- Schlumberger
- Shandong Yidu Valve
- SWI Valve
- Velan
- Watts
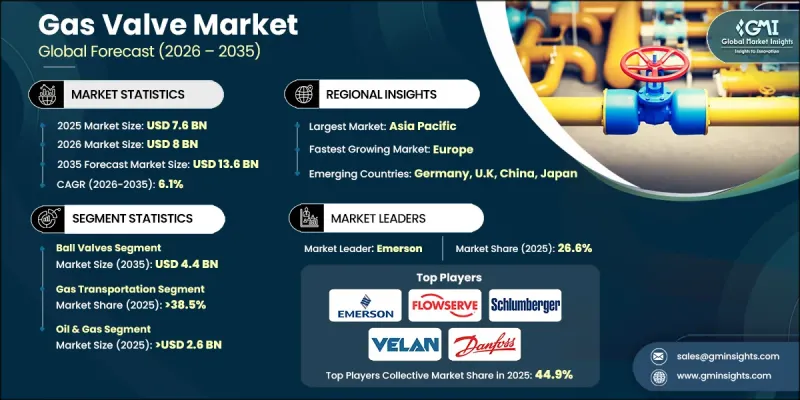
The Global Gas Valve Market was valued at USD 7.6 billion in 2025 and is estimated to grow at a CAGR of 6.1% to reach USD 13.6 billion by 2035.
Growing attention toward reducing energy consumption is accelerating the shift toward high-efficiency gas valve technologies, which has prompted manufacturers to increase production of energy-saving valve solutions. Regulatory bodies worldwide continue tightening safety and performance standards, prompting companies to upgrade designs, materials, and control systems. Requirements enforced by the U.S. Department of Energy that align with ANSI and CSA 2024 guidelines are reinforcing the need for advanced and compliant valve systems suitable for installations in utility and industrial environments. As technology adoption grows, the rise of IoT integration is transforming the industry, paving the way for smart gas valves that enable users to remotely monitor system performance, detect issues in real time, and optimize gas flow. These advancements are reshaping the competitive landscape and encouraging manufacturers to invest heavily in R&D to stay ahead of evolving safety, efficiency, and automation expectations.
| Market Scope | |
|---|---|
| Start Year | 2025 |
| Forecast Year | 2026-2035 |
| Start Value | $7.6 Billion |
| Forecast Value | $13.6 Billion |
| CAGR | 6.1% |
The ball valves segment reached USD 2.4 billion in 2025 and is projected to climb to USD 4.4 billion by 2035. Their ability to provide dependable flow control, rapid shut-off, and enhanced leak prevention makes them essential components in modern gas systems, supporting both operational performance and safety.
The gas transportation segment accounted for a 38.5% share in 2025, supported by expanding global demand for natural gas as a cleaner alternative fuel. As pipeline networks extend and infrastructure upgrades accelerate, gas valves play a crucial role in ensuring controlled flow, reliability, and system protection. Companies such as Emerson Electric remain among the leading suppliers addressing these needs in large-scale transmission environments.
U.S. Gas Valve Market captured 73% share in 2025. Growth is reinforced by the nation's extensive natural gas infrastructure and its leading position in LNG exports. Rising LNG output and ongoing pipeline expansions have significantly boosted the requirement for cryogenic and high-pressure valves used across upstream, midstream, and export facilities.
Prominent companies operating in the Global Gas Valve Market include Emerson Electric, Flowserve, Danfoss, Crane, Pentair, Velan, Watts, Neway, CNNC Sufa Technology, China Yuanda Valve, Henan Kaifeng High Pressure Valve, Schlumberger, SWI Valve, Shandong Yidu Valve, and Dalian DV Valve. To strengthen their Gas Valve Market foothold, companies in the Gas Valve Market focus on developing high-efficiency, regulation-compliant technologies that address tightening global standards. Many manufacturers are expanding their smart valve offerings by incorporating sensors, automation features, and remote monitoring capabilities to support digital asset management. Firms are also investing in advanced materials and engineering upgrades to improve durability in high-pressure, cryogenic, and corrosive environments. Strategic partnerships with energy companies, pipeline operators, and industrial facilities help streamline product integration and increase long-term contracts.
Table of Contents
Chapter 1 Methodology & Scope
- 1.1 Market scope and definition
- 1.2 Research design
- 1.2.1 Research approach
- 1.2.2 Data collection methods
- 1.3 Data mining sources
- 1.3.1 Global
- 1.3.2 Regional/Country
- 1.4 Base estimates and calculations
- 1.4.1 Base year calculation
- 1.4.2 Key trends for market estimation
- 1.5 Primary research and validation
- 1.5.1 Primary sources
- 1.6 Forecast model
- 1.7 Research assumptions and limitations
Chapter 2 Executive Summary
- 2.1 Industry 3600 synopsis
- 2.2 Key market trends
- 2.2.1 Regional
- 2.2.2 Product Type
- 2.2.3 Size
- 2.2.4 Material
- 2.2.5 Application
- 2.2.6 End Use
- 2.2.7 Distribution channel
- 2.3 CXO perspectives: Strategic imperatives
- 2.3.1 Key decision points for industry executives
- 2.3.2 Critical success factors for market players
- 2.4 Future outlook and strategic recommendations
Chapter 3 Industry Insights
- 3.1 Industry ecosystem analysis
- 3.1.1 Supplier landscape
- 3.1.2 Profit margin
- 3.1.3 Value addition at each stage
- 3.1.4 Factor affecting the value chain
- 3.2 Industry impact forces
- 3.2.1 Growth drivers
- 3.2.1.1 Increasing demand for natural gas
- 3.2.1.2 Rapid industrialization
- 3.2.1.3 Renewable energy integration
- 3.2.2 Industry pitfalls & challenges
- 3.2.2.1 Regulatory compliance
- 3.2.2.2 Price volatility of raw materials
- 3.2.3 Opportunities
- 3.2.3.1 Growth in hydrogen & LNG infrastructure
- 3.2.3.2 Adoption of smart & IoT-enabled valves
- 3.2.1 Growth drivers
- 3.3 Growth potential analysis
- 3.4 Future market trends
- 3.5 Technology and innovation landscape
- 3.5.1 Current technological trends
- 3.5.2 Emerging technologies
- 3.6 Price trends
- 3.6.1 By Product type
- 3.6.2 By Region
- 3.7 Regulatory landscape
- 3.7.1 Standards and compliance requirements
- 3.7.2 Regional regulatory frameworks
- 3.7.3 Certification standards
- 3.8 Trade statistics (HS code 84818090)
- 3.8.1 Major importing countries
- 3.8.2 Major exporting countries
- 3.9 Gap analysis
- 3.10 Risk assessment and mitigation
- 3.11 Porter's analysis
- 3.12 PESTEL analysis
Chapter 4 Competitive Landscape, 2025
- 4.1 Introduction
- 4.2 Company market share analysis
- 4.2.1 By region
- 4.2.1.1 North America
- 4.2.1.2 Europe
- 4.2.1.3 Asia Pacific
- 4.2.1.4 Latin America
- 4.2.1.5 Middle East and Africa
- 4.2.1 By region
- 4.3 Company matrix analysis
- 4.4 Competitive analysis of major market players
- 4.5 Competitive positioning matrix
- 4.6 Key developments
- 4.6.1 Mergers & acquisitions
- 4.6.2 Partnerships & collaborations
- 4.6.3 New product launches
- 4.6.4 Expansion plans
Chapter 5 Market Estimates & Forecast, By Product Type, 2022-2035 (USD Billion) (Thousand Units)
- 5.1 Key trends
- 5.2 Gate valves
- 5.3 Control valves
- 5.4 Ball valves
- 5.5 Butterfly valve
- 5.6 Plug valves
- 5.7 Others (needle valves, globe valves, drain valves, etc.)
Chapter 6 Market Estimates & Forecast, By Size, 2022-2035 (USD Billion) (Thousand Units)
- 6.1 Key trends
- 6.2 Lesser than 1inch
- 6.3 Between 1 to 6 inch
- 6.4 Between 7 to 25 inch
- 6.5 Between 26 to 50 inch
- 6.6 Greater than 50 inch
Chapter 7 Market Estimates & Forecast, By Material, 2022-2035 (USD Billion) (Thousand Units)
- 7.1 Key trends
- 7.2 Stainless steel
- 7.3 Carbon steel
- 7.4 Brass
- 7.5 Alloy & specialty materials
Chapter 8 Market Estimates & Forecast, By Application, 2022-2035 (USD Billion) (Thousand Units)
- 8.1 Key trends
- 8.2 Supplying line
- 8.3 Filling device
- 8.4 Bulk storage tank
- 8.5 Gas transportation
- 8.6 Storage tank & piping
- 8.7 Others
Chapter 9 Market Estimates & Forecast, By End Use, 2022-2035 (USD Billion) (Thousand Units)
- 9.1 Key trends
- 9.2 Water & wastewater
- 9.3 Food & beverage
- 9.4 Chemicals
- 9.5 Pharma
- 9.6 Pulp & paper
- 9.7 Oil & gas
- 9.8 Power
- 9.9 Semiconductor
- 9.10 Others
Chapter 10 Market Estimates & Forecast, By Distribution Channel, 2022-2035 (USD Billion) (Thousand Units)
- 10.1 Key trends
- 10.2 Direct sales
- 10.3 Indirect sales
Chapter 11 Market Estimates & Forecast, By Region, 2022-2035 (USD Billion) (Thousand Units)
- 11.1 Key trends
- 11.2 North America
- 11.2.1 U.S.
- 11.2.2 Canada
- 11.3 Europe
- 11.3.1 Germany
- 11.3.2 France
- 11.3.3 UK
- 11.3.4 Italy
- 11.3.5 Spain
- 11.4 Asia Pacific
- 11.4.1 China
- 11.4.2 India
- 11.4.3 Japan
- 11.4.4 South Korea
- 11.4.5 Australia
- 11.5 Latin America
- 11.5.1 Brazil
- 11.5.2 Mexico
- 11.5.3 Argentina
- 11.6 MEA
- 11.6.1 South Africa
- 11.6.2 Saudi Arabia
- 11.6.3 UAE
Chapter 12 Company Profiles
- 12.1 China Yuanda Valve
- 12.2 CNNC Sufa Technology
- 12.3 Crane
- 12.4 Dalian DV Valve
- 12.5 Danfoss
- 12.6 Emerson Electric
- 12.7 Flowserve
- 12.8 Henan Kaifeng High Pressure Valve
- 12.9 Neway
- 12.10 Pentair
- 12.11 Schlumberger
- 12.12 Shandong Yidu Valve
- 12.13 SWI Valve
- 12.14 Velan
- 12.15 Watts
 大口徑蝶閥:全球市佔率及排名、總收入及需求預測(2025-2031年)氫氣閥:全球市佔率及排名、總收入及需求預測(2025-2031年)恆溫散熱器閥:全球市佔率及排名、總收入及需求預測(2025-2031年)電控氣動比例閥:全球市佔率及排名、總收入及需求預測(2025-2031)低溫液氫充裝閥:全球市佔率及排名、總收入及需求預測(2025-2031年)
 航太低溫閥市場機會、成長促進因素、產業趨勢分析及預測(2025-2034年)
 全球旋轉閥市場-2025-2030年預測單向離合器:全球市場佔有率和排名、總銷售額和需求預測(2025-2031 年)輪胎氣門嘴:全球市佔率排名、總銷售量及需求預測(2025-2031年)
 依閥門技術、壓縮機類型、終端用戶產業、壓力等級和材質配置分類的壓縮機閥門市場-2025-2032年全球預測