


 |
市場調查報告書
商品編碼
1892803
電動車(EV)計程車市場機會、成長促進因素、產業趨勢分析及預測(2026-2035年)Electric Vehicle (EV) Taxi Market Opportunity, Growth Drivers, Industry Trend Analysis, and Forecast 2026 - 2035 |
||||||
2025 年全球電動車計程車市場價值 257 億美元,預計到 2035 年將以 14.1% 的複合年成長率成長至 900 億美元。
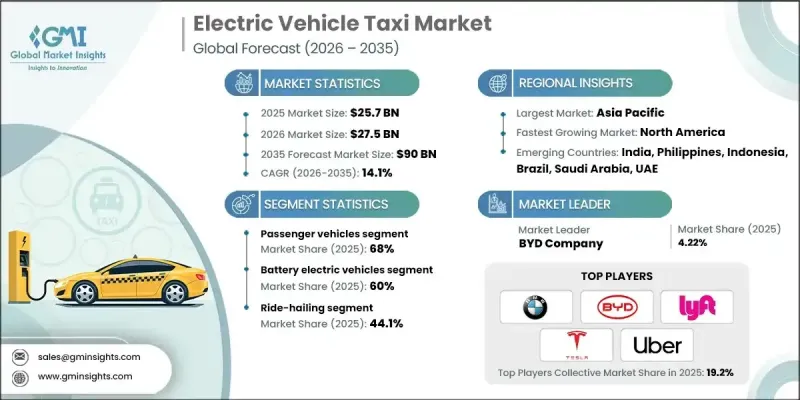
全球向永續交通、智慧車隊管理和電氣化城市出行系統的轉型推動了電動計程車產業的成長。現代電動計程車平台融合了高容量電池、人工智慧驅動的車隊最佳化、即時車輛監控和智慧充電網路,從而提高效率、降低營運成本、減少排放並提升乘客安全。各國政府和旅遊服務提供者正日益轉向電動計程車,以滿足監管要求、減少對燃料的依賴並提升城市交通的永續性。這些創新也有助於營運商預測維護需求、規避油價波動並最佳化路線規劃。產業整合、策略聯盟和技術合作正在重塑電動計程車格局,製造商、電池供應商和軟體供應商攜手合作,共同開發長續航里程車輛、超快速充電解決方案和整合數位平台,以確保無縫營運和節能路線規劃。
| 市場範圍 | |
|---|---|
| 起始年份 | 2025 |
| 預測年份 | 2026-2035 |
| 起始值 | 257億美元 |
| 預測值 | 900億美元 |
| 複合年成長率 | 14.1% |
預計到2025年,乘用車市佔率將達到68%,並有望在2035年之前以13.6%的複合年成長率成長。緊湊型和中型車因其價格實惠、能源效率高且適合日常城市路線,在電動計程車行業中佔據主導地位。它們與電動車動力系統的兼容性使車隊營運商能夠利用補貼、降低燃料成本和減少排放,同時簡化維護工作。
預計到2025年,純電動車市佔率將達到60%,到2035年將以14.4%的複合年成長率成長。由於零排放、營運成本低、續航里程長、充電速度快以及安全性能優異,純電動車成為計程車營運的首選。政府激勵措施以及不斷擴展的公共和私人充電網路進一步推動了純電動車的普及,確保了計程車營運的持續性並提高了車隊效率。
中國電動計程車市場佔37%的市場佔有率,預計2024年市場規模將達到40.2億美元。車隊快速電氣化、政府強力的激勵措施以及積極的減排政策正在加速電動計程車的普及,尤其是在主要城市中心。補貼、降低牌照費用以及優惠充電計劃鼓勵計程車業者從傳統燃油車轉型為電動車。
目錄
第1章:方法論
第2章:執行概要
第3章:行業洞察
- 產業生態系分析
- 供應商格局
- 利潤率分析
- 成本結構
- 每個階段的價值增加
- 影響價值鏈的因素
- 中斷
- 產業影響因素
- 成長促進因素
- 政府激勵措施和更嚴格的排放標準
- 汽油動力車輛的燃料價格不斷上漲
- 電池技術的進步
- 人們越來越意識到氣候變遷以及對永續交通解決方案的需求。
- 快速城市化和智慧城市計劃
- 產業陷阱與挑戰
- 電動車初始成本高
- 充電基礎設施有限
- 市場機遇
- 擴大充電基礎設施
- 與智慧城市計畫的融合
- 企業車隊電氣化計劃
- 電池和電動車零件的技術進步
- 成長促進因素
- 成長潛力分析
- 監管環境
- 北美洲
- 美國聯邦政府的激勵措施(稅收抵免、撥款)以及基礎設施資金(NEVI/IIJA)支持車隊電氣化和車輛段充電。
- 歐洲
- 德國:《電動車法案》(EmoG)
- 英國:插電式計程車補貼計畫 (PiTG)
- 法國:《出行指導法》(LOM法案)
- 義大利:國家能源與氣候綜合計畫(PNIEC)
- 亞太地區
- 中國:新能源汽車(NEV)強制令
- 印度:FAME II 計畫(電動車激勵計畫)
- 日本:電動車/燃料電池汽車部署戰略路線圖
- 澳洲:各州零排放車輛強制令
- 拉丁美洲
- 巴西:國家電動車政策(PNME)
- 墨西哥:城市零排放計程車項目
- 阿根廷:省級電動計程車法規(布宜諾斯艾利斯)
- MEA
- 阿拉伯聯合大公國:電動車充電基礎設施監管條例(ADDM/DEWA)
- 沙烏地阿拉伯:電動車部署規範架構(SASO)
- 南非:綠色交通戰略
- 北美洲
- 波特的分析
- PESTEL 分析
- 技術與創新格局
- 當前技術趨勢
- 新興技術
- 專利分析
- 定價分析
- 按地區
- 透過推進
- 成本細分分析
- 車輛成本
- 營運成本
- 總擁有成本(TCO)
- 充電基礎設施成本
- 安裝和啟動費用
- 研發成本
- 永續性和環境影響分析
- 永續實踐
- 減少廢棄物策略
- 生產中的能源效率
- 環保舉措
- 碳足跡考量
- 未來展望與機遇
- 技術路線圖和演進時間表
- 新興應用機會
- 投資需求及資金來源
- 風險評估與緩解策略
- 針對市場參與者的策略建議
第4章:競爭格局
- 介紹
- 公司市佔率分析
- 主要市場參與者的競爭分析
- 競爭定位矩陣
- 戰略展望矩陣
- 關鍵進展
- 併購
- 合作夥伴關係與合作
- 新產品發布
- 擴張計劃和資金
第5章:市場估價與預測:依車輛類型分類,2022-2035年
- 搭乘用車
- 掀背車
- 轎車
- SUV
- 商用車輛
- 輕型商用車(LCV)
- 中型商用車(MCV)
- 重型商用車(HCV)
第6章:市場估算與預測:以推進方式分類,2022-2035年
- 電池電動車(BEV)
- 混合動力電動車(HEV)
- 插電式混合動力車(PHEV)
第7章:市場估算與預測:依服務類型分類,2022-2035年
- 叫車
- 計程車服務
- 車隊營運服務
- 機器人計程車服務
第8章:市場估算與預測:依所有權模式分類,2022-2035年
- 車隊所有
- 個人駕駛員所有
- 訂閱
- 合作模式
- 其他
第9章:市場估算與預測:依區間分類,2022-2035年
- 短續航里程(每次充電後少於150公里)
- 中等續航里程(每次充電可行駛 150-250 公里)
- 長續航里程(每次充電可行駛250公里以上)
第10章:市場估價與預測:依充電基礎設施分類,2022-2035年
- 快速充電
- 充電速度慢
- 無線充電
第11章:市場估計與預測:按地區分類,2022-2035年
- 北美洲
- 美國
- 加拿大
- 歐洲
- 德國
- 英國
- 法國
- 義大利
- 西班牙
- 俄羅斯
- 北歐
- 亞太地區
- 中國
- 印度
- 日本
- 澳洲
- 韓國
- 菲律賓
- 印尼
- 拉丁美洲
- 巴西
- 墨西哥
- 阿根廷
- MEA
- 南非
- 沙烏地阿拉伯
- 阿拉伯聯合大公國
第12章:公司簡介
- 全球參與者
- BAIC
- BYD
- Didi Chuxing
- GoGreen Cab Services
- Green Cab
- Lyft
- Nissan Motor
- Tesla
- Uber
- Volkswagen
- Waymo (Alphabet)
- 區域玩家
- Alto
- BluSmart Mobility
- EEE-Taxi Mobility Solutions
- EV Capital
- EVERA Auto
- Grab Holdings
- Ola
- 新興參與者
- Cruise LLC (General Motors)
- Evera Cabs
- GSM Green and Smart Mobility
- Xanh SM
The Global Electric Vehicle Taxi Market was valued at USD 25.7 billion in 2025 and is estimated to grow at a CAGR of 14.1% to reach USD 90 billion by 2035.
Growth is fueled by the global shift toward sustainable transportation, intelligent fleet management, and electrified urban mobility systems. Modern EV taxi platforms combine high-capacity batteries, AI-driven fleet optimization, real-time vehicle monitoring, and smart charging networks to enhance efficiency, reduce operating costs, minimize emissions, and elevate passenger safety. Governments and mobility service providers are increasingly transitioning to electric taxis to meet regulatory mandates, reduce fuel dependency, and improve city-wide transport sustainability. These innovations also help operators anticipate maintenance needs, avoid fuel price volatility, and optimize route planning. Industry consolidation, strategic alliances, and technology partnerships are reshaping the EV taxi landscape, with manufacturers, battery suppliers, and software providers working together to develop long-range vehicles, ultra-fast charging solutions, and integrated digital platforms that ensure seamless operations and energy-efficient routing.
| Market Scope | |
|---|---|
| Start Year | 2025 |
| Forecast Year | 2026-2035 |
| Start Value | $25.7 Billion |
| Forecast Value | $90 Billion |
| CAGR | 14.1% |
The passenger vehicle segment held a 68% share in 2025 and is expected to grow at a CAGR of 13.6% through 2035. Compact and mid-sized cars dominate the EV taxi industry due to their affordability, efficient energy consumption, and suitability for daily urban routes. Their compatibility with EV powertrains allows fleet operators to leverage subsidies, reduce fuel expenses, and lower emissions while simplifying maintenance.
The battery electric vehicles segment held a 60% share in 2025 and is projected to grow at a CAGR of 14.4% by 2035. BEVs are preferred for taxi operations due to zero-emission operation, lower running costs, longer ranges, faster charging, and superior safety features. Government incentives and expanding public and private charging networks further drive adoption, ensuring continuous operations and increased fleet efficiency.
China Electric Vehicle Taxi Market held a 37% share, generating USD 4.02 billion in 2024. Rapid fleet electrification, strong government incentives, and aggressive emission-reduction policies are accelerating adoption, especially in major urban centers. Subsidies, reduced licensing fees, and preferential charging programs encourage taxi operators to transition from traditional ICE vehicles to EVs.
Prominent companies operating in the Electric Vehicle Taxi Market include Tesla, BYD Company, Uber Electric, Didi Chuxing, OLA, BMW, BAIC, EV Capital, EVERA Auto, and Lyft. Companies are strengthening their Electric Vehicle Taxi Market positions by developing long-range EV taxis and integrating solid-state or high-density battery systems to enhance vehicle performance and reliability. Strategic partnerships with charging network providers, fleet management software companies, and urban mobility platforms enable seamless operations, optimized routing, and energy-efficient trip allocation. Leading players are investing in AI-driven fleet optimization, predictive maintenance tools, and real-time telematics to reduce downtime and operating costs. Incentive programs, fleet subscription models, and flexible leasing solutions help attract taxi operators to EV adoption.
Table of Contents
Chapter 1 Methodology
- 1.1 Market scope and definition
- 1.2 Research design
- 1.2.1 Research approach
- 1.2.2 Data collection methods
- 1.3 Data mining sources
- 1.3.1 Global
- 1.3.2 Regional/Country
- 1.4 Base estimates and calculations
- 1.4.1 Base year calculation
- 1.4.2 Key trends for market estimation
- 1.5 Primary research and validation
- 1.5.1 Primary sources
- 1.6 Forecast model
- 1.7 Research assumptions and limitations
Chapter 2 Executive Summary
- 2.1 Industry 3600 synopsis, 2022 - 2035
- 2.2 Key market trends
- 2.2.1 Regional
- 2.2.2 Vehicle
- 2.2.3 Propulsion
- 2.2.4 Service
- 2.2.5 Ownership Model
- 2.2.6 Range
- 2.2.7 Charging Infrastructure
- 2.3 TAM Analysis, 2026-2035
- 2.4 CXO perspectives: Strategic imperatives
- 2.4.1 Executive decision points
- 2.4.2 Critical success factors
- 2.5 Future outlook and strategic recommendations
Chapter 3 Industry Insights
- 3.1 Industry ecosystem analysis
- 3.1.1 Supplier landscape
- 3.1.2 Profit margin analysis
- 3.1.3 Cost structure
- 3.1.4 Value addition at each stage
- 3.1.5 Factor affecting the value chain
- 3.1.6 Disruptions
- 3.2 Industry impact forces
- 3.2.1 Growth drivers
- 3.2.1.1 Government incentives and stricter emission norms
- 3.2.1.2 Rising fuel prices of gasoline-powered vehicles
- 3.2.1.3 Advancements in battery technology
- 3.2.1.4 Growing awareness about climate change and the need for sustainable transportation solutions
- 3.2.1.5 Rapid urbanization and smart city initiatives
- 3.2.2 Industry pitfalls and challenges
- 3.2.2.1 High initial costs of electric vehicles
- 3.2.2.2 Limited charging infrastructure
- 3.2.3 Market opportunities
- 3.2.3.1 Expansion of charging infrastructure
- 3.2.3.2 Integration with smart city initiatives
- 3.2.3.3 Fleet electrification programs by corporations
- 3.2.3.4 Technological advancements in batteries and EV components
- 3.2.1 Growth drivers
- 3.3 Growth potential analysis
- 3.4 Regulatory landscape
- 3.4.1 North America
- 3.4.1.1 US Federal incentives (tax credits, grants) plus infrastructure funding (NEVI/IIJA) support fleet electrification and depot charging.
- 3.4.2 Europe
- 3.4.2.1 Germany: Electric Mobility Act (EmoG)
- 3.4.2.2 UK: Plug-in Taxi Grant Scheme (PiTG)
- 3.4.2.3 France: Mobility Orientation Law (LOM Act)
- 3.4.2.4 Italy: National Integrated Plan for Energy and Climate (PNIEC)
- 3.4.3 Asia Pacific
- 3.4.3.1 China: New Energy Vehicle (NEV) Mandate
- 3.4.3.2 India: FAME II Scheme (EV Incentives)
- 3.4.3.3 Japan: Strategic Roadmap for EV/FCV Deployment
- 3.4.3.4 Australia: State-Level Zero-Emission Vehicle Mandates
- 3.4.4 Latin America
- 3.4.4.1 Brazil: National Electric Mobility Policy (PNME)
- 3.4.4.2 Mexico: Urban Zero-Emission Taxi Programs
- 3.4.4.3 Argentina: Provincial EV Taxi Regulations (Buenos Aires)
- 3.4.5 MEA
- 3.4.5.1 UAE: EV Charging Infrastructure Regulation (ADDM/DEWA)
- 3.4.5.2 Saudi Arabia: EV Deployment Regulatory Framework (SASO)
- 3.4.5.3 South Africa: Green Transport Strategy
- 3.4.1 North America
- 3.5 Porter's analysis
- 3.6 PESTEL analysis
- 3.7 Technology and Innovation landscape
- 3.7.1 Current technological trends
- 3.7.2 Emerging technologies
- 3.8 Patent analysis
- 3.9 Pricing Analysis
- 3.9.1 By region
- 3.9.2 By propulsion
- 3.10 Cost breakdown analysis
- 3.10.1 Vehicle Cost
- 3.10.2 Operational Cost
- 3.10.3 Total cost of ownership (TCO)
- 3.10.4 Charging Infrastructure Cost
- 3.10.5 Installation & activation costs
- 3.10.6 Research & development costs
- 3.11 Sustainability and environmental impact analysis
- 3.11.1 Sustainable practices
- 3.11.2 Waste reduction strategies
- 3.11.3 Energy efficiency in production
- 3.11.4 Eco-friendly initiatives
- 3.11.5 Carbon footprint considerations
- 3.12 Future outlook & opportunities
- 3.12.1 Technology roadmap & evolution timeline
- 3.12.2 Emerging application opportunities
- 3.12.3 Investment requirements & funding sources
- 3.12.4 Risk assessment & mitigation strategies
- 3.12.5 Strategic recommendations for market participants
Chapter 4 Competitive Landscape, 2025
- 4.1 Introduction
- 4.2 Company market share analysis
- 4.2.1 North America
- 4.2.2 Europe
- 4.2.3 Asia Pacific
- 4.2.4 Latin America
- 4.2.5 MEA
- 4.3 Competitive analysis of major market players
- 4.4 Competitive positioning matrix
- 4.5 Strategic outlook matrix
- 4.6 Key developments
- 4.6.1 Mergers & acquisitions
- 4.6.2 Partnerships & collaborations
- 4.6.3 New Product Launches
- 4.6.4 Expansion Plans and funding
Chapter 5 Market Estimates & Forecast, By Vehicle, 2022 - 2035 ($Bn, Units)
- 5.1 Key trends
- 5.2 Passenger vehicles
- 5.2.1 Hatchbacks
- 5.2.2 Sedans
- 5.2.3 SUV
- 5.3 Commercial vehicles
- 5.3.1 Light commercial vehicles (LCV)
- 5.3.2 Medium commercial vehicles (MCV)
- 5.3.3 Heavy commercial vehicles (HCV)
Chapter 6 Market Estimates & Forecast, By Propulsion, 2022 - 2035 ($Bn, Units)
- 6.1 Key trends
- 6.2 Battery electric vehicles (BEVs)
- 6.3 Hybrid electric vehicles (HEVs)
- 6.4 Plug-in hybrid electric vehicles (PHEVs)
Chapter 7 Market Estimates & Forecast, By Service, 2022 - 2035 ($Bn, Units)
- 7.1 Key trends
- 7.2 Ride-Hailing
- 7.3 Cab Services
- 7.4 Fleet Operator Services
- 7.5 Robotaxi Services
Chapter 8 Market Estimates & Forecast, By Ownership Model, 2022 - 2035 ($Bn, Units)
- 8.1 Key trends
- 8.2 Fleet-Owned
- 8.3 Individual Driver-Owned
- 8.4 Subscription
- 8.5 Cooperative Models
- 8.6 Others
Chapter 9 Market Estimates & Forecast, By Range, 2022 - 2035 ($Bn, Units)
- 9.1 Key trends
- 9.2 Short Range (<150 km per charge)
- 9.3 Medium Range (150-250 km per charge)
- 9.4 Long Range (250+ km per charge)
Chapter 10 Market Estimates & Forecast, By Charging infrastructure, 2022 - 2035 ($Bn, Units)
- 10.1 Key trends
- 10.2 Fast charging
- 10.3 Slow charging
- 10.4 Wireless charging
Chapter 11 Market Estimates & Forecast, By Region, 2022 - 2035 ($Bn, Units)
- 11.1 Key trends
- 11.2 North America
- 11.2.1 US
- 11.2.2 Canada
- 11.3 Europe
- 11.3.1 Germany
- 11.3.2 UK
- 11.3.3 France
- 11.3.4 Italy
- 11.3.5 Spain
- 11.3.6 Russia
- 11.3.7 Nordics
- 11.4 Asia Pacific
- 11.4.1 China
- 11.4.2 India
- 11.4.3 Japan
- 11.4.4 Australia
- 11.4.5 South Korea
- 11.4.6 Philippines
- 11.4.7 Indonesia
- 11.5 Latin America
- 11.5.1 Brazil
- 11.5.2 Mexico
- 11.5.3 Argentina
- 11.6 MEA
- 11.6.1 South Africa
- 11.6.2 Saudi Arabia
- 11.6.3 UAE
Chapter 12 Company Profiles
- 12.1 Global Players
- 12.1.1 BAIC
- 12.1.2 BYD
- 12.1.3 Didi Chuxing
- 12.1.4 GoGreen Cab Services
- 12.1.5 Green Cab
- 12.1.6 Lyft
- 12.1.7 Nissan Motor
- 12.1.8 Tesla
- 12.1.9 Uber
- 12.1.10 Volkswagen
- 12.1.11 Waymo (Alphabet)
- 12.2 Regional Players
- 12.2.1 Alto
- 12.2.2 BluSmart Mobility
- 12.2.3 EEE-Taxi Mobility Solutions
- 12.2.4 EV Capital
- 12.2.5 EVERA Auto
- 12.2.6 Grab Holdings
- 12.2.7 Ola
- 12.3 Emerging Players
- 12.3.1 Cruise LLC (General Motors)
- 12.3.2 Evera Cabs
- 12.3.3 GSM Green and Smart Mobility
- 12.3.4 Xanh SM
 新能源計程車市場:2026-2032年全球市場預測(依動力傳動系統、充電方式、電池容量及續航里程分類)計程車服務市場:2026-2032年全球市場預測(依服務類型、車輛類型、行駛里程、預約平台及客戶群分類)摩托車計程車服務市場:2026-2032年全球市場預測(依服務類型、車輛類型、使用時間、客戶群和應用程式分類)摩托車計程車服務市場:2026-2032年全球市場預測(依服務類型、車輛類型、服務時長、車款及使用者類型分類)
 2026年全球線上計程車服務市場報告2026年全球計程車和豪華轎車服務市場報告2026年全球計程車服務市場報告豪華轎車服務市場:2026-2032年全球市場預測(依服務類型、時間長度、車輛燃料類型、車輛類型、最終用戶和預訂方式分類)計程車和豪華轎車服務市場:按類型、服務時間、服務模式、距離和車輛類型分類-2026-2032年全球市場預測
 2026-2030年全球豪華轎車服務市場