


 |
市場調查報告書
商品編碼
1885873
智慧電動汽車充電網路市場機會、成長促進因素、產業趨勢分析及預測(2025-2034年)Smart EV Charging Networks Market Opportunity, Growth Drivers, Industry Trend Analysis, and Forecast 2025 - 2034 |
||||||
2024 年全球智慧電動車充電網路市場價值為 81 億美元,預計到 2034 年將以 18.8% 的複合年成長率成長至 472 億美元。
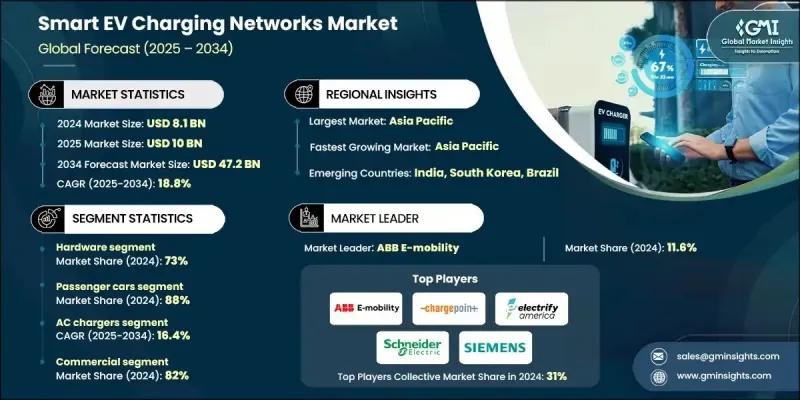
市場擴張與電動出行的加速發展和數位化協調充電生態系統的普及密切相關。網路營運商正日益整合智慧負載管理系統、即時分析和雲端平台,以提升充電樁效能、加強電網互動並改善整體用戶體驗。隨著交通電氣化的發展,最佳化充電能力和簡化能源輸送的需求也日益成長。電網現代化和車隊電氣化持續影響智慧充電網路的基礎設施建設重點。這些系統有助於實現即時功率平衡、需量反應、儲能最佳化和再生能源併網。人工智慧技術,例如先進的能源編排、網路安全層、車網互動功能和預測性運行,為可擴展且具有彈性的生態系統提供了支援。公用事業公司、充電網路供應商和製造商之間的合作正在加速部署,而標準化協議和漫遊協議則為更廣泛的互通性鋪平了道路。預測分析與政策驅動的投資相結合,有望催生充電和能源管理領域的新型服務模式。
| 市場範圍 | |
|---|---|
| 起始年份 | 2024 |
| 預測年份 | 2025-2034 |
| 起始值 | 81億美元 |
| 預測值 | 472億美元 |
| 複合年成長率 | 18.8% |
到2024年,硬體部分將佔據73%的市場。隨著對大量充電埠的需求持續成長,實體基礎設施仍然是網路擴展的基礎。低功率交流充電器佔所需數量的大多數,預計在2,800萬個充電器中,約有2,680萬個將用於滿足住宅、工作場所和社區的充電需求。
預計到2024年,乘用車市場將佔據88%的佔有率,這主要得益於消費者對電動車的接受度不斷提高,從而推動了家用和公共充電的需求。住宅交流充電和工作場所的充電設施滿足了日常通勤需求,而智慧充電平台則允許用戶管理用電量、安排充電時間,並利用動態定價功能來降低能源成本,減輕當地電網的壓力。
美國智慧電動車充電網路市場佔89.7%的市場佔有率,預計2024年市場規模將達到8.569億美元。州和聯邦層級的強力政策支持持續推動智慧電動車的普及,國家立法也撥出大量資源擴大充電基礎設施和提升電網容量。電動車銷售的成長進一步凸顯了在公共和私人場所廣泛普及充電設施的必要性。
智慧電動車充電網路市場的主要企業包括ABB E-mobility、EVBox、BP Pulse、ChargePoint、台達電子、Electrify America、EVgo、施耐德電機、西門子電動車和殼牌。這些企業正透過對互通性、先進電源管理和基礎設施部署的策略性投資來鞏固其市場地位。許多公司正在採用開放標準,以提高網路間的兼容性並確保用戶無縫存取。與公用事業公司和汽車製造商的合作對於擴展併網解決方案和加速充電樁部署至關重要。企業也正在整合人工智慧驅動的分析技術,以最佳化充電樁性能、預測需求並提高能源效率。增強網路安全、負載平衡能力和車網互動技術正被優先考慮,以滿足監管要求並支援電網穩定運行。
目錄
第1章:方法論
- 市場範圍和定義
- 研究設計
- 研究方法
- 資料收集方法
- 資料探勘來源
- 全球的
- 地區/國家
- 基準估算和計算
- 基準年計算
- 市場估算的關鍵趨勢
- 初步研究和驗證
- 原始資料
- 預報
- 研究假設和局限性
第2章:執行概要
第3章:行業洞察
- 產業生態系分析
- 供應商格局
- 利潤率分析
- 成本結構
- 每個階段的價值增加
- 影響價值鏈的因素
- 中斷
- 產業影響因素
- 成長促進因素
- 電動車普及率上升和充電基礎設施建設加速推進
- 向智慧、電網互動式充電的轉變日益明顯。
- 政府對公共和半公共充電設施建設的激勵措施
- 產業陷阱與挑戰
- 基礎設施安裝成本高且電網整合複雜
- 充電器、OCPP 標準和計費系統之間存在互通性差距
- 市場機遇
- 人工智慧賦能的充電最佳化和預測性負載管理的發展
- 漫遊網路和跨營運商計費互通性的需求不斷成長
- 成長促進因素
- 成長潛力分析
- 監管環境
- 北美洲
- 歐洲
- 亞太地區
- 拉丁美洲
- 中東和非洲
- 波特的分析
- PESTEL分析
- 技術與創新格局
- 當前技術趨勢
- 新興技術
- 價格趨勢
- 按地區
- 依產品
- 生產統計
- 生產中心
- 消費中心
- 進出口
- 成本細分分析
- 專利分析
- 永續性和環境方面
- 碳足跡評估
- 循環經濟一體化
- 電子垃圾管理要求
- 綠色製造舉措
- 原料和關鍵部件依賴性分析
- 碳化矽 (SiC) 和氮化鎵 (GaN) 供應前景
- 銅、稀土磁鐵和PCB依賴性
- 2025-2034年價格波動預測
- 回收和二次利用的機會
- 客戶購買行為和採購趨勢
- CPO、車隊、零售和公用事業買家群體
- 決策標準排序(總擁有成本、正常運作時間、互通性、品牌)
- 轉向交鑰匙解決方案和框架協議
- 漫遊樞紐和平台黏性的影響
- 通路和分銷策略分析
- 直銷、經銷商銷售和電氣批發商銷售路線
- 系統整合商和EPC合作夥伴的崛起
- 線上配置器和電子商務滲透率
- 區域頻道主導地位
第4章:競爭格局
- 介紹
- 公司市佔率分析
- 北美洲
- 歐洲
- 亞太地區
- 拉丁美洲
- MEA
- 主要市場參與者的競爭分析
- 競爭定位矩陣
- 戰略展望矩陣
- 關鍵進展
- 併購
- 合作夥伴關係與合作
- 新產品發布
- 擴張計劃和資金
第5章:市場估算與預測:依組件分類,2021-2034年
- 主要趨勢
- 硬體
- 交流充電器(1級/2級)
- 直流快速充電器(50千瓦)
- 直流超快充電器(=150千瓦)
- 充電樁/充電站(室內/室外)
- 軟體
- 充電樁管理系統(CPMS)
- 能源管理與負載平衡軟體
- 支付、計費和漫遊平台
- 遙測、OTA、韌體和網路安全
- 出行應用(預訂、路線規劃)
- 服務
- 安裝與調試
- 維運/管理服務
- 網站設計及電網連接服務
- 車隊及場地最佳化(諮詢)
- 計費即服務 (CaaS) 和訂閱
第6章:市場估算與預測:依充電器分類,2021-2034年
- 主要趨勢
- 交流充電器
- 慢速(=3.7 千瓦)
- 半快速(3.7-22 千瓦)
- 快速(單相/三相 2 級)
- 直流充電器
- 快速直流電(25-150千瓦)
- 超高速直流電(=150千瓦)
- 兆瓦級充電(適用於重型車輛)
第7章:市場估算與預測:依部署方式分類,2021-2034年
- 主要趨勢
- 住宅
- 商業的
第8章:市場估算與預測:依車輛類型分類,2021-2034年
- 主要趨勢
- 搭乘用車
- 掀背車
- 轎車
- SUV
- 商用車輛
- 輕型商用車(LCV)
- 中型商用車(MCV)
- 重型商用車(HCV)
第9章:市場估計與預測:依地區分類,2021-2034年
- 主要趨勢
- 北美洲
- 美國
- 加拿大
- 歐洲
- 德國
- 英國
- 法國
- 義大利
- 西班牙
- 北歐
- 俄羅斯
- 亞太地區
- 中國
- 印度
- 日本
- 澳洲
- 韓國
- 新加坡
- 馬來西亞
- 泰國
- 拉丁美洲
- 巴西
- 墨西哥
- 阿根廷
- MEA
- 南非
- 沙烏地阿拉伯
- 阿拉伯聯合大公國
第10章:公司簡介
- Charging Network Operators (CPOs)
- Blink Charging
- ChargePoint
- EnBW
- EVgo
- Fastned
- IONITY
- Mercedes-Benz
- Rivian
- Shell
- Tesla
- Volkswagen
- BP Pulse
- Electrify America
- EVBox
- Schneider Electric
- Charging Hardware & Infrastructure Manufacturers
- ABB E-mobility
- BYD
- Delta Electronics
- Eaton
- FreeWire Technologies
- Kempower
- Siemens
- StarCharge
- Tritium
- Wallbox
- Software Platforms & Network Management
- Ampeco
- Gireve
- Hubject
- Monta
- Energy Utilities, Integrated Charging Providers
- Ample
- E.ON
- Enel (Enel X Way)
- Momentum Dynamics
The Global Smart EV Charging Networks Market was valued at USD 8.1 billion in 2024 and is estimated to grow at a CAGR of 18.8% to reach USD 47.2 billion by 2034.
Market expansion is closely linked to the acceleration of electric mobility and the adoption of digitally coordinated charging ecosystems. Network operators are increasingly integrating intelligent load management systems, real-time analytics, and cloud-driven platforms to enhance charger performance, strengthen grid interaction, and improve overall user experience. As transportation electrification grows, demand is rising for optimized charging capabilities and streamlined energy delivery. Grid modernization and fleet electrification continue to shape infrastructure priorities across smart charging networks. These systems facilitate real-time power balancing, demand response, storage optimization, and renewable energy integration. Technologies enabled by artificial intelligence, such as advanced energy orchestration, cybersecurity layers, vehicle-to-grid functions, and predictive operations support scalable and resilient ecosystems. Collaboration among utilities, charging network providers, and manufacturers is accelerating deployment, while standardized protocols and roaming agreements are paving the way for broader interoperability. Predictive analytics, combined with policy-driven investment, is expected to spur new service models in charging and energy management.
| Market Scope | |
|---|---|
| Start Year | 2024 |
| Forecast Year | 2025-2034 |
| Start Value | $8.1 Billion |
| Forecast Value | $47.2 Billion |
| CAGR | 18.8% |
The hardware segment held 73% share in 2024. Physical infrastructure remains fundamental to network expansion, as the projected need for large numbers of charging ports continues to rise. Lower-powered AC chargers make up the majority of required units, with approximately 26.8 million of the anticipated 28 million chargers expected to serve residential, workplace, and community charging needs.
The passenger vehicles segment held an 88% share in 2024, fueled by increasing consumer adoption of electric cars, driving demand for both home-based and public charging. Residential AC charging and workplace installations support day-to-day commuting needs, while smart charging platforms allow users to manage consumption, schedule charging sessions, and utilize dynamic pricing features that reduce energy costs and alleviate stress on local grids.
United States Smart EV Charging Networks Market held a 89.7% share, generating USD 856.9 million in 2024. Strong policy support at both state and federal levels continues to propel adoption, with national legislation allocating substantial resources toward expanding charging infrastructure and enhancing grid capacity. Rising EV sales are reinforcing the need for widespread charging availability across public and private locations.
Key companies in the Smart EV Charging Networks Market include ABB E-mobility, EVBox, BP Pulse, ChargePoint, Delta Electronics, Electrify America, EVgo, Schneider Electric, Siemens eMobility, and Shell. Companies in the Smart EV Charging Networks Market are strengthening their foothold through strategic investments in interoperability, advanced power management, and expanded infrastructure deployment. Many firms are adopting open standards to improve compatibility across networks and ensure seamless user access. Partnerships with utilities and automakers are becoming central to scaling grid-connected solutions and accelerating charger rollout. Businesses are also integrating AI-powered analytics to optimize charger performance, forecast demand, and improve energy efficiency. Enhanced cybersecurity, load-balancing capabilities, and vehicle-to-grid technologies are being prioritized to meet regulatory expectations and support grid stability.
Table of Contents
Chapter 1 Methodology
- 1.1 Market scope and definition
- 1.2 Research design
- 1.2.1 Research approach
- 1.2.2 Data collection methods
- 1.3 Data mining sources
- 1.3.1 Global
- 1.3.2 Regional/Country
- 1.4 Base estimates and calculations
- 1.4.1 Base year calculation
- 1.4.2 Key trends for market estimation
- 1.5 Primary research and validation
- 1.5.1 Primary sources
- 1.6 Forecast
- 1.7 Research assumptions and limitations
Chapter 2 Executive Summary
- 2.1 Industry 3600 synopsis, 2021 - 2034
- 2.2 Key market trends
- 2.2.1 Regional
- 2.2.2 Component
- 2.2.3 Charger
- 2.2.4 Deployment
- 2.2.5 Vehicle
- 2.3 TAM Analysis, 2025-2034
- 2.4 CXO perspectives: Strategic imperatives
- 2.4.1 Executive decision points
- 2.4.2 Critical success factors
- 2.5 Future outlook and strategic recommendations
Chapter 3 Industry Insights
- 3.1 Industry ecosystem analysis
- 3.1.1 Supplier landscape
- 3.1.2 Profit margin analysis
- 3.1.3 Cost structure
- 3.1.4 Value addition at each stage
- 3.1.5 Factor affecting the value chain
- 3.1.6 Disruptions
- 3.2 Industry impact forces
- 3.2.1 Growth drivers
- 3.2.1.1 Rising EV adoption and accelerated charging infrastructure rollout
- 3.2.1.2 Growing shift toward smart, grid-interactive charging
- 3.2.1.3 Government incentives for public and semi-public charging deployments
- 3.2.2 Industry pitfalls and challenges
- 3.2.2.1 High infrastructure installation cost & complex grid integration
- 3.2.2.2 Interoperability gaps across chargers, OCPP standards & billing systems
- 3.2.3 Market opportunities
- 3.2.3.1 Growth of AI-enabled charging optimization & predictive load management
- 3.2.3.2 Rising demand for roaming networks & cross-operator charging interoperability
- 3.2.1 Growth drivers
- 3.3 Growth potential analysis
- 3.4 Regulatory landscape
- 3.4.1 North America
- 3.4.2 Europe
- 3.4.3 Asia Pacific
- 3.4.4 Latin America
- 3.4.5 Middle East & Africa
- 3.5 Porter's analysis
- 3.6 Pestel analysis
- 3.7 Technology and innovation landscape
- 3.7.1 Current technological trends
- 3.7.2 Emerging technologies
- 3.8 Price trends
- 3.8.1 By region
- 3.8.2 By product
- 3.9 Production statistics
- 3.9.1 Production hubs
- 3.9.2 Consumption hubs
- 3.9.3 Export and import
- 3.10 Cost breakdown analysis
- 3.11 Patent analysis
- 3.12 Sustainability & environmental aspects
- 3.12.1 Carbon footprint assessment
- 3.12.2 Circular economy integration
- 3.12.3 E-waste management requirements
- 3.12.4 Green manufacturing initiatives
- 3.13 Raw material and critical component dependency analysis
- 3.13.1 Silicon carbide (SiC) and gallium nitride (GaN) supply outlook
- 3.13.2 Copper, rare-earth magnets, and PCB dependency
- 3.13.3 Price volatility forecast 2025-2034
- 3.13.4 Recycling and second-life opportunities
- 3.14 Customer buying behavior and procurement trends
- 3.14.1 CPO vs. fleet vs. retail vs. utility buyer segments
- 3.14.2 Decision criteria ranking (TCO, uptime, interoperability, brand)
- 3.14.3 Shift toward turnkey solutions and framework agreements
- 3.14.4 Influence of roaming hubs and platform stickiness
- 3.15 Channel and distribution strategy analysis
- 3.15.1 Direct sales vs. distributor vs. electrical wholesaler routes
- 3.15.2 Rise of system integrators and EPC partners
- 3.15.3 Online configurators and e-commerce penetration
- 3.15.4 Regional channel dominance
Chapter 4 Competitive Landscape, 2024
- 4.1 Introduction
- 4.2 Company market share analysis
- 4.2.1 North America
- 4.2.2 Europe
- 4.2.3 Asia Pacific
- 4.2.4 LATAM
- 4.2.5 MEA
- 4.3 Competitive analysis of major market players
- 4.4 Competitive positioning matrix
- 4.5 Strategic outlook matrix
- 4.6 Key developments
- 4.6.1 Mergers & acquisitions
- 4.6.2 Partnerships & collaborations
- 4.6.3 New product launches
- 4.6.4 Expansion plans and funding
Chapter 5 Market Estimates & Forecast, By Component, 2021 - 2034 ($Mn, Units)
- 5.1 Key trends
- 5.2 Hardware
- 5.2.1 AC chargers (Level 1 / Level 2)
- 5.2.2 DC fast chargers (50 kW)
- 5.2.3 DC ultra-fast chargers (=150 kW)
- 5.2.4 Charge points / charging stations (indoor/outdoor)
- 5.3 Software
- 5.3.1 Charge point management systems (CPMS)
- 5.3.2 Energy management & load-balancing software
- 5.3.3 Payment, billing & roaming platforms
- 5.3.4 Telemetry, OTA, firmware & cybersecurity
- 5.3.5 Mobility apps (reservation, routing)
- 5.4 Services
- 5.4.1 Installation & commissioning
- 5.4.2 Operation & maintenance (O&M) / managed services
- 5.4.3 Site design & grid connection services
- 5.4.4 Fleet & site optimization (consulting)
- 5.4.5 Charging-as-a-Service (CaaS) and subscriptions
Chapter 6 Market Estimates & Forecast, By Charger, 2021 - 2034 ($Mn, Units)
- 6.1 Key trends
- 6.2 AC Chargers
- 6.2.1 Slow (=3.7 kW)
- 6.2.2 Semi-fast (3.7-22 kW)
- 6.2.3 Fast (single-phase / three-phase Level 2)
- 6.3 DC Chargers
- 6.3.1 Fast DC (25-150 kW)
- 6.3.2 Ultra-fast DC (=150 kW)
- 6.3.3 Megawatt charging (for heavy vehicles)
Chapter 7 Market Estimates & Forecast, By Deployment, 2021 - 2034 ($Mn, Units)
- 7.1 Key trends
- 7.2 Residential
- 7.3 Commercial
Chapter 8 Market Estimates & Forecast, By Vehicle, 2021 - 2034 ($Mn, Units)
- 8.1 Key trends
- 8.2 Passenger Cars
- 8.2.1 Hatchback
- 8.2.2 Sedan
- 8.2.3 SUV
- 8.3 Commercial vehicles
- 8.3.1 Light commercial vehicles (LCV)
- 8.3.2 Medium commercial vehicles (MCV)
- 8.3.3 Heavy commercial vehicles (HCV)
Chapter 9 Market Estimates & Forecast, By Region, 2021 - 2034 ($Mn, Units)
- 9.1 Key trends
- 9.2 North America
- 9.2.1 US
- 9.2.2 Canada
- 9.3 Europe
- 9.3.1 Germany
- 9.3.2 UK
- 9.3.3 France
- 9.3.4 Italy
- 9.3.5 Spain
- 9.3.6 Nordics
- 9.3.7 Russia
- 9.4 Asia Pacific
- 9.4.1 China
- 9.4.2 India
- 9.4.3 Japan
- 9.4.4 Australia
- 9.4.5 South Korea
- 9.4.6 Singapore
- 9.4.7 Malaysia
- 9.4.8 Thailand
- 9.5 Latin America
- 9.5.1 Brazil
- 9.5.2 Mexico
- 9.5.3 Argentina
- 9.6 MEA
- 9.6.1 South Africa
- 9.6.2 Saudi Arabia
- 9.6.3 UAE
Chapter 10 Company Profiles
- 10.1 Charging Network Operators (CPOs)
- 10.1.1 Blink Charging
- 10.1.2 ChargePoint
- 10.1.3 EnBW
- 10.1.4 EVgo
- 10.1.5 Fastned
- 10.1.6 IONITY
- 10.1.7 Mercedes-Benz
- 10.1.8 Rivian
- 10.1.9 Shell
- 10.1.10 Tesla
- 10.1.11 Volkswagen
- 10.1.12 BP Pulse
- 10.1.13 Electrify America
- 10.1.14 EVBox
- 10.1.15 Schneider Electric
- 10.2 Charging Hardware & Infrastructure Manufacturers
- 10.2.1 ABB E-mobility
- 10.2.2 BYD
- 10.2.3 Delta Electronics
- 10.2.4 Eaton
- 10.2.5 FreeWire Technologies
- 10.2.6 Kempower
- 10.2.7 Siemens
- 10.2.8 StarCharge
- 10.2.9 Tritium
- 10.2.10 Wallbox
- 10.3 Software Platforms & Network Management
- 10.3.1 Ampeco
- 10.3.2 Gireve
- 10.3.3 Hubject
- 10.3.4 Monta
- 10.4 Energy Utilities, Integrated Charging Providers
- 10.4.1 Ample
- 10.4.2 E.ON
- 10.4.3 Enel (Enel X Way)
- 10.4.4 Momentum Dynamics
 電動車充電機器人市場預測至2034年—按產品類型、充電技術、充電速度、應用、最終用戶和地區分類的全球分析下一代電動車充電網路市場預測:至2034年-全球分析(按充電器類型、輸出功率、連接器類型、車輛型號、安裝類型、連接方式、應用、最終用戶和地區分類)
 電動車充電站市場(含廣告看板):依廣告形式、充電器類型、安裝位置、網路類型和最終用戶分類,全球預測,2026-2032年電動車充電主動濾波器按充電站類型、濾波器配置、額定輸出功率和最終用戶分類,全球預測,2026-2032年電動車充電濾波器市場按濾波器類型、濾波器拓撲結構、額定電流、應用和最終用戶分類-全球預測,2026-2032年電動車智慧充電控制器市場:按充電等級、模式、通訊技術、交付方式、車輛類型、應用和最終用戶分類-2026-2032年全球預測
 日本電動車充電設備市場佔有率分析、產業趨勢及統計、成長預測(2026-2031)
 日本電動車充電設備市場規模、佔有率、趨勢及預測(按充電站、最終用途和地區分類,2026-2034年)電動汽車家用充電套件市場預測至2032年:按充電器類型、連接器類型、車輛類型、安裝類型、分銷管道、應用和地區分類的全球分析
 超快速電動車充電(350kW+)系統市場機會、成長促進因素、產業趨勢分析及2025-2034年預測