


 |
市場調查報告書
商品編碼
1871223
用於能量收集的壓電聚合物市場機會、成長促進因素、產業趨勢分析及預測(2025-2034年)Piezoelectric Polymers for Energy Harvesting Market Opportunity, Growth Drivers, Industry Trend Analysis, and Forecast 2025 - 2034 |
||||||
2024 年全球壓電聚合物能量收集市場價值為 4,410 萬美元,預計到 2034 年將以 14.3% 的複合年成長率成長至 1.635 億美元。
市場成長主要得益於穿戴式裝置和物聯網設備的日益普及,這些設備需要緊湊、輕巧且靈活的電源。壓電聚合物為持續能量產生提供了一種永續的解決方案,使感測器、健康監測器和連網設備無需頻繁更換電池即可運作。消費性電子、醫療保健監測和健身追蹤應用領域的需求成長尤為顯著。 PVDF 和 PVDF-TrFE 聚合物性能的提升提高了機械柔韌性、耐久性和能量轉換效率,使這些材料能夠為下一代能量採集系統提供動力。持續的研究和材料創新正在推動其商業應用的拓展,使其在工業和消費性電子領域中得到應用。這些聚合物提供了輕巧、多功能且自供電的解決方案,正日益成為軟性電子產品和微型能量採集設備的首選。
| 市場範圍 | |
|---|---|
| 起始年份 | 2024 |
| 預測年份 | 2025-2034 |
| 起始值 | 4410萬美元 |
| 預測值 | 1.635億美元 |
| 複合年成長率 | 14.3% |
2024年,聚偏氟乙烯(PVDF)和鹼性共聚物市場規模為2,180萬美元,預計2025年至2034年將以13.9%的複合年成長率成長。這些聚合物因其可靠的壓電性能、良好的適應性和易加工性而備受青睞。它們廣泛應用於穿戴式裝置、微型感測器和消費性電子產品,提供高效、永續的能源解決方案。其成本效益和多功能性使其在工業和消費領域廣泛應用。
2024年,薄膜和膜材市場規模達到2,440萬美元,預計2025年至2034年間將以14.4%的複合年成長率成長。薄膜和膜材因其柔韌性、易於製造以及與穿戴式裝置和電子系統的兼容性而成為應用最廣泛的材料形式。它們能夠實現緊湊的設備設計、輕鬆的層疊和圖案化,從而提高能量轉換效率。薄膜和膜材在智慧紡織品和軟性電子產品中的應用日益廣泛,能夠利用使用者的運動在設備內部產生能量。
2024年,北美壓電聚合物能量採集市場佔33.5%的佔有率。隨著醫療保健、工業自動化和基礎設施應用等行業採用自供電感測解決方案,該地區的需求正在成長。智慧基礎設施、軍事應用和穿戴式裝置正在推動美國市場對該技術的採用,這得益於強大的研發投入和對能源效率的監管重點。對智慧城市和國家基礎設施項目的投資正在促進基於聚合物的能量採集器整合到道路、橋樑和城市環境中的感測器。製造商正在提高聚合物的耐久性和效率,以確保其在惡劣條件下擁有更長的使用壽命和可靠的性能,從而促進商業規模的部署。
用於能量收集的壓電聚合物市場的主要參與者包括3M公司、阿科瑪集團、TE Connectivity、Kureha Corporation、索爾維公司等。這些公司正採取多種策略來鞏固其市場地位。他們大力投資研發,以提高下一代能量收集器的能量轉換效率、機械耐久性和材料柔韌性。與電子產品和穿戴式裝置製造商建立合作關係,有助於確保產品在工業和消費領域的應用。各公司正在拓展產品線,以滿足微型感測器、智慧紡織品和軟性電子產品的需求。擴大產能、最佳化供應鏈和提高成本效益,進一步推動了全球市場的滲透。
目錄
第1章:方法論
- 市場範圍和定義
- 研究設計
- 研究方法
- 資料收集方法
- 資料探勘來源
- 全球的
- 地區/國家
- 基準估算和計算
- 基準年計算
- 市場估算的關鍵趨勢
- 初步研究和驗證
- 原始資料
- 預測模型
- 研究假設和局限性
第2章:執行概要
第3章:行業洞察
- 產業生態系分析
- 供應商格局
- 利潤率
- 每個階段的價值增加
- 影響價值鏈的因素
- 中斷
- 產業影響因素
- 成長促進因素
- 產業陷阱與挑戰
- 供應鏈的複雜性
- 市場機遇
- 成長潛力分析
- 監管環境
- 北美洲
- 歐洲
- 亞太地區
- 拉丁美洲
- 中東和非洲
- 波特的分析
- PESTEL 分析
- 價格趨勢
- 按地區
- 依產品
- 未來市場趨勢
- 專利格局
- 貿易統計(註:僅提供重點國家的貿易統計)
- 主要進口國
- 主要出口國
- 永續性和環境方面
- 永續實踐
- 減少廢棄物策略
- 生產中的能源效率
- 環保舉措
- 碳足跡考量
第4章:競爭格局
- 介紹
- 公司市佔率分析
- 按地區
- 北美洲
- 歐洲
- 亞太地區
- 拉丁美洲
- MEA
- 按地區
- 公司矩陣分析
- 主要市場參與者的競爭分析
- 競爭定位矩陣
- 關鍵進展
- 併購
- 合作夥伴關係與合作
- 新產品發布
- 擴張計劃
第5章:市場估算與預測:依聚合物類型分類,2021-2034年
- 主要趨勢
- 聚偏氟乙烯和鹼性共聚物
- 純PVDF薄膜
- PVDF-HFP共聚物
- 基礎型PVDF複合材料
- P(VDF-TrFE) 高級共聚物
- P(VDF-TrFE)薄膜
- P(VDF-TrFE)奈米纖維
- MEMS相容P(VDF-TrFE)
- 聚合物-陶瓷複合材料
- PVDF-BaTiO3複合材料
- PVDF-ZnO奈米複合材料
- 多相陶瓷-聚合物體系
- 特種和新興聚合物
- 生物基壓電聚合物
- 導電聚合物共混物
- 研究階段新型聚合物
第6章:市場估算與預測:依形式分類,2021-2034年
- 主要趨勢
- 薄膜和膜
- 薄膜(<10 μm)
- 標準薄膜(10-100 μm)
- 厚膜(>100 μm)
- 纖維和紡織品
- 靜電紡絲奈米纖維
- 包芯紗
- 編織壓電織物
- 塊體和複合結構
- 3D列印結構
- 模製部件
- 層狀複合系統
第7章:市場估計與預測:依應用領域分類,2021-2034年
- 主要趨勢
- 穿戴式電子產品
- 智慧紡織品和電子佈料
- 健身追蹤器和健康監測器
- 智慧手錶及配件
- 電子皮膚(e-skin)應用
- 物聯網感測器和無線網路
- 環境監測感測器
- 工業物聯網感測器
- 智慧城市基礎設施感測器
- 農業和遠端監測
- 醫療器械和植入物
- 植入式心臟節律器系統
- 生物感測器和監測設備
- 義肢和輔助設備
- 藥物輸送系統
- 結構健康監測
- 橋樑和基礎設施監測
- 建築結構監測
- 管道和公用設施監測
- 汽車應用
- 輪胎壓力監測系統
- 車輛結構監測
- 車內感測器網路
- 航太與國防
- 飛機結構監測
- 軍事感測器網路
- 空間應用
第8章:市場估算與預測:依地區分類,2021-2034年
- 主要趨勢
- 北美洲
- 美國
- 加拿大
- 歐洲
- 德國
- 英國
- 法國
- 義大利
- 西班牙
- 歐洲其他地區
- 亞太地區
- 中國
- 印度
- 日本
- 澳洲
- 韓國
- 亞太其他地區
- 拉丁美洲
- 巴西
- 墨西哥
- 阿根廷
- 拉丁美洲其他地區
- 中東和非洲
- 沙烏地阿拉伯
- 南非
- 阿拉伯聯合大公國
- 中東和非洲其他地區
第9章:公司簡介
- Solvay SA
- Arkema Group
- 3M Company
- Kureha Corporation
- Daikin Industries
- Smart Material Corp
- Measurement Specialties / TE Connectivity
- PI Ceramic
- Noliac A/S
- CeramTec
- Piezotech SA
- USound GmbH
- EnOcean GmbH
- Energiot Ltd
- Ionix Advanced Technologies
- Johnson Matthey
- Murata Manufacturing
- Morgan Advanced Materials
- Honeywell International
- Others (Harri, etc.)
- Matregenix
- APC International
- Physik Instrumente
- Cedrat Technologies
- Perpetuum
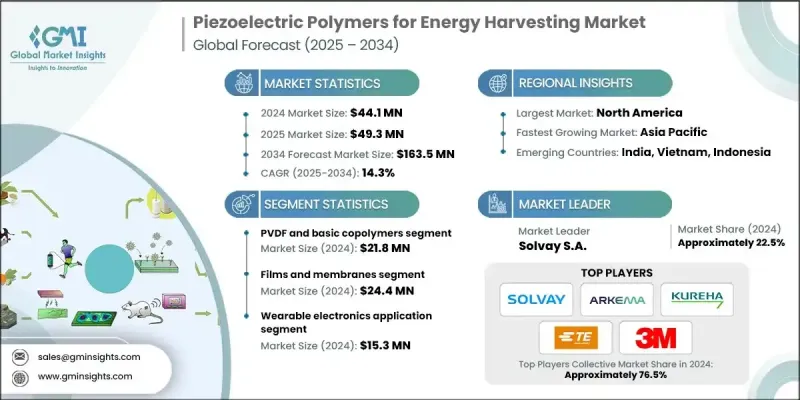
The Global Piezoelectric Polymers for Energy Harvesting Market was valued at USD 44.1 million in 2024 and is estimated to grow at a CAGR of 14.3% to reach USD 163.5 million by 2034.
The market's growth is driven by the expanding adoption of wearables and IoT devices, which require compact, lightweight, and flexible power sources. Piezoelectric polymers offer a sustainable solution for continuous energy generation, enabling sensors, health monitors, and connected devices to operate without frequent battery replacement. Rising demand is particularly evident in consumer electronics, healthcare monitoring, and fitness tracking applications. Enhanced performance of PVDF and PVDF-TrFE polymers has improved mechanical flexibility, durability, and energy conversion efficiency, allowing these materials to power next-generation energy-harvesting systems. Continuous research and material innovations are helping expand commercial adoption, enabling applications in both industrial and consumer electronics sectors. These polymers provide lightweight, versatile, and self-powered solutions that are increasingly preferred for flexible electronics and micro-energy harvesting devices.
| Market Scope | |
|---|---|
| Start Year | 2024 |
| Forecast Year | 2025-2034 |
| Start Value | $44.1 million |
| Forecast Value | $163.5 million |
| CAGR | 14.3% |
The PVDF and basic copolymers segment was valued at USD 21.8 million in 2024 and is expected to grow at a CAGR of 13.9% from 2025 to 2034. These polymers are favored for their reliable piezoelectric performance, adaptability, and ease of processing. They are widely applied in wearables, miniaturized sensors, and consumer electronics, providing efficient, self-sustaining energy solutions. Their cost-effectiveness and versatility support consistent adoption across industrial and consumer applications.
The films and membranes segment reached USD 24.4 million in 2024 and is projected to grow at a CAGR of 14.4% during 2025-2034. Films and membranes are the most used forms because of their flexibility, ease of manufacturing, and compatibility with wearable and electronic systems. They allow compact device designs, easy layering, and patterning to improve energy conversion efficiency. Their use is increasing in smart textiles and flexible electronics, enabling in-device energy generation from user movements.
North America Piezoelectric Polymers for Energy Harvesting Market held a 33.5% share in 2024. Demand in the region is growing as industries adopt self-powered sensing solutions across healthcare, industrial automation, and infrastructure applications. Smart infrastructure, military applications, and wearables are driving adoption in the U.S., supported by strong R&D and regulatory focus on energy efficiency. Investments in smart cities and national infrastructure projects are promoting the integration of polymer-based energy harvesters in sensors across roads, bridges, and urban environments. Manufacturers are enhancing polymer durability and efficiency to ensure long lifespans and reliable performance in harsh conditions, facilitating commercial-scale deployment.
Key players in the Piezoelectric Polymers for Energy Harvesting Market include 3M Company, Arkema Group, TE Connectivity, Kureha Corporation, Solvay S.A., and others. Companies in the Piezoelectric Polymers for Energy Harvesting Market are pursuing several strategies to strengthen their market position. They are investing heavily in R&D to improve energy conversion efficiency, mechanical durability, and material flexibility for next-generation energy harvesters. Partnerships with electronics and wearable device manufacturers help secure adoption in industrial and consumer applications. Firms are diversifying product lines to cater to miniaturized sensors, smart textiles, and flexible electronics. Scaling production capacity, optimizing supply chains, and enhancing cost-effectiveness are further enabling global market penetration.
Table of Contents
Chapter 1 Methodology
- 1.1 Market scope and definition
- 1.2 Research design
- 1.2.1 Research approach
- 1.2.2 Data collection methods
- 1.3 Data mining sources
- 1.3.1 Global
- 1.3.2 Regional/Country
- 1.4 Base estimates and calculations
- 1.4.1 Base year calculation
- 1.4.2 Key trends for market estimation
- 1.5 Primary research and validation
- 1.5.1 Primary sources
- 1.6 Forecast model
- 1.7 Research assumptions and limitations
Chapter 2 Executive Summary
- 2.1 Industry 3600 synopsis
- 2.2 Key market trends
- 2.2.1 Regional
- 2.2.2 Polymer Type
- 2.2.3 Form
- 2.2.4 Application
- 2.3 TAM Analysis, 2025-2034
- 2.4 CXO perspectives: Strategic imperatives
- 2.4.1 Executive decision points
- 2.4.2 Critical success factors
- 2.5 Future Outlook and Strategic Recommendations
Chapter 3 Industry Insights
- 3.1 Industry ecosystem analysis
- 3.1.1 Supplier Landscape
- 3.1.2 Profit Margin
- 3.1.3 Value addition at each stage
- 3.1.4 Factor affecting the value chain
- 3.1.5 Disruptions
- 3.2 Industry impact forces
- 3.2.1 Growth drivers
- 3.2.2 Industry pitfalls and challenges
- 3.2.2.1 Supply chain complexity
- 3.2.3 Market opportunities
- 3.3 Growth potential analysis
- 3.4 Regulatory landscape
- 3.4.1 North America
- 3.4.2 Europe
- 3.4.3 Asia Pacific
- 3.4.4 Latin America
- 3.4.5 Middle East & Africa
- 3.5 Porter's analysis
- 3.6 PESTEL analysis
- 3.6.1 Technology and Innovation landscape
- 3.6.2 Current technological trends
- 3.6.3 Emerging technologies
- 3.7 Price trends
- 3.7.1 By region
- 3.7.2 By product
- 3.8 Future market trends
- 3.9 Patent Landscape
- 3.10 Trade statistics (Note: the trade statistics will be provided for key countries only)
- 3.10.1 Major importing countries
- 3.10.2 Major exporting countries
- 3.11 Sustainability and Environmental Aspects
- 3.11.1 Sustainable Practices
- 3.11.2 Waste Reduction Strategies
- 3.11.3 Energy Efficiency in Production
- 3.11.4 Eco-friendly Initiatives
- 3.12 Carbon Footprint Considerations
Chapter 4 Competitive Landscape, 2024
- 4.1 Introduction
- 4.2 Company market share analysis
- 4.2.1 By region
- 4.2.1.1 North America
- 4.2.1.2 Europe
- 4.2.1.3 Asia Pacific
- 4.2.1.4 LATAM
- 4.2.1.5 MEA
- 4.2.1 By region
- 4.3 Company matrix analysis
- 4.4 Competitive analysis of major market players
- 4.5 Competitive positioning matrix
- 4.6 Key developments
- 4.6.1 Mergers & acquisitions
- 4.6.2 Partnerships & collaborations
- 4.6.3 New Product Launches
- 4.6.4 Expansion Plans
Chapter 5 Market Estimates and Forecast, By Polymer Type, 2021 - 2034 (USD Million, Kilo Tons)
- 5.1 Key trends
- 5.2 PVDF and Basic Copolymers
- 5.2.1 Pure PVDF Films
- 5.2.2 PVDF-HFP Copolymers
- 5.2.3 Basic PVDF Composites
- 5.3 P(VDF-TrFE) Advanced Copolymers
- 5.3.1 P(VDF-TrFE) Thin Films
- 5.3.2 P(VDF-TrFE) Nanofibers
- 5.3.3 MEMS-Compatible P(VDF-TrFE)
- 5.4 Polymer-Ceramic Composites
- 5.4.1 PVDF-BaTiO3 Composites
- 5.4.2 PVDF-ZnO Nanocomposites
- 5.4.3 Multi-phase Ceramic-Polymer Systems
- 5.5 Specialty and Emerging Polymers
- 5.5.1 Bio-based Piezoelectric Polymers
- 5.5.2 Conductive Polymer Blends
- 5.5.3 Research-stage Novel Polymers
Chapter 6 Market Estimates and Forecast, By Form, 2021 - 2034 (USD Million, Kilo Tons)
- 6.1 Key trends
- 6.2 Films and membranes
- 6.2.1 Thin films (<10 μm)
- 6.2.2 Standard films (10-100 μm)
- 6.2.3 Thick films (>100 μm)
- 6.3 Fibers and textiles
- 6.3.1 Electrospun nanofibers
- 6.3.2 Core-spun yarns
- 6.3.3 Woven piezoelectric fabrics
- 6.4 Bulk and composite structures
- 6.4.1 3D-printed structures
- 6.4.2 Molded components
- 6.4.3 Layered composite systems
Chapter 7 Market Estimates and Forecast, By Application, 2021 - 2034 (USD Million, , Kilo Tons)
- 7.1 Key trends
- 7.2 Wearable electronics
- 7.2.1 Smart textiles and e-fabrics
- 7.2.2 Fitness trackers and health monitors
- 7.2.3 Smart watches and accessories
- 7.2.4 Electronic skin (e-skin) applications
- 7.3 IoT sensors and wireless networks
- 7.3.1 Environmental monitoring sensors
- 7.3.2 Industrial IoT sensors
- 7.3.3 Smart city infrastructure sensors
- 7.3.4 Agricultural and remote monitoring
- 7.4 Medical devices and implants
- 7.4.1 Implantable pacemaker systems
- 7.4.2 Biosensors and monitoring devices
- 7.4.3 Prosthetics and assistive devices
- 7.4.4 Drug delivery systems
- 7.5 Structural health monitoring
- 7.5.1 Bridge and infrastructure monitoring
- 7.5.2 Building structural monitoring
- 7.5.3 Pipeline and utility monitoring
- 7.6 Automotive applications
- 7.6.1 Tire pressure monitoring systems
- 7.6.2 Vehicle structural monitoring
- 7.6.3 In-cabin sensor networks
- 7.7 Aerospace and defense
- 7.7.1 Aircraft structural monitoring
- 7.7.2 Military sensor networks
- 7.7.3 Space applications
Chapter 8 Market Estimates and Forecast, By Region, 2021 - 2034 (USD Million, Kilo Tons)
- 8.1 Key trends
- 8.2 North America
- 8.2.1 U.S.
- 8.2.2 Canada
- 8.3 Europe
- 8.3.1 Germany
- 8.3.2 UK
- 8.3.3 France
- 8.3.4 Italy
- 8.3.5 Spain
- 8.3.6 Rest of Europe
- 8.4 Asia Pacific
- 8.4.1 China
- 8.4.2 India
- 8.4.3 Japan
- 8.4.4 Australia
- 8.4.5 South Korea
- 8.4.6 Rest of Asia Pacific
- 8.5 Latin America
- 8.5.1 Brazil
- 8.5.2 Mexico
- 8.5.3 Argentina
- 8.5.4 Rest of Latin America
- 8.6 Middle East & Africa
- 8.6.1 Saudi Arabia
- 8.6.2 South Africa
- 8.6.3 UAE
- 8.6.4 Rest of Middle East & Africa
Chapter 9 Company Profiles
- 9.1 Solvay S.A.
- 9.2 Arkema Group
- 9.3 3M Company
- 9.4 Kureha Corporation
- 9.5 Daikin Industries
- 9.6 Smart Material Corp
- 9.7 Measurement Specialties / TE Connectivity
- 9.8 PI Ceramic
- 9.9 Noliac A/S
- 9.10 CeramTec
- 9.11 Piezotech S.A.
- 9.12 USound GmbH
- 9.13 EnOcean GmbH
- 9.14 Energiot Ltd
- 9.15 Ionix Advanced Technologies
- 9.16 Johnson Matthey
- 9.17 Murata Manufacturing
- 9.18 Morgan Advanced Materials
- 9.19 Honeywell International
- 9.20 Others (Harri, etc.)
- 9.21 Matregenix
- 9.22 APC International
- 9.23 Physik Instrumente
- 9.24 Cedrat Technologies
- 9.25 Perpetuum
 2026年全球月球能量收集市場報告
 先進儲能材料市場預測至2034年—按材料類型、技術、應用、最終用戶和地區分類的全球分析
 汽車能源採集與再生市場:2026-2032年全球市場預測(按技術、車輛類型、推進系統、應用和最終用戶分類)2034年全球月球能量採集市場機會與策略
 全球能源採集系統市場:按應用、終端用途系統、組件、技術、振動技術、國家和地區分類-產業分析、市場規模、佔有率和預測(2025-2032年)
 全球能量採集系統市場:市場規模、佔有率、成長率、產業分析、依類型、應用和地區劃分的分析以及未來預測(2026-2034 年)
 振動能量採集系統市場-全球產業規模、佔有率、趨勢、機會及預測(依產品、應用、區域及競爭格局分類,2021-2031年)
 微型太陽能發電市場規模、佔有率及成長分析(按應用和地區分類)-2026-2033年產業預測
 能源採集市場規模、佔有率和成長分析(按技術、組件、應用、最終用戶和地區分類)-2026-2033年產業預測
 能源採集系統市場規模、佔有率及成長分析(依技術、組件、最終用途、應用及地區分類)-2026-2033年產業預測