


 |
市場調查報告書
商品編碼
1801883
海水水產養殖市場機會、成長動力、產業趨勢分析及 2025 - 2034 年預測Saltwater Aquaculture Market Opportunity, Growth Drivers, Industry Trend Analysis, and Forecast 2025 - 2034 |
||||||
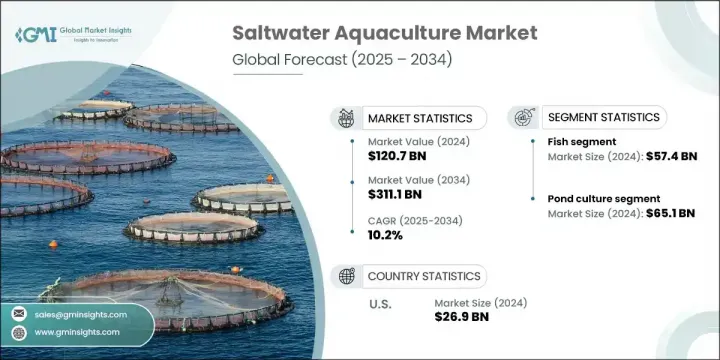
2024年,全球海水水產養殖市場規模達1,207億美元,預計到2034年將以10.2%的複合年成長率成長,達到3,111億美元。這一成長得益於政府的大力支持和旨在促進永續海洋食品體系發展的漸進式政策調整。各國正將海水水產養殖列為更廣泛的糧食安全和氣候調適戰略的優先事項,力求將其打造為面向未來糧食生產的關鍵支柱。離岸箱網養殖、循環水養殖系統(RAS)和綜合多營養級水產養殖(IMTA)等技術的持續創新,拓展了市場的能力。這些系統正在提高產量,最大限度地減少環境足跡,並開闢出通往曾經被認為不適合海水養殖的海域的途徑。
在聯邦機構的支持下,生產者如今受益於專注於飼料替代品、孵化場開發和區域規劃改進的研究。這些進步正在將傳統營運模式轉變為精準水產養殖模式,從而實現可擴展且永續的生產。然而,儘管取得了進展,水產養殖業者仍然面臨與環境保護和分區規劃相關的複雜監管挑戰。這些聯邦、州和地方的層層監管雖然對保護生態系統至關重要,但往往會延長許可核准時間並增加營運成本,尤其對於新進業者而言。
| 市場範圍 | |
|---|---|
| 起始年份 | 2024 |
| 預測年份 | 2025-2034 |
| 起始值 | 1207億美元 |
| 預測值 | 3111億美元 |
| 複合年成長率 | 10.2% |
2024年,魚類市場產值達574億美元,預計到2034年將以9.7%的複合年成長率成長。鱸魚、鮪魚和鮭魚等魚類憑藉其營養價值、烹飪適應性和廣泛供應,繼續主導消費市場。與軟體動物和甲殼類動物相比,許多魚類擁有更高的飼料轉換率,從而降低了生產成本,並最大限度地提高了養殖戶的收益。業內專家將魚類養殖的主導地位歸因於疾病控制、孵化場效率和離岸網箱系統等技術進步的堅實基礎。魚類產品,尤其是羅非魚和鮭魚,也因高效的冷鏈和廣泛接受的認證協議而獲得了全球關注,使其成為全球交易量最大的水產養殖產品之一。
2024年,池塘養殖領域產值達651億美元,佔54%,成為海水水產養殖的主要方式。與離岸網箱或循環水系統(RAS)等高科技系統相比,池塘養殖的資本投入較低,使其成為新興經濟體和中小型養殖戶的首選。池塘養殖方式更容易水質控制和投餵安排,在缺乏先進水產養殖技術的地區更為實用。政府支持的水產養殖計畫通常青睞池塘系統,因為其可擴展性、成本效益高,並且能夠支持包括魚類、軟體動物和甲殼類動物在內的多種物種。這種適應性使生產者能夠應對環境變化和不斷變化的市場需求。
2024年,美國海水水產養殖市場規模達2,69億美元,預計到2034年將以9.2%的複合年成長率成長。美國市場的成長動力源自於政府資助的研究、消費者對永續養殖海鮮日益成長的需求,以及水產養殖技術的穩定創新。在更有效率的飼料系統和疾病管理工具的支持下,海藻、貝類和鱸魚等品種的養殖也正在蓬勃發展,市場也因此受益。展望未來,美國預計將進一步傾向離岸養殖、陸基循環系統以及高階增值海鮮的開發。
全球海水水產養殖市場的領先公司包括 Marine Harvest ASA (Mowi)、Yalelo Zambia、Cooke Aquaculture Inc.、Nippon Suisan Kaisha, Ltd.、Cermaq Group AS、Grieg Seafood ASA、P/F Bakkafrost、PHARMAQ (Zoetis)、Grieg Seafood ASA、P/F Bakkafrost、PHARMAQ (Zoetis)、LeIm. Ltda.、Innovasea、Nueva Pescanova 和 Aller Aqua。海水水產養殖市場的產業領導者正在採取多管齊下的策略來鞏固其全球影響力。公司優先投資下一代水產養殖技術,如人工智慧監控、RAS 和離岸養殖,以提高產量並減少生態影響。策略性收購和區域擴張也在進行中,以挖掘新的消費者群體並加強供應鏈控制。公司正在透過從孵化場到收穫再到零售的垂直整合營運來增強價值主張,從而可以改善品質保證和成本管理。
目錄
第1章:方法論與範圍
第2章:執行摘要
第3章:行業洞察
- 產業生態系統分析
- 供應商格局
- 利潤率
- 每個階段的增值
- 影響價值鏈的因素
- 中斷
- 產業影響力量
- 成長動力
- 產業陷阱與挑戰
- 機會
- 成長潛力分析
- 未來市場趨勢
- 技術和創新格局
- 當前的技術趨勢
- 新興技術
- 價格趨勢
- 按地區和產品類型
- 監理框架
- 標準和認證
- 環境法規
- 進出口法規
- 波特的分析
- PESTEL分析
- 消費者行為分析
- 購買模式
- 偏好分析
- 消費者行為的區域差異
- 電子商務對購買決策的影響
第4章:競爭格局
- 介紹
- 公司市佔率分析
- 按地區
- 公司矩陣分析
- 主要市場參與者的競爭分析
- 競爭定位矩陣
- 關鍵進展
- 併購
- 夥伴關係與合作
- 新產品發布
- 擴張計劃
第5章:市場估計與預測:依養殖種類,2021 - 2034 年
- 主要趨勢
- 魚
- 甲殼類動物
- 軟體動物
- 海藻
- 水生植物
- 其他(青蛙、鰻魚等)
第6章:市場估計與預測:按文化系統,2021 - 2034 年
- 主要趨勢
- 網欄養殖
- 池塘養殖
- 浮式網箱養殖
- 循環水養殖系統(RAS)
- 綜合多營養水產養殖(IMTA)
- 其他
第7章:市場估計與預測:依環境,2021 - 2034 年
- 主要趨勢
- 海水
- 鹹水
- 混合水系統
第8章:市場估計與預測:依最終用途,2021 - 2034 年
- 主要趨勢
- 食品服務
- 零售
- 藥品和營養保健品
- 化妝品和個人護理
- 其他
第9章:市場估計與預測:按配銷通路,2021 - 2034 年
- 主要趨勢
- 直銷
- 間接銷售
第10章:市場估計與預測:按地區,2021 - 2034 年
- 主要趨勢
- 北美洲
- 美國
- 加拿大
- 歐洲
- 德國
- 英國
- 法國
- 義大利
- 西班牙
- 荷蘭
- 亞太地區
- 中國
- 印度
- 日本
- 韓國
- 澳洲
- 拉丁美洲
- 巴西
- 墨西哥
- 阿根廷
- MEA
- 阿拉伯聯合大公國
- 沙烏地阿拉伯
- 南非
第 11 章:公司簡介
- Aller Aqua
- Cermaq Group AS
- Cooke Aquaculture Inc.
- GeneSeas Aquacultura Ltda.
- Grieg Seafood ASA
- Huon Aquaculture Group Ltd.
- Innovasea
- Leroy Seafood Group ASA
- Marine Harvest ASA (Mowi)
- Nippon Suisan Kaisha, Ltd.
- Nueva Pescanova
- P/F Bakkafrost
- PHARMAQ (Zoetis)
- SalMar ASA
- Yalelo Zambia
The Global Saltwater Aquaculture Market was valued at USD 120.7 billion in 2024 and is estimated to grow at a CAGR of 10.2% to reach USD 311.1 billion by 2034. This growth is being fueled by strong government support and progressive policy alignment aimed at boosting sustainable marine food systems. Countries are prioritizing marine aquaculture as part of broader food security and climate adaptation strategies, helping to establish it as a critical pillar in future-ready food production. Continued innovation across technologies such as offshore cage farming, recirculating aquaculture systems (RAS), and integrated multi-trophic aquaculture (IMTA) has expanded the market's capabilities. These systems are increasing yields, minimizing environmental footprint, and unlocking access to areas once deemed unsuitable for marine farming.
With the support of federal agencies, producers now benefit from research focused on feed alternatives, hatchery development, and improved zone planning. These advances are transforming traditional operations into precision aquaculture models, allowing for scalable yet sustainable production. However, despite the progress, aquaculture operators still contend with complex regulatory challenges tied to environmental protection and zoning. These layers of federal, state, and local regulation-while critical to preserving ecosystems-often extend permitting timelines and raise operational costs, especially for new entrants.
| Market Scope | |
|---|---|
| Start Year | 2024 |
| Forecast Year | 2025-2034 |
| Start Value | $120.7 Billion |
| Forecast Value | $311.1 Billion |
| CAGR | 10.2% |
In 2024, the fish segment generated USD 57.4 billion and is forecasted to grow at a CAGR of 9.7% through 2034. Species such as sea bass, tuna, and salmon continue to dominate consumer markets thanks to their nutritional value, culinary adaptability, and widespread availability. Compared to mollusks and crustaceans, many fish species offer better feed conversion ratios, reducing production costs and maximizing returns for farmers. Industry experts have attributed fish farming's dominance to a strong foundation of technological improvements in disease control, hatchery efficiency, and offshore cage systems. Fish products, particularly tilapia and salmon, have also gained global traction due to efficient cold chains and widely accepted certification protocols, making them among the top-traded aquaculture goods worldwide.
The pond culture segment generated USD 65.1 billion and a 54% share in 2024, emerged as the top method for saltwater aquaculture production. The lower capital investment compared to high-tech systems such as offshore cages or RAS makes it a preferred approach in emerging economies and among small-to-medium-scale producers. Pond setups allow for simpler water quality control and feeding schedules, making them more practical in areas lacking access to advanced aquaculture technologies. Government-supported aquaculture initiatives often favor pond systems for their scalability, cost-effectiveness, and ability to support diverse species including finfish, mollusks, and crustaceans. This adaptability allows producers to react to both environmental changes and shifting market demands.
United States Saltwater Aquaculture Market was valued at USD 26.9 billion in 2024 and is anticipated to grow at a CAGR of 9.2% through 2034. Growth in the US market is being driven by a combination of government-funded research, increasing consumer demand for sustainably farmed seafood, and steady innovation in aquaculture technologies. The market is also benefiting from expansion into species like seaweed, shellfish, and sea bass, supported by more efficient feed systems and disease management tools. Looking ahead, the US is expected to lean further into offshore production, land-based recirculating systems, and development of premium value-added seafood products.
Leading companies in the Global Saltwater Aquaculture Market include Marine Harvest ASA (Mowi), Yalelo Zambia, Cooke Aquaculture Inc., Nippon Suisan Kaisha, Ltd., Cermaq Group AS, Grieg Seafood ASA, P/F Bakkafrost, PHARMAQ (Zoetis), Leroy Seafood Group ASA, SalMar ASA, Huon Aquaculture Group Ltd., GeneSeas Aquacultura Ltda., Innovasea, Nueva Pescanova, and Aller Aqua. Industry leaders in the saltwater aquaculture market are adopting multi-pronged strategies to solidify their global footprint. Companies are prioritizing investment in next-generation aquaculture technologies like AI-powered monitoring, RAS, and offshore farming to boost yield and reduce ecological impact. Strategic acquisitions and regional expansions are also underway to tap into new consumer bases and strengthen supply chain control. Firms are enhancing value propositions through vertically integrated operations-from hatchery to harvest to retail-which allows for improved quality assurance and cost management.
Table of Contents
Chapter 1 Methodology & Scope
- 1.1 Market scope and definition
- 1.2 Research design
- 1.2.1 Research approach
- 1.2.2 Data collection methods
- 1.3 Data mining sources
- 1.3.1 Global
- 1.3.2 Regional/Country
- 1.4 Base estimates and calculations
- 1.4.1 Base year calculation
- 1.4.2 Key trends for market estimation
- 1.5 Primary research and validation
- 1.5.1 Primary sources
- 1.6 Forecast model
- 1.7 Research assumptions and limitations
Chapter 2 Executive Summary
- 2.1 Industry 3600 synopsis
- 2.2 Key market trends
- 2.2.1 Species cultured
- 2.2.2 Culture systems
- 2.2.3 Environment
- 2.2.4 End use
- 2.2.5 Distribution channel
- 2.2.6 Regional
- 2.3 CXO perspective: Strategic imperatives
- 2.3.1 Key decision points for industry executives
- 2.3.2 Critical success factors for market players
- 2.4 Future outlook and strategic recommendations
Chapter 3 Industry Insights
- 3.1 Industry ecosystem analysis
- 3.1.1 Supplier landscape
- 3.1.2 Profit margin
- 3.1.3 Value addition at each stage
- 3.1.4 Factor affecting the value chain
- 3.1.5 Disruptions
- 3.2 Industry Impact forces
- 3.2.1 Growth drivers
- 3.2.2 Industry pitfalls & challenges
- 3.2.3 Opportunities
- 3.3 Growth potential analysis
- 3.4 Future market trends
- 3.5 Technology and innovation landscape
- 3.5.1 Current technological trends
- 3.5.2 Emerging technologies
- 3.6 Price trends
- 3.6.1 By region and product type
- 3.7 Regulatory framework
- 3.7.1 Standards and certifications
- 3.7.2 Environmental regulations
- 3.7.3 Import export regulations
- 3.8 Porter’s analysis
- 3.9 PESTEL analysis
- 3.10 Consumer behavior analysis
- 3.10.1 Purchasing patterns
- 3.10.2 Preference analysis
- 3.10.3 Regional variations in consumer behavior
- 3.10.4 Impact of e-commerce on buying decisions
Chapter 4 Competitive Landscape, 2024
- 4.1 Introduction
- 4.2 Company market share analysis
- 4.2.1 By region
- 4.2.1.1 North America
- 4.2.1.2 Europe
- 4.2.1.3 Asia Pacific
- 4.2.1.4 Latin America
- 4.2.1.5 Middle East and Africa
- 4.2.1 By region
- 4.3 Company matrix analysis
- 4.4 Competitive analysis of major market players
- 4.5 Competitive positioning matrix
- 4.6 Key developments
- 4.6.1 Mergers & acquisitions
- 4.6.2 Partnerships & collaborations
- 4.6.3 New Product Launches
- 4.6.4 Expansion Plans
Chapter 5 Market Estimates & Forecast, By Species Cultured, 2021 - 2034 (USD Billion) (Million Tons)
- 5.1 Key trends
- 5.2 Fish
- 5.3 Crustaceans
- 5.4 Mollusks
- 5.5 Seaweed
- 5.6 Aquatic plants
- 5.7 Others (Frogs, Eels, etc.)
Chapter 6 Market Estimates & Forecast, By Culture Systems, 2021 - 2034 (USD Billion) (Million Tons)
- 6.1 Key trends
- 6.2 Pen culture
- 6.3 Pond culture
- 6.4 Floating cage culture
- 6.5 Recirculating aquaculture systems (RAS)
- 6.6 Integrated multi-trophic aquaculture (IMTA)
- 6.7 Others
Chapter 7 Market Estimates & Forecast, By Environment, 2021 - 2034 (USD Billion) (Million Tons)
- 7.1 Key trends
- 7.2 Marine water
- 7.3 Brackish water
- 7.4 Mixed water systems
Chapter 8 Market Estimates & Forecast, By End Use, 2021 - 2034, (USD Billion) (Million Tons)
- 8.1 Key trends
- 8.2 Food Services
- 8.3 Retail
- 8.4 Pharmaceutical and nutraceuticals
- 8.5 Cosmetics and personal care
- 8.6 Others
Chapter 9 Market Estimates & Forecast, By Distribution Channel, 2021 - 2034, (USD Billion) (Million Tons)
- 9.1 Key trends
- 9.2 Direct sales
- 9.3 Indirect sales
Chapter 10 Market Estimates & Forecast, By Region, 2021 - 2034, (USD Billion) (Million Tons)
- 10.1 Key trends
- 10.2 North America
- 10.2.1 U.S.
- 10.2.2 Canada
- 10.3 Europe
- 10.3.1 Germany
- 10.3.2 U.K.
- 10.3.3 France
- 10.3.4 Italy
- 10.3.5 Spain
- 10.3.6 Netherlands
- 10.4 Asia Pacific
- 10.4.1 China
- 10.4.2 India
- 10.4.3 Japan
- 10.4.4 South Korea
- 10.4.5 Australia
- 10.5 Latin America
- 10.5.1 Brazil
- 10.5.2 Mexico
- 10.5.3 Argentina
- 10.6 MEA
- 10.6.1 UAE
- 10.6.2 Saudi Arabia
- 10.6.3 South Africa
Chapter 11 Company Profiles (Business Overview, Financial Data, Product Landscape, Strategic Outlook, SWOT Analysis)
- 11.1 Aller Aqua
- 11.2 Cermaq Group AS
- 11.3 Cooke Aquaculture Inc.
- 11.4 GeneSeas Aquacultura Ltda.
- 11.5 Grieg Seafood ASA
- 11.6 Huon Aquaculture Group Ltd.
- 11.7 Innovasea
- 11.8 Leroy Seafood Group ASA
- 11.9 Marine Harvest ASA (Mowi)
- 11.10 Nippon Suisan Kaisha, Ltd.
- 11.11 Nueva Pescanova
- 11.12 P/F Bakkafrost
- 11.13 PHARMAQ (Zoetis)
- 11.14 SalMar ASA
- 11.15 Yalelo Zambia
 水產養殖市場-全球產業規模、佔有率、趨勢、機會及預測,依環境、魚類種類、地區及競爭格局分類,2020-2030年預測
 水產養殖:全球市場佔有率和排名、總收入和需求預測(2025-2031 年)
 鮭魚飼料市場分析與預測(至2034年):類型、產品、技術、成分、應用、形式、材料類型、製程、最終用戶、解決方案
 2032 年海藻包裝市場預測:按來源、包裝類型、應用、最終用戶和地區分類的全球分析全球海藻食用包裝市場:未來預測(至 2032 年)—按產地、包裝類型、分銷管道、應用和地區分析海洋養殖市場-全球產業規模、佔有率、趨勢、機會及預測(按產品類型、養殖系統、地區和競爭情況分類,2020-2030 年預測)2034年水產養殖市場分析及預測:類型、產品、服務、技術、組件、應用、流程、最終用戶、設備2032 年再生永續水產養殖市場預測:按產品類型、成分、物種、環境和地區進行的全球分析
 2021 - 2031 年北美水產養殖市場規模及預測、區域佔有率、趨勢及成長機會分析報告範圍:依產品類型及養殖環境有機魚市場-全球產業規模、佔有率、趨勢、機會和預測,按產品類型(鮭魚、鮪魚、其他)、按配銷通路(線上、線下)、按形式(新鮮/冷藏、冷凍、加工)、按地區和競爭,2020-2030F