


 |
市場調查報告書
商品編碼
1773463
食物不耐受產品市場機會、成長動力、產業趨勢分析及 2025 - 2034 年預測Food Intolerance Products Market Opportunity, Growth Drivers, Industry Trend Analysis, and Forecast 2025 - 2034 |
||||||
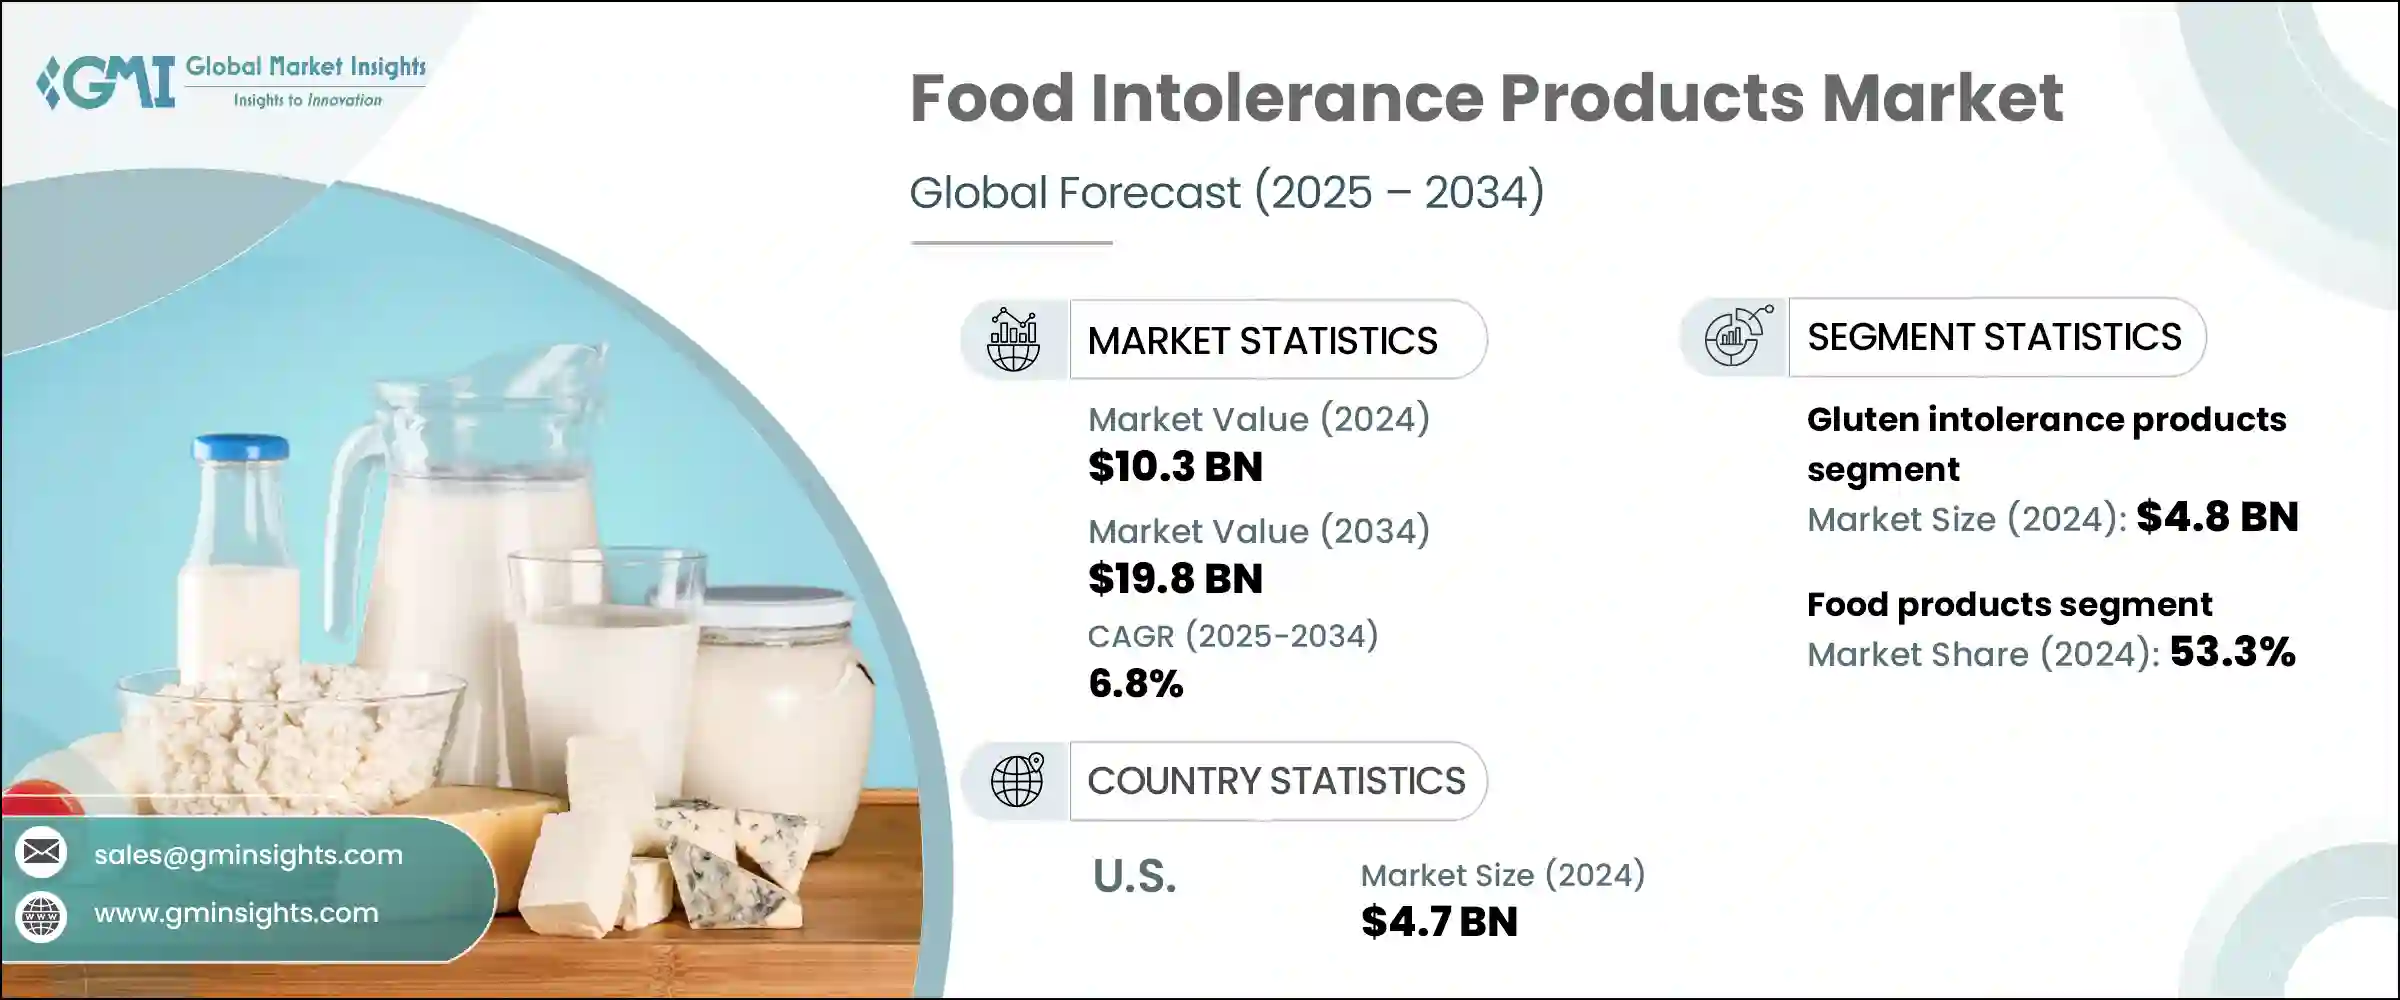
2024年,全球食物不耐受產品市場規模達103億美元,預計2034年將以6.8%的複合年成長率成長,達到198億美元。由於消費者對食物敏感性的認知度不斷提升,以及對個人化營養的需求日益成長,該市場持續成長。隨著診斷工具的改進和飲食偏好的演變,越來越多的消費者開始尋求針對特定不耐症情況(例如麩質、乳糖和低聚果糖(FODMAP)相關問題)量身定做的產品。向清潔標籤、無過敏原和功能性食品的轉變正成為決定性因素,尤其是在注重健康的消費者尋求不僅避免過敏成分,而且符合健康趨勢的產品的情況下。這些產品如今已成為健康飲食領域的重要組成部分。
大部分市場價值仍來自穀物、乳製品替代品、零食和烘焙食品等有形食品,這些產品在零售和餐飲服務領域都需求強勁。同時,儘管補充劑和消化支持劑的市場佔有率仍然較小,但它們繼續受到那些應對更複雜食物過敏問題的消費者的關注。這些細分市場正在見證越來越多的產品上市,這些產品專注於改善消化功能,並為患有鮮為人知或多方面不耐受症狀的人提供緩解。
| 市場範圍 | |
|---|---|
| 起始年份 | 2024 |
| 預測年份 | 2025-2034 |
| 起始值 | 103億美元 |
| 預測值 | 198億美元 |
| 複合年成長率 | 6.8% |
2024年,麩質不耐症產品市值達48億美元,預計2025年至2034年期間的複合年成長率將達到6.6%。由於人們對麩質相關疾病的認知和診斷不斷提高,以及無麩質飲食的生活方式日益普及,因此市場佔據主導地位。該領域掀起了一波創新浪潮,尤其是在改善無麩質零食、烘焙食品和即食食品的口味、質地和營養成分方面,這推動了消費者的長期興趣和品牌忠誠度。
食物不耐受產品市場的食品細分市場在2024年創收54億美元,預計2034年將維持7%的複合年成長率,佔53.3%的市場。隨著人們食物敏感性意識的不斷提高,以及乳糜瀉和乳糖不耐受等飲食疾病的日益流行,該細分市場持續蓬勃發展。各大品牌正積極拓展其產品線,推出注重過敏原的產品,例如植物性乳製品替代品、無麩質零食以及不含常見刺激物的烘焙食品。隨著企業加強研發力度,開發兼顧健康需求和口味偏好的食品,需求與現有選擇之間的差距正逐漸縮小。
2024年,美國食物不耐受產品市場規模達47億美元,預計2025年至2034年期間的複合年成長率將達到6.9%。這一顯著成長得益於消費者教育水平的提高、注重健康的飲食習慣以及越來越多的人意識到食物過敏。美國消費者在飲食選擇上越來越挑剔,促使企業加大對產品多樣化和創新的投資。因此,生產者必須滿足特定的營養需求,這導致全國各地出現了更多針對性的食物不耐症產品。
食物不耐受產品行業的領先公司包括 Lifeway Foods, Inc.、McNeil Consumer Healthcare Lactaid、General Mills, Inc.、Danone SA 和 Nestle SA。這些品牌正積極致力於擴大其在這個充滿活力的市場的影響力。為了鞏固其地位,食物不耐症領域的主要參與者正在使用一系列有針對性的策略。他們正在擴大產品組合以滿足新出現的不耐受問題,投資研發以改善無過敏原食品的口味和質地,並與營養師和醫療保健專業人士合作以提高信譽。該公司也採用清潔標籤做法,並利用數位平台與注重健康的受眾互動。許多公司正在收購利基品牌並推出專門的產品線以滿足不斷變化的消費者需求,同時也增加其在電子商務和零售貨架上的存在,以最大限度地擴大影響力和知名度。
目錄
第1章:方法論與範圍
第2章:執行摘要
第3章:行業洞察
- 產業生態系統分析
- 供應商格局
- 利潤率
- 每個階段的增值
- 影響價值鏈的因素
- 中斷
- 產業衝擊力
- 成長動力
- 食物不耐受和過敏的盛行率不斷上升
- 意識和診斷率不斷提高
- 無添加產品的需求不斷增加
- 擴大產品供應與種類
- 產業陷阱與挑戰
- 特色產品的溢價定價
- 配方和口味挑戰
- 市場機會
- 成長動力
- 成長潛力分析
- 監管格局
- 北美洲
- 歐洲
- 亞太地區
- 拉丁美洲
- 中東和非洲
- 波特的分析
- Pestel 分析
- 價格趨勢
- 未來市場趨勢
- 技術和創新格局
- 當前的技術趨勢
- 新興技術
- 專利格局
- 貿易統計(HS編碼)(註:僅提供重點國家的貿易統計資料)
- 主要進口國
- 主要出口國
- 永續性和環境方面
- 永續實踐
- 減少廢棄物的策略
- 生產中的能源效率
- 環保舉措
第4章:競爭格局
- 介紹
- 公司市佔率分析
- 按地區
- 北美洲
- 歐洲
- 亞太地區
- 拉丁美洲
- MEA
- 按地區
- 公司矩陣分析
- 主要市場參與者的競爭分析
- 競爭定位矩陣
- 關鍵進展
- 併購
- 夥伴關係與合作
- 新產品發布
- 擴張計劃
第5章:市場估計與預測:按不耐受類型,2021-2034 年
- 主要趨勢
- 乳糖不耐症產品
- 麩質不耐症產品
- Fodmap 不耐受產品
- 組織胺不耐受產品
- 亞硫酸鹽不耐受產品
- 其他不耐受產品
第6章:市場估計與預測:依產品類別,2021-2034 年
- 主要趨勢
- 食品
- 烘焙和穀物產品
- 麵包和烘焙食品
- 早餐麥片和格蘭諾拉麥片
- 餅乾和薄脆餅乾
- 其他烘焙產品
- 乳製品替代品
- 牛奶替代品
- 起司替代品
- 優格替代品
- 冰淇淋和甜點替代品
- 其他乳製品替代品
- 零食和簡便食品
- 薯片和鹹味小吃
- 營養和蛋白質棒
- 即食食品和預製食品
- 其他零食產品
- 調味品、調味汁和醬汁
- 糖果和甜點
- 嬰兒食品和嬰兒配方奶粉
- 其他食品
- 烘焙和穀物產品
- 飲料
- 植物奶
- 果汁和蔬菜汁
- 功能性飲料
- 其他飲料
- 補充劑和消化助劑
- 消化酵素
- 益生菌和益生元
- 其他補充劑
第7章:市場估計與預測:按配銷通路,2021-2034
- 主要趨勢
- 超市和大賣場
- 專賣店及保健食品店
- 便利商店
- 網路零售
- 電子商務平台
- 直接面對消費者的網站
- 訂閱服務
- 藥局和藥局
- 餐飲和HoReCa
- 其他
第8章:市場估計與預測:按地區,2021-2034
- 主要趨勢
- 北美洲
- 美國
- 加拿大
- 歐洲
- 英國
- 德國
- 法國
- 義大利
- 西班牙
- 荷蘭
- 歐洲其他地區
- 亞太地區
- 中國
- 印度
- 日本
- 韓國
- 澳洲
- 亞太其他地區
- 拉丁美洲
- 巴西
- 墨西哥
- 阿根廷
- 拉丁美洲其他地區
- 中東和非洲
- 南非
- 沙烏地阿拉伯
- 阿拉伯聯合大公國
- 中東和非洲其他地區
第9章:公司簡介
- Alpro
- Amy's Kitchen, Inc.
- Conagra Brands, Inc.
- Daiya Foods Inc.
- Danone SA
- Dr. Schar AG/SPA
- Enjoy Life Foods (Mondelez International)
- Follow Your Heart
- Fody Food Co.
- General Mills, Inc.
- Glutino (The Glutino Food Group)
- Kellogg Company
- Lactaid (McNeil Nutritionals, LLC)
- Mondelez International, Inc.
- Nestle SA
- Oatly Group AB
- The Hain Celestial Group, Inc.
- The Kraft Heinz Company
- The Lactalis Group
- Udis Gluten Free (Boulder Brands, Inc.)
The Global Food Intolerance Products Market was valued at USD 10.3 billion in 2024 and is estimated to grow at a CAGR of 6.8% to reach USD 19.8 billion by 2034. This market has been experiencing consistent growth, fueled by increased consumer awareness of food sensitivities and a broader demand for personalized nutrition. As diagnostic tools improve and dietary preferences evolve, more consumers are turning to products tailored to specific intolerances, such as gluten, lactose, and FODMAP-related issues. The shift toward clean-label, allergen-free, and functional food is becoming a defining factor, especially as health-conscious shoppers look for items that not only avoid triggering ingredients but also align with wellness trends. These products have now become a vital part of the larger healthy eating category.
Most of the market's value still comes from tangible food items such as cereals, dairy substitutes, snack products, and baked goods, which enjoy strong demand from both retail and food service sectors. At the same time, although still a smaller segment, supplements and digestive support aids continue to gain attention from consumers managing more complex food sensitivities. These segments are witnessing increased product launches focused on improving digestion and offering relief for individuals with lesser-known or multi-faceted intolerances.
| Market Scope | |
|---|---|
| Start Year | 2024 |
| Forecast Year | 2025-2034 |
| Start Value | $10.3 Billion |
| Forecast Value | $19.8 Billion |
| CAGR | 6.8% |
In 2024, the gluten intolerance products segment was valued at USD 4.8 billion and is forecasted to grow at a CAGR of 6.6% between 2025 and 2034. This segment dominates because of the growing awareness and diagnosis of gluten-related disorders and the lifestyle adoption of gluten-free diets. There's been a wave of innovation in this space, particularly around improving taste, texture, and nutritional content in gluten-free snacks, bakery items, and ready-to-eat meals, driving long-term consumer interest and brand loyalty.
The food products segment in the food intolerance products market generated USD 5.4 billion in 2024 and is expected to maintain a 7% CAGR through 2034, accounting for a 53.3% share. This segment continues to thrive due to rising food sensitivity awareness and the increasing prevalence of dietary conditions like celiac disease and lactose intolerance. Brands are aggressively expanding their lines with allergen-conscious offerings, such as plant-based dairy alternatives, gluten-free snacks, and baked goods formulated without common irritants. The gap between demand and available options is gradually narrowing as companies step up to develop foods that meet both health needs and taste preferences.
United States Food Intolerance Products Market was valued at USD 4.7 billion in 2024 and is set to grow at a CAGR of 6.9% from 2025 to 2034. This significant growth is propelled by heightened consumer education, health-focused eating habits, and an increasing number of individuals identifying food sensitivities. American consumers are becoming more selective in their dietary choices, encouraging companies to invest in product diversification and innovation. As a result, producers must cater to specific nutritional demands, which has led to a broader offering of targeted food intolerance products throughout the country.
The leading companies operating in the Food Intolerance Products Industry include Lifeway Foods, Inc., McNeil Consumer Healthcare Lactaid, General Mills, Inc., Danone S.A., and Nestle S.A. These brands are actively engaged in expanding their footprint in this dynamic market. To solidify their presence, key players in the food intolerance space are using a mix of targeted strategies. They are expanding their product portfolios to cater to emerging intolerances, investing in R&D to improve the taste and texture of allergen-free foods, and forming collaborations with dieticians and healthcare professionals to enhance credibility. Companies are also adopting clean-label practices and leveraging digital platforms to engage with health-conscious audiences. Many are acquiring niche brands and launching specialized product lines to cater to evolving consumer demands, while also increasing their presence in e-commerce and retail shelves to maximize reach and visibility.
Table of Contents
Chapter 1 Methodology & Scope
- 1.1 Market scope and definition
- 1.2 Research design
- 1.2.1 Research approach
- 1.2.2 Data collection methods
- 1.3 Data mining sources
- 1.3.1 Global
- 1.3.2 Regional/Country
- 1.4 Base estimates and calculations
- 1.4.1 Base year calculation
- 1.4.2 Key trends for market estimation
- 1.5 Primary research and validation
- 1.5.1 Primary sources
- 1.6 Forecast model
- 1.7 Research assumptions and limitations
Chapter 2 Executive Summary
- 2.1 Industry 3600 synopsis
- 2.2 Key market trends
- 2.3 TAM analysis, 2025-2034
- 2.4 CXO perspectives: strategic imperatives
- 2.5 Executive decision points
- 2.6 Critical success factors
- 2.7 Future outlook and strategic recommendations
Chapter 3 Industry Insights
- 3.1 Industry ecosystem analysis
- 3.1.1 Supplier landscape
- 3.1.2 Profit margin
- 3.1.3 Value addition at each stage
- 3.1.4 Factor affecting the value chain
- 3.1.5 Disruptions
- 3.2 Industry impact forces
- 3.2.1 Growth drivers
- 3.2.1.1 Rising prevalence of food intolerances & allergies
- 3.2.1.2 Growing awareness & diagnosis rates
- 3.2.1.3 Increasing demand for free-from products
- 3.2.1.4 Expanding product availability & variety
- 3.2.2 Industry pitfalls and challenges
- 3.2.2.1 Premium pricing of specialty products
- 3.2.2.2 Formulation & taste challenges
- 3.2.3 Market opportunities
- 3.2.1 Growth drivers
- 3.3 Growth potential analysis
- 3.4 Regulatory landscape
- 3.4.1 North America
- 3.4.2 Europe
- 3.4.3 Asia pacific
- 3.4.4 Latin America
- 3.4.5 Middle east & Africa
- 3.5 Porter's analysis
- 3.6 Pestel analysis
- 3.7 Price trends
- 3.8 Future market trends
- 3.9 Technology and innovation landscape
- 3.9.1 Current technological trends
- 3.9.2 Emerging technologies
- 3.10 Patent landscape
- 3.11 Trade statistics (HS code) (Note: the trade statistics will be provided for key countries only)
- 3.11.1 Major importing countries
- 3.11.2 Major exporting countries
- 3.12 Sustainability and environmental aspects
- 3.12.1 Sustainable practices
- 3.12.2 Waste reduction strategies
- 3.12.3 Energy efficiency in production
- 3.12.4 Eco-friendly initiatives
Chapter 4 Competitive Landscape, 2024
- 4.1 Introduction
- 4.2 Company market share analysis
- 4.2.1 By region
- 4.2.1.1 North America
- 4.2.1.2 Europe
- 4.2.1.3 Asia Pacific
- 4.2.1.4 LATAM
- 4.2.1.5 MEA
- 4.2.1 By region
- 4.3 Company matrix analysis
- 4.4 Competitive analysis of major market players
- 4.5 Competitive positioning matrix
- 4.6 Key developments
- 4.6.1 Mergers & acquisitions
- 4.6.2 Partnerships & collaborations
- 4.6.3 New Product Launches
- 4.6.4 Expansion plans
Chapter 5 Market Estimates & Forecast, By Intolerance Type, 2021-2034 (USD Billion) (Kilo Tons)
- 5.1 Key trends
- 5.2 Lactose intolerance products
- 5.3 Gluten intolerance products
- 5.4 Fodmap intolerance products
- 5.5 Histamine intolerance products
- 5.6 Sulfite intolerance products
- 5.7 Other intolerance products
Chapter 6 Market Estimates & Forecast, By Product Category, 2021-2034 (USD Billion) (Kilo Tons)
- 6.1 Key trends
- 6.2 Food products
- 6.2.1 Bakery & cereal products
- 6.2.1.1 Bread & baked goods
- 6.2.1.2 Breakfast cereals & granola
- 6.2.1.3 Cookies & crackers
- 6.2.1.4 Other bakery products
- 6.2.2 Dairy alternatives
- 6.2.2.1 Milk alternatives
- 6.2.2.2 Cheese alternatives
- 6.2.2.3 Yogurt alternatives
- 6.2.2.4 Ice cream & dessert alternatives
- 6.2.2.5 Other dairy alternatives
- 6.2.3 Snacks & convenience foods
- 6.2.3.1 Chips & savory snacks
- 6.2.3.2 Nutrition & protein bars
- 6.2.3.3 Ready meals & prepared foods
- 6.2.3.4 Other snack products
- 6.2.4 Condiments, dressings & sauces
- 6.2.4.1 Confectionery & desserts
- 6.2.4.2 Baby food & infant formulas
- 6.2.4.3 Other food products
- 6.2.1 Bakery & cereal products
- 6.3 Beverages
- 6.3.1 Plant-based milk
- 6.3.2 Fruit & vegetable juices
- 6.3.3 Functional beverages
- 6.3.4 Other beverages
- 6.4 Supplements & digestive aids
- 6.4.1 Digestive enzymes
- 6.4.2 Probiotics & prebiotics
- 6.4.3 Other supplements
Chapter 7 Market Estimates & Forecast, By Distribution Channel, 2021-2034 (USD Billion) (Kilo Tons)
- 7.1 Key trends
- 7.2 Supermarkets & hypermarkets
- 7.3 Specialty stores & health food stores
- 7.4 Convenience stores
- 7.5 Online retail
- 7.5.1 E-commerce platforms
- 7.5.2 Direct-to-consumer websites
- 7.5.3 Subscription services
- 7.6 Pharmacies & drugstores
- 7.7 Foodservice & HoReCa
- 7.8 Others
Chapter 8 Market Estimates & Forecast, By Region, 2021-2034 (USD Billion) (Kilo Tons)
- 8.1 Key trends
- 8.2 North America
- 8.2.1 U.S.
- 8.2.2 Canada
- 8.3 Europe
- 8.3.1 UK
- 8.3.2 Germany
- 8.3.3 France
- 8.3.4 Italy
- 8.3.5 Spain
- 8.3.6 Netherlands
- 8.3.7 Rest of Europe
- 8.4 Asia Pacific
- 8.4.1 China
- 8.4.2 India
- 8.4.3 Japan
- 8.4.4 South Korea
- 8.4.5 Australia
- 8.4.6 Rest of Asia Pacific
- 8.5 Latin America
- 8.5.1 Brazil
- 8.5.2 Mexico
- 8.5.3 Argentina
- 8.5.4 Rest of Latin America
- 8.6 Middle East and Africa
- 8.6.1 South Africa
- 8.6.2 Saudi Arabia
- 8.6.3 UAE
- 8.6.4 Rest of Middle East and Africa
Chapter 9 Company Profiles
- 9.1 Alpro
- 9.2 Amy's Kitchen, Inc.
- 9.3 Conagra Brands, Inc.
- 9.4 Daiya Foods Inc.
- 9.5 Danone S.A.
- 9.6 Dr. Schar AG/SPA
- 9.7 Enjoy Life Foods (Mondelez International)
- 9.8 Follow Your Heart
- 9.9 Fody Food Co.
- 9.10 General Mills, Inc.
- 9.11 Glutino (The Glutino Food Group)
- 9.12 Kellogg Company
- 9.13 Lactaid (McNeil Nutritionals, LLC)
- 9.14 Mondelez International, Inc.
- 9.15 Nestle S.A.
- 9.16 Oatly Group AB
- 9.17 The Hain Celestial Group, Inc.
- 9.18 The Kraft Heinz Company
- 9.19 The Lactalis Group
- 9.20 Udis Gluten Free (Boulder Brands, Inc.)


