


 |
市場調查報告書
商品編碼
1755246
企業資料視覺化平台市場機會、成長動力、產業趨勢分析及 2025 - 2034 年預測Enterprise Data Visualization Platform Market Opportunity, Growth Drivers, Industry Trend Analysis, and Forecast 2025 - 2034 |
||||||
2024年,全球企業數據視覺化平台市場規模達88億美元,預計到2034年將以14.1%的複合年成長率成長,達到277億美元,這得益於數位化轉型步伐的加快以及對雲端分析需求的不斷成長。隨著企業日益注重以數據為中心,企業開始大幅轉向能夠提供即時、可操作洞察的工具。企業正在擺脫靜態報告,轉而採用能夠促進敏捷性、協作和明智決策的動態平台。人工智慧和機器學習功能與視覺化工具的整合,進一步將其轉變為預測洞察和異常檢測的引擎。這些進步使企業能夠快速回應不斷變化的市場環境。如今,集中式系統能夠連結分散的資料來源,提高跨部門的可見性,並促進策略計畫的實施。借助雲端原生工具提供的可擴展且經濟高效的解決方案,企業能夠更好地適應不斷變化的業務環境,使資料視覺化成為卓越營運和競爭成長的基石。
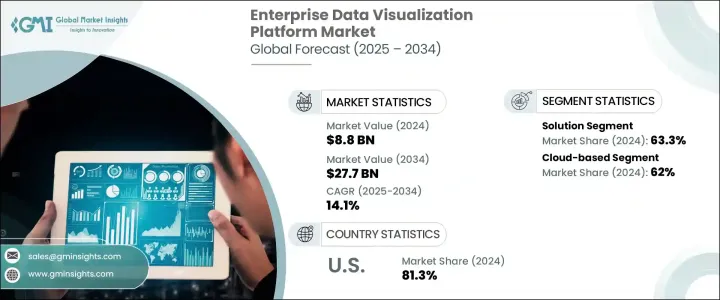
2024 年,雲端平台佔據 62% 的市場佔有率,預計 2025 年至 2034 年期間的複合年成長率將達到 14.9%。這些平台提供無與倫比的靈活性,支援分散的團隊和動態的業務需求。它們能夠快速與各種系統整合,並提供按需洞察,使其成為尋求可擴展即時分析的組織的首選。憑藉嵌入式分析、AI 增強探索和自動擴展等功能,它們無需傳統基礎架構的複雜性即可提供強大的效能。
| 市場範圍 | |
|---|---|
| 起始年份 | 2024 |
| 預測年份 | 2025-2034 |
| 起始值 | 88億美元 |
| 預測值 | 277億美元 |
| 複合年成長率 | 14.1% |
解決方案細分市場佔據63.3%的市場佔有率,預計到2034年將以15%的複合年成長率成長。這些平台將深度分析功能與直覺的設計相結合,使用戶能夠推動策略和營運決策。這些解決方案通常部署在數位轉型專案中,使企業能夠簡化報告流程、監控營運情況,並使用互動式模型和預建模板來獲取客戶洞察。低程式碼和無程式碼功能可實現更廣泛的使用者採用,幫助各部門團隊創建儀表板、減少對IT的依賴,並培養資料優先的文化。
北美企業數據視覺化平台市場佔81.3%的市場佔有率,2024年市場規模達105億美元。該市場的成長得益於高度數位化的生態系統、智慧工具的廣泛應用以及強大的技術創新力量。企業持續投資於高階分析和雲端平台,以提升營運敏捷性和策略協同性。成熟的基礎設施和豐富的資料人才使其成為開發和部署尖端視覺化技術的主要樞紐。
推動全球企業資料視覺化平台市場創新的關鍵參與者包括 Salesforce、MicroStrategy、Qlik、亞馬遜網路服務 (AWS)、Google、IBM Corporation、SAP SE、微軟 Corporation、Domo 和 Oracle Corporation。企業資料視覺化平台市場的領先公司專注於創新、雲端擴展和人工智慧整合,以鞏固其市場地位。許多公司正在透過預測分析、自然語言處理和自動異常檢測等人工智慧驅動的功能來增強其平台,以改善用戶體驗和決策能力。供應商正在投資雲端原生架構和嵌入式分析。組織透過提供低程式碼客製化和直覺的介面來優先考慮易用性,從而實現跨業務部門的更廣泛採用。
目錄
第1章:方法論與範圍
第2章:執行摘要
第3章:行業洞察
- 產業生態系統分析
- 供應商格局
- 技術提供者
- 系統整合商
- 雲端和基礎設施供應商
- 最終用途
- 川普政府關稅的影響
- 貿易影響
- 貿易量中斷
- 報復措施
- 對產業的影響
- 供應方影響(原料)
- 主要材料價格波動
- 供應鏈重組
- 生產成本影響
- 需求面影響(客戶成本)
- 價格傳導至終端市場
- 市佔率動態
- 消費者反應模式
- 供應方影響(原料)
- 受影響的主要公司
- 策略產業反應
- 供應鏈重組
- 定價和產品策略
- 政策參與
- 展望與未來考慮
- 貿易影響
- 利潤率分析
- 技術與創新格局
- 專利分析
- 用例
- 重要新聞和舉措
- 監管格局
- 衝擊力
- 成長動力
- 快速數位轉型
- 人工智慧和機器學習在業務流程中的整合
- 機器人流程自動化(RPA)的採用日益增多
- 雲端採用和 SaaS 擴展
- 產業陷阱與挑戰
- 實施成本高
- 資料隱私和安全問題
- 成長動力
- 成長潛力分析
- 波特的分析
- PESTEL分析
第4章:競爭格局
- 介紹
- 公司市佔率分析
- 競爭定位矩陣
- 戰略展望矩陣
第5章:市場估計與預測:按組件,2021 - 2034 年
- 主要趨勢
- 解決方案
- 服務
- 專業服務
- 託管服務
第6章:市場估計與預測:依部署模型,2021 - 2034 年
- 主要趨勢
- 基於雲端
- 本地
第7章:市場估計與預測:依組織規模,2021 - 2034 年
- 主要趨勢
- 大型企業
- 中小企業
第8章:市場估計與預測:按應用,2021 - 2034 年
- 主要趨勢
- 商業智慧
- 效能監控
- 風險與合規
- 銷售和行銷分析
- 營運管理
第9章:市場估計與預測:依最終用途,2021 - 2034 年
- 主要趨勢
- 金融服務業
- 衛生保健
- 零售
- IT和電信
- 教育
- 製造業
- 運輸與物流
- 其他
第10章:市場估計與預測:按地區,2021 - 2034 年
- 主要趨勢
- 北美洲
- 美國
- 加拿大
- 歐洲
- 英國
- 德國
- 法國
- 義大利
- 西班牙
- 俄羅斯
- 北歐人
- 亞太地區
- 中國
- 印度
- 日本
- 韓國
- 澳新銀行
- 東南亞
- 拉丁美洲
- 巴西
- 墨西哥
- 阿根廷
- MEA
- 阿拉伯聯合大公國
- 沙烏地阿拉伯
- 南非
第 11 章:公司簡介
- Amazon Web Services (AWS)
- Alteryx
- Board International
- Domo
- Dundas BI
- IBM Corporation
- InetSoft Technology
- Infor Birst
- Microsoft Corporation
- MicroStrategy
- Oracle Corporation
- Qlik
- Salesforce
- SAP SE
- Sisense
- ThoughtSpot
- TIBCO Software
- Yellowfin
- Zoho Analytics
The Global Enterprise Data Visualization Platform Market was valued at USD 8.8 billion in 2024 and is estimated to grow at a CAGR of 14.1% to reach USD 27.7 billion by 2034, driven by the acceleration of digital transformation efforts and a rising demand for cloud-based analytics. As organizations increasingly focus on becoming data-centric, there's a notable shift toward tools that enable real-time, actionable insights. Businesses are moving away from static reporting and adopting dynamic platforms that foster agility, collaboration and informed decision-making. The integration of artificial intelligence and machine learning capabilities into visualization tools is further transforming them into engines of predictive insights and anomaly detection. These advancements allow enterprises to respond swiftly to shifting market conditions. Centralized systems now bridge fragmented data sources, improving visibility across departments and facilitating strategic initiatives. With cloud-native tools offering scalable and cost-effective solutions, enterprises are better equipped to adapt to evolving business environments, making data visualization a cornerstone of operational excellence and competitive growth.
In 2024, cloud-based platforms held 62% share and is forecasted to grow at a CAGR of 14.9% between 2025 and 2034. These platforms offer unmatched flexibility, supporting decentralized teams and dynamic business needs. Their ability to integrate quickly with various systems and provide on-demand insights make them the preferred choice for organizations seeking scalable, real-time analytics. With features like embedded analytics, AI-enhanced exploration, and auto-scaling, they deliver powerful performance without the complexity of traditional infrastructure.
| Market Scope | |
|---|---|
| Start Year | 2024 |
| Forecast Year | 2025-2034 |
| Start Value | $8.8 Billion |
| Forecast Value | $27.7 Billion |
| CAGR | 14.1% |
The solution segment held 63.3% share and will grow at 15% CAGR through 2034. These platforms blend deep analytics functionality with intuitive design, enabling users to drive both strategic and operational decisions. Often deployed in digital transformation projects, these solutions allow enterprises to streamline reporting, monitor operations, and gain customer insights using interactive models and pre-built templates. Low-code and no-code features enable broader user adoption, helping teams across departments create their dashboards, reduce IT dependency, and foster a data-first culture.
North America Enterprise Data Visualization Platform Market held 81.3% share and generated USD 10.5 billion in 2024. The market's growth is supported by a highly digitized ecosystem, widespread use of intelligence tools, and a strong presence of technology innovators. Companies continue to invest in advanced analytics and cloud platforms to drive operational agility and strategic alignment. The mature infrastructure and abundant data talent make it a prime hub for developing and deploying cutting-edge visualization technologies.
Key players driving innovation in the Global Enterprise Data Visualization Platform Market include Salesforce, MicroStrategy, Qlik, Amazon Web Services (AWS), Google, IBM Corporation, SAP SE, Microsoft Corporation, Domo, and Oracle Corporation. Leading companies in the enterprise data visualization platform market focus on innovation, cloud expansion, and AI integration to solidify their market position. Many are enhancing their platforms with AI-driven features such as predictive analytics, natural language processing, and automated anomaly detection to improve user experience and decision-making capabilities. Vendors are investing in cloud-native architectures and embedded analytics. Organizations prioritize ease of use by offering low-code customization and intuitive interfaces, enabling broader adoption across business units.
Table of Contents
Chapter 1 Methodology & Scope
- 1.1 Research design
- 1.1.1 Research approach
- 1.1.2 Data collection methods
- 1.2 Base estimates and calculations
- 1.2.1 Base year calculation
- 1.2.2 Key trends for market estimates
- 1.3 Forecast model
- 1.4 Primary research & validation
- 1.4.1 Primary sources
- 1.4.2 Data mining sources
- 1.5 Market definitions
Chapter 2 Executive Summary
- 2.1 Industry 3600 synopsis, 2021 - 2034
Chapter 3 Industry Insights
- 3.1 Industry ecosystem analysis
- 3.2 Supplier landscape
- 3.2.1 Technology providers
- 3.2.2 System integrators
- 3.2.3 Cloud and infrastructure providers
- 3.2.4 End use
- 3.3 Impact of Trump administration tariffs
- 3.3.1 Trade impact
- 3.3.1.1 Trade volume disruptions
- 3.3.1.2 Retaliatory measures
- 3.3.2 Impact on industry
- 3.3.2.1 Supply-side impact (raw materials)
- 3.3.2.1.1 Price volatility in key materials
- 3.3.2.1.2 Supply chain restructuring
- 3.3.2.1.3 Production cost implications
- 3.3.2.2 Demand-side impact (Cost to customers)
- 3.3.2.2.1 Price transmission to end markets
- 3.3.2.2.2 Market share dynamics
- 3.3.2.2.3 Consumer response patterns
- 3.3.2.1 Supply-side impact (raw materials)
- 3.3.3 Key companies impacted
- 3.3.4 Strategic industry responses
- 3.3.4.1 Supply chain reconfiguration
- 3.3.4.2 Pricing and product strategies
- 3.3.4.3 Policy engagement
- 3.3.5 Outlook & future considerations
- 3.3.1 Trade impact
- 3.4 Profit margin analysis
- 3.5 Technology & innovation landscape
- 3.6 Patent analysis
- 3.7 Use cases
- 3.8 Key news & initiatives
- 3.9 Regulatory landscape
- 3.10 Impact forces
- 3.10.1 Growth drivers
- 3.10.1.1 Rapid digital transformation
- 3.10.1.2 Integration of AI and machine learning in business processes
- 3.10.1.3 Growing adoption of Robotic Process Automation (RPA)
- 3.10.1.4 Cloud adoption and SaaS expansion
- 3.10.2 Industry pitfalls & challenges
- 3.10.2.1 High implementation costs
- 3.10.2.2 Data privacy and security concerns
- 3.10.1 Growth drivers
- 3.11 Growth potential analysis
- 3.12 Porter's analysis
- 3.13 PESTEL analysis
Chapter 4 Competitive Landscape, 2024
- 4.1 Introduction
- 4.2 Company market share analysis
- 4.3 Competitive positioning matrix
- 4.4 Strategic outlook matrix
Chapter 5 Market Estimates & Forecast, By Component, 2021 - 2034 ($Mn)
- 5.1 Key trends
- 5.2 Solution
- 5.3 Services
- 5.3.1 Professional services
- 5.3.2 Managed services
Chapter 6 Market Estimates & Forecast, By Deployment Model, 2021 - 2034 ($Mn)
- 6.1 Key trends
- 6.2 Cloud-based
- 6.3 On-premises
Chapter 7 Market Estimates & Forecast, By Organization Size, 2021 - 2034 ($Mn)
- 7.1 Key trends
- 7.2 Large Enterprise
- 7.3 SME
Chapter 8 Market Estimates & Forecast, By Application, 2021 - 2034 ($Mn)
- 8.1 Key trends
- 8.2 Business intelligence
- 8.3 Performance monitoring
- 8.4 Risk and compliance
- 8.5 Sales and marketing analytics
- 8.6 Operations management
Chapter 9 Market Estimates & Forecast, By End Use, 2021 - 2034 ($Mn)
- 9.1 Key trends
- 9.2 BFSI
- 9.3 Healthcare
- 9.4 Retail
- 9.5 IT & telecom
- 9.6 Education
- 9.7 Manufacturing
- 9.8 Transportation & logistics
- 9.9 Others
Chapter 10 Market Estimates & Forecast, By Region, 2021 - 2034 ($Mn)
- 10.1 Key trends
- 10.2 North America
- 10.2.1 U.S.
- 10.2.2 Canada
- 10.3 Europe
- 10.3.1 UK
- 10.3.2 Germany
- 10.3.3 France
- 10.3.4 Italy
- 10.3.5 Spain
- 10.3.6 Russia
- 10.3.7 Nordics
- 10.4 Asia Pacific
- 10.4.1 China
- 10.4.2 India
- 10.4.3 Japan
- 10.4.4 South Korea
- 10.4.5 ANZ
- 10.4.6 Southeast Asia
- 10.5 Latin America
- 10.5.1 Brazil
- 10.5.2 Mexico
- 10.5.3 Argentina
- 10.6 MEA
- 10.6.1 UAE
- 10.6.2 Saudi Arabia
- 10.6.3 South Africa
Chapter 11 Company Profiles
- 11.1 Amazon Web Services (AWS)
- 11.2 Alteryx
- 11.3 Board International
- 11.4 Domo
- 11.5 Dundas BI
- 11.6 Google
- 11.7 IBM Corporation
- 11.8 InetSoft Technology
- 11.9 Infor Birst
- 11.10 Microsoft Corporation
- 11.11 MicroStrategy
- 11.12 Oracle Corporation
- 11.13 Qlik
- 11.14 Salesforce
- 11.15 SAP SE
- 11.16 Sisense
- 11.17 ThoughtSpot
- 11.18 TIBCO Software
- 11.19 Yellowfin
- 11.20 Zoho Analytics
 人工智慧心智圖工具市場:按部署類型、定價模式、技術組件、應用、部署模式和組織規模分類,全球預測,2026-2032年
 感測器資料分析市場分析及預測(至2035年):按類型、產品類型、服務、技術、組件、應用、設備、最終用戶和部署類型分類
 數據驅動型市場-全球產業規模、佔有率、趨勢、機會及預測(按類型、應用、垂直產業、地區及競爭格局分類,2021-2031年)AI智慧型視覺化閘道器市場按產品類型、部署類型、最終用戶、應用和分銷管道分類 - 全球預測(2026-2032年)人工智慧感測器市場:按感測器類型、技術、應用和最終用戶分類,全球預測(2026-2032年)感測器資料分析市場:2026-2032年全球預測(按感測器類型、技術、部署類型、應用和最終用戶分類)
 數據市場-2026-2031年預測人工智慧感測器市場-全球產業規模、佔有率、趨勢、機會及預測(按類型、技術、應用、區域及競爭格局分類,2021-2031年預測)
 感測器資料分析市場規模、佔有率和成長分析(按組件、模型、分析方法、服務、應用、最終用途和地區分類)-2026-2033年產業預測
 供應鏈視覺化軟體市場機會、成長促進因素、產業趨勢分析及預測(2026-2035年)