


 |
市場調查報告書
商品編碼
1741046
化學液氫市場機會、成長動力、產業趨勢分析及2025-2034年預測Chemical Liquid Hydrogen Market Opportunity, Growth Drivers, Industry Trend Analysis, and Forecast 2025 - 2034 |
||||||
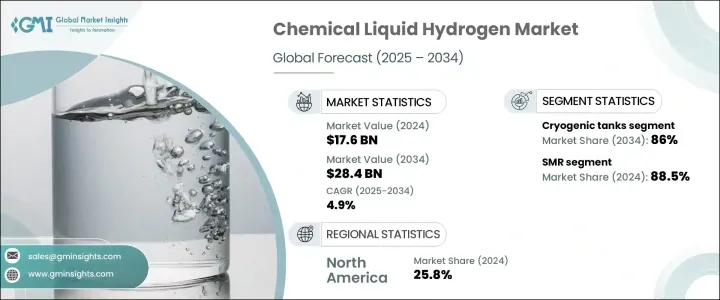
2024年,全球化學液氫市場規模達176億美元,預計到2034年將以4.9%的複合年成長率成長,達到284億美元,因為化學品生產商正在尋求低排放原料以符合全球氣候目標。隨著全球各行各業積極推動脫碳策略,對化學液氫的需求正在加速成長。各國政府和私人企業正大力投資氫能基礎設施,以滿足實現淨零排放目標的迫切需求。受再生能源成本下降和技術突破的推動,市場正朝著綠色氫氣生產方向轉變。政策支持、投資者信心的增強以及策略性的公私合作夥伴關係正在為氫能發展創造一個充滿活力的生態系統。電解槽改進、碳捕獲技術和可擴展液化系統的資金投入不斷增加,使化學液氫更具商業可行性和環境永續性。隨著化學、重工業和交通運輸等工業部門加大對清潔能源的投入,對可及性強、靈活的氫能解決方案的需求也變得更加迫切。這一勢頭為未來十年強勁的市場成長奠定了基礎。
日益成長的綠氫能轉型正在推動其在工業領域的應用。再生能源(尤其是太陽能和風能)成本的降低,使得電解氫更具商業可行性。同時,電解槽技術和碳捕集系統的進步正在提高生產流程的效率和永續性。這些創新使各行各業能夠更快地實現脫碳,並滿足監管要求。
| 市場範圍 | |
|---|---|
| 起始年份 | 2024 |
| 預測年份 | 2025-2034 |
| 起始值 | 176億美元 |
| 預測值 | 284億美元 |
| 複合年成長率 | 4.9% |
靈活基礎設施和定價模式的持續部署,使工業用戶更容易獲得氫氣。透明的現貨定價為那些傾向於按需供應且無需長期承諾的買家創造了新的機會,鼓勵了跨行業的更廣泛參與。這項進展增強了投資者信心,加速了清潔氫能計畫的融資。公私部門合作夥伴關係持續協助推動基礎建設,特別是液態氫的儲存和運輸。
用於氫氣輸送的大型氨轉化和液化系統的商業化努力正在獲得越來越多的關注。這些進展正在提高長途運輸的經濟可行性,有助於滿足日益成長的全球需求。然而,現行的國際貿易政策提高了氫能相關設備的進口關稅,這可能會推高未來的生產成本,從而在全球供應鏈中造成摩擦。這也可能限制創新,並減緩一些地區的市場擴張,尤其是在清潔能源基礎設施尚在萌芽的地區。
煤氣化領域在2024年創造了11億美元的產值,預計到2034年將進一步成長。其吸引力在於將豐富的煤炭儲量轉化為氫氣,支持能源多元化策略。隨著人們越來越重視能源安全並減少對傳統燃料進口的依賴,人們對這種方法的興趣仍然濃厚。將碳捕獲技術融入煤製氫工藝,使整個過程更加清潔,有助於銜接向完全可再生替代能源的過渡。
在分配方面,管道和低溫儲罐仍然是運輸化學液氫的兩種主要方式,每種方式根據用例和地理需求各有優勢。 2024年,低溫儲槽佔據了86%的市場佔有率,凸顯了其在化學生產環境中儲存和運輸大量液態氫的關鍵作用。這些儲槽經過精心設計,能夠承受極低溫度,將氫氣保持在液化狀態,並最大限度地減少儲存和運輸過程中的能量損失。真空絕緣和多層複合材料的創新進一步鞏固了低溫儲罐的主導地位,這些創新顯著降低了液化速率,並提高了整體安全性。
2024年,美國化學液氫市場產值達41億美元,這得益於國家大力發展清潔能源,以及公部門和私部門的大量投資。聯邦政府的激勵措施、撥款和政策框架推動了主要工業區域氫氣生產和儲存設施的快速發展。化工、重工業和交通運輸等產業對氫能的興趣日益濃厚,推動了對穩健氫氣供應鏈的需求。
巴拉德動力系統公司、道達爾能源公司、查特工業公司、梅塞爾集團、林德公司、普拉格能源公司、ENGIE公司、空氣化工產品公司、巖谷公司、ENEOS公司、大陽日酸公司、液化空氣公司和Nel ASA等公司正專注於多種策略以鞏固市場佔有率。關鍵舉措包括投資高效生產技術、與能源和化學公司建立策略聯盟以及建造模組化、可擴展的氫氣工廠。這些公司優先考慮透過數位整合來監控供應,並投資基礎設施以確保可靠的能源分配,同時與區域清潔能源政策保持一致。
目錄
第1章:方法論與範圍
第2章:執行摘要
第3章:行業洞察
- 產業生態系統
- 川普政府關稅分析
- 對貿易的影響
- 貿易量中斷
- 報復措施
- 對產業的影響
- 供應方影響(原料)
- 主要材料價格波動
- 供應鏈重組
- 生產成本影響
- 需求面影響(售價)
- 價格傳導至終端市場
- 市佔率動態
- 消費者反應模式
- 供應方影響(原料)
- 受影響的主要公司
- 策略產業反應
- 供應鏈重組
- 定價和產品策略
- 政策參與
- 展望與未來考慮
- 對貿易的影響
- 監管格局
- 產業衝擊力
- 成長動力
- 產業陷阱與挑戰
- 成長潛力分析
- 波特的分析
- PESTEL分析
第4章:競爭格局
- 介紹
- 戰略儀表板
- 創新與永續發展格局
第5章:市場規模及預測:依產量,2021 年至 2034 年
- 主要趨勢
- 瓦斯化
- 小型磁共振
- 電解
第6章:市場規模及預測:依分佈,2021 年至 2034 年
- 主要趨勢
- 管道
- 低溫儲罐
第7章:市場規模及預測:依地區,2021 年至 2034 年
- 主要趨勢
- 北美洲
- 美國
- 加拿大
- 歐洲
- 德國
- 英國
- 法國
- 義大利
- 亞太地區
- 中國
- 印度
- 日本
- 韓國
- 澳洲
- 世界其他地區
第8章:公司簡介
- Air Liquide
- Air Products and Chemicals
- Ballard Power Systems
- Chart Industries
- ENGIE
- ENEOS Corporation
- Hexagon Composites
- Iwatani Corporation
- Linde
- Messer Group
- Nel ASA
- Plug Power
- TotalEnergies
- Taiyo Nippon Sanso Corporation
The Global Chemical Liquid Hydrogen Market was valued at USD 17.6 billion in 2024 and is estimated to grow at a CAGR of 4.9% to reach USD 28.4 billion by 2034 as chemical producers pursue low-emission feedstocks to align with global climate targets. Demand for chemical liquid hydrogen is accelerating as industries worldwide move aggressively toward decarbonization strategies. Governments and private players are investing heavily in hydrogen infrastructure, driven by the urgency to meet net-zero goals. The market is witnessing a shift toward green hydrogen production, fueled by lower renewable energy costs and technological breakthroughs. Policy support, growing investor confidence, and strategic public-private partnerships are creating a vibrant ecosystem for hydrogen development. Increasing funding in electrolyzer advancements, carbon capture technologies, and scalable liquefaction systems is making chemical liquid hydrogen more commercially feasible and environmentally sustainable. As industrial sectors such as chemicals, heavy industries, and transportation sectors ramp up their clean energy commitments, the need for accessible and flexible hydrogen solutions is becoming even more critical. This momentum is setting the stage for robust market growth through the next decade.
A growing shift toward green hydrogen is driving adoption across industrial applications. Cost reductions in renewable energy, particularly solar and wind, are making electrolytic hydrogen more commercially viable. Simultaneously, advancements in electrolyzer technology and carbon capture systems are improving the efficiency and sustainability of production processes. These innovations are allowing industries to decarbonize more rapidly and meet regulatory expectations.
| Market Scope | |
|---|---|
| Start Year | 2024 |
| Forecast Year | 2025-2034 |
| Start Value | $17.6 Billion |
| Forecast Value | $28.4 Billion |
| CAGR | 4.9% |
The increased deployment of flexible infrastructure and pricing models makes hydrogen more accessible to industrial users. Transparent spot pricing creates new opportunities for buyers who prefer on-demand supply without long-term commitments, encouraging broader participation across sectors. This progress boosts investor confidence, accelerating funding for clean hydrogen initiatives. Public-private partnerships continue to help in advancing infrastructure, particularly for liquid hydrogen storage and transportation.
Efforts to commercialize large-scale ammonia conversion and liquefaction systems for hydrogen distribution are gaining traction. These developments are improving the economic viability of long-distance transport, helping meet rising global demand. However, ongoing international trade policies that raise import tariffs on hydrogen-related equipment may inflate future production costs, creating friction in global supply chains. This may also restrict innovation and slow market expansion in several regions, particularly where clean energy infrastructure is still emerging.
The coal gasification segment generated USD 1.1 billion in 2024 and is poised to grow further by 2034. Its appeal lies in converting abundant coal reserves into hydrogen, supporting energy diversification strategies. As more emphasis is placed on energy security and reducing reliance on traditional fuel imports, interest in this method remains strong. Integrating carbon capture into coal-based hydrogen production makes the process cleaner, helping bridge the transition to fully renewable alternatives.
In terms of distribution, pipelines and cryogenic tanks remain the two primary methods for transporting chemical liquid hydrogen, each offering distinct advantages based on use cases and geographic needs. Cryogenic tanks held an 86% share in 2024, underscoring their critical role in enabling the storage and movement of large volumes of liquid hydrogen within chemical production environments. These tanks are engineered to withstand extreme cold temperatures, preserving hydrogen in its liquefied state and minimizing energy losses during storage and transport. Their dominance is further supported by innovations in vacuum insulation and multilayer composite materials, which significantly reduce boil-off rates and improve overall safety.
U.S. Chemical Liquid Hydrogen Market generated USD 4.1 billion in 2024, fueled by an aggressive national push toward clean energy, backed by significant public and private sector investments. Federal incentives, grants, and policy frameworks have enabled the rapid development of hydrogen production and storage facilities across key industrial regions. Increased interest from sectors such as chemicals, heavy industry, and transportation is driving the need for robust hydrogen supply chains.
Companies like Ballard Power Systems, TotalEnergies, Chart Industries, Messer Group, Linde, Plug Power, ENGIE, Air Products and Chemicals, Iwatani Corporation, ENEOS Corporation, Taiyo Nippon Sanso Corporation, Air Liquide, and Nel ASA are focusing on multiple strategies to secure market share. Key initiatives include investing in high-efficiency production technologies, forming strategic alliances with energy and chemical firms, and building modular, scalable hydrogen plants. These players prioritize digital integration for supply monitoring and investing in infrastructure to ensure reliable distribution while aligning with regional clean energy policies.
Table of Contents
Chapter 1 Methodology & Scope
- 1.1 Research design
- 1.2 Base estimates & calculations
- 1.3 Forecast calculation
- 1.4 Primary research & validation
- 1.4.1 Primary sources
- 1.4.2 Data mining sources
- 1.5 Market definitions
Chapter 2 Executive Summary
- 2.1 Industry synopsis, 2021 – 2034
Chapter 3 Industry Insights
- 3.1 Industry ecosystem
- 3.2 Trump administration tariff analysis
- 3.2.1 Impact on trade
- 3.2.1.1 Trade volume disruptions
- 3.2.1.2 Retaliatory measures
- 3.2.2 Impact on the industry
- 3.2.2.1 Supply-side impact (raw materials)
- 3.2.2.1.1 Price volatility in key materials
- 3.2.2.1.2 Supply chain restructuring
- 3.2.2.1.3 Production cost implications
- 3.2.2.2 Demand-side impact (selling price)
- 3.2.2.2.1 Price transmission to end markets
- 3.2.2.2.2 Market share dynamics
- 3.2.2.2.3 Consumer response patterns
- 3.2.2.1 Supply-side impact (raw materials)
- 3.2.3 Key companies impacted
- 3.2.4 Strategic industry responses
- 3.2.4.1 Supply chain reconfiguration
- 3.2.4.2 Pricing and product strategies
- 3.2.4.3 Policy engagement
- 3.2.5 Outlook and future considerations
- 3.2.1 Impact on trade
- 3.3 Regulatory landscape
- 3.4 Industry impact forces
- 3.4.1 Growth drivers
- 3.4.2 Industry pitfalls & challenges
- 3.5 Growth potential analysis
- 3.6 Porter's analysis
- 3.6.1 Bargaining power of suppliers
- 3.6.2 Bargaining power of buyers
- 3.6.3 Threat of new entrants
- 3.6.4 Threat of substitutes
- 3.7 PESTEL analysis
Chapter 4 Competitive landscape, 2024
- 4.1 Introduction
- 4.2 Strategic dashboard
- 4.3 Innovation & sustainability landscape
Chapter 5 Market Size and Forecast, By Production, 2021 – 2034 (USD Billion & MT)
- 5.1 Key trends
- 5.2 Coal gasification
- 5.3 SMR
- 5.4 Electrolysis
Chapter 6 Market Size and Forecast, By Distribution, 2021 – 2034 (USD Billion & MT)
- 6.1 Key trends
- 6.2 Pipelines
- 6.3 Cryogenic tanks
Chapter 7 Market Size and Forecast, By Region, 2021 – 2034 (USD Billion & MT)
- 7.1 Key trends
- 7.2 North America
- 7.2.1 U.S.
- 7.2.2 Canada
- 7.3 Europe
- 7.3.1 Germany
- 7.3.2 UK
- 7.3.3 France
- 7.3.4 Italy
- 7.4 Asia Pacific
- 7.4.1 China
- 7.4.2 India
- 7.4.3 Japan
- 7.4.4 South Korea
- 7.4.5 Australia
- 7.5 Rest of World
Chapter 8 Company Profiles
- 8.1 Air Liquide
- 8.2 Air Products and Chemicals
- 8.3 Ballard Power Systems
- 8.4 Chart Industries
- 8.5 ENGIE
- 8.6 ENEOS Corporation
- 8.7 Hexagon Composites
- 8.8 Iwatani Corporation
- 8.9 Linde
- 8.10 Messer Group
- 8.11 Nel ASA
- 8.12 Plug Power
- 8.13 TotalEnergies
- 8.14 Taiyo Nippon Sanso Corporation
 液氫市場:商業機會、成長要素、產業趨勢分析及2026-2035年預測
 化學液氫市場規模、佔有率和成長分析:按純度、製造方法、儲存類型、應用、最終用戶和地區分類-2026-2033年產業預測
 液氫市場規模、佔有率及成長分析(依生產方式、分銷方式、終端用戶產業及地區分類)-2026-2033年產業預測
 全球煤炭氣化液氫市場全球電解液氫市場化學液氫全球市場全球液氫市場
 液氫-市場佔有率分析、產業趨勢與統計、成長預測(2025-2030)亞太液氫 -市場佔有率分析、產業趨勢與統計、成長預測(2025-2030 年)北美液氫 -市場佔有率分析、產業趨勢與統計、成長預測(2025-2030)