


 |
市場調查報告書
商品編碼
1721473
擴增實境包裝市場機會、成長動力、產業趨勢分析及 2025 - 2034 年預測Augmented Reality Packaging Market Opportunity, Growth Drivers, Industry Trend Analysis, and Forecast 2025 - 2034 |
||||||
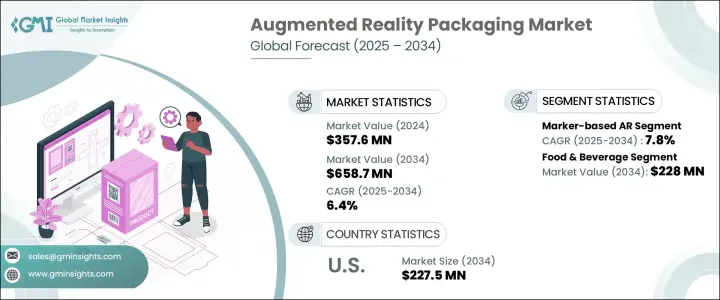
2024 年全球擴增實境包裝市場價值為 3.576 億美元,預計到 2034 年將以 6.4% 的複合年成長率成長,達到 6.587 億美元。消費者行為的快速變化、對個人化體驗的期望不斷成長以及數位經濟的穩定擴張正在重塑包裝產業。各行業的品牌正逐漸從傳統的包裝方法轉向智慧、互動的替代方法,以提升顧客參與。透過將 AR 技術直接整合到產品包裝中,企業可以提供身臨其境的故事敘述、產品演示和即時詳細見解,為消費者在銷售點提供難忘且資訊豐富的體驗。這一趨勢正在創造一種範式轉變,尤其是在零售和電子商務領域,AR 正在成為推動轉換、品牌忠誠度和購買後滿意度的重要工具。智慧型手機普及率的提高以及消費者願意與數位覆蓋進行互動以增強產品理解,進一步推動了市場的發展勢頭。在差異化至關重要的領域中,AR 包裝是實體產品和數位體驗之間的寶貴橋樑。
隨著線上零售商尋求新方法來降低產品不確定性和退貨率,AR 與包裝的日益融合與電子商務的繁榮緊密相關。 AR 包裝使消費者能夠在做出購買決定之前在現實環境中看到產品。這種能力不僅可以提高買家信心,而且還有助於提高品牌認知度並減少購買後的不和諧。隨著企業努力在各個管道提供無縫且資訊豐富的購物體驗,AR 增強型包裝在數位和實體零售環境中繼續受到關注。
| 市場範圍 | |
|---|---|
| 起始年份 | 2024 |
| 預測年份 | 2025-2034 |
| 起始值 | 3.576億美元 |
| 預測值 | 6.587億美元 |
| 複合年成長率 | 6.4% |
市場根據技術細分為機器學習、基於標記的 AR、無標記 AR、基於 GPS/位置的 AR 等。其中,基於標記的 AR 成長最快,預測期內預計複合年成長率為 7.8%。公司更喜歡這項技術,因為它簡單、經濟高效、用戶互動一致。基於標記的 AR 利用包裝上的預定義圖像或2D碼來觸發互動內容,使品牌更容易根據行銷目標客製化用戶體驗。事實證明,這種技術前瞻性策略在提升客戶參與度和品牌故事方面非常有效。
在終端使用產業方面,食品和飲料產業表現突出,預計到 2034 年將達到 2.28 億美元。對成分、來源和營養價值透明度的需求促使製造商加入 AR 功能,透過簡單的包裝掃描將相關資訊直接傳遞給消費者。
預計到 2034 年,光是美國擴增實境包裝市場規模就將達到 2.275 億美元,這主要得益於人們對沉浸式、數據豐富的購物體驗的需求。品牌正在將傳統包裝轉變為滿足不斷變化的消費者偏好的互動式數位接觸點。
全球市場的關鍵參與者包括 BrandXR、SmartTek Solutions.LLC、Zappar(Infinite Reality)、FlippAR 和 Jasoren。這些公司透過擴展其 AR 能力、投資研發和建立策略合作夥伴關係不斷創新,透過包裝將下一代 AR 解決方案變為現實。
目錄
第1章:方法論與範圍
第2章:執行摘要
第3章:行業洞察
- 產業生態系統分析
- 產業衝擊力
- 成長動力
- 對智慧和數位包裝解決方案的需求不斷成長
- 越來越多採用物聯網和感測器技術進行即時包裝最佳化
- 提高供應鏈透明度和包裝可追溯性的需求日益成長
- 更加重視提升消費者體驗
- 電子商務產業的不斷擴張推動了對智慧、自適應包裝的需求
- 產業陷阱與挑戰
- 初期投資和營運成本高
- 採用率較慢
- 成長動力
- 成長潛力分析
- 監管格局
- 技術格局
- 未來市場趨勢
- 差距分析
- 波特的分析
- PESTEL分析
第4章:競爭格局
- 介紹
- 公司市佔率分析
- 主要市場參與者的競爭分析
- 競爭定位矩陣
- 策略儀表板
第5章:市場估計與預測:按技術,2021 年至 2034 年
- 主要趨勢
- 基於標記的擴增實境
- 無標記擴增實境
- GPS/基於位置的擴增實境
- 其他
第6章:市場估計與預測:依最終用途產業,2021 年至 2034 年
- 主要趨勢
- 食品和飲料
- 製藥和醫療保健
- 零售和消費品
- 化妝品和個人護理
- 汽車
- 工業品
- 其他
第7章:市場估計與預測:按地區,2021 年至 2034 年
- 主要趨勢
- 北美洲
- 美國
- 加拿大
- 歐洲
- 德國
- 英國
- 法國
- 西班牙
- 義大利
- 荷蘭
- 亞太地區
- 中國
- 印度
- 澳洲
- 韓國
- 日本
- 拉丁美洲
- 巴西
- 墨西哥
- 中東和非洲
- 沙烏地阿拉伯
- 阿拉伯聯合大公國
- 南非
第8章:公司簡介
- Arloopa Studio
- BrandXR
- FlippAR
- Ink In Caps
- Jasoren
- PlugXR
- Proven Solution
- SmartTek Solutions.LLC
- THIMM Group GmbH + Co. KG
- Travancore Analytics
- Vossle
- WE/AR Studio
- Zappar (Infinite Reality)
The Global Augmented Reality Packaging Market was valued at USD 357.6 million in 2024 and is estimated to grow at a CAGR of 6.4% to reach USD 658.7 million by 2034. The rapid evolution of consumer behavior, growing expectations for personalized experiences, and the steady expansion of the digital economy are reshaping the packaging industry. Brands across sectors are increasingly shifting from conventional packaging methods to smart, interactive alternatives that elevate customer engagement. With AR technology integrated directly into product packaging, businesses are offering immersive storytelling, product demos, and detailed insights in real time-giving consumers a memorable and informative experience at the point of sale. This trend is creating a paradigm shift, especially in the retail and e-commerce spaces, where AR is becoming an essential tool for driving conversion, brand loyalty, and post-purchase satisfaction. The market's momentum is further fueled by rising smartphone penetration and the readiness of consumers to interact with digital overlays that enhance product understanding. In a landscape where differentiation is key, AR packaging serves as a valuable bridge between physical products and digital experiences.
The increasing integration of AR into packaging is tightly linked to the e-commerce boom, as online retailers seek new ways to reduce product uncertainty and return rates. AR packaging enables consumers to visualize products in their real-life environment before making a purchase decision. This ability not only improves buyer confidence but also contributes to improved brand perception and reduced post-purchase dissonance. As businesses strive to deliver a seamless and informative shopping experience across channels, AR-enhanced packaging continues to gain traction in both digital and brick-and-mortar retail environments.
| Market Scope | |
|---|---|
| Start Year | 2024 |
| Forecast Year | 2025-2034 |
| Start Value | $357.6 Million |
| Forecast Value | $658.7 Million |
| CAGR | 6.4% |
The market is segmented based on technology into machine learning, marker-based AR, markerless AR, GPS/location-based AR, and others. Among these, marker-based AR is witnessing the fastest growth, with an expected CAGR of 7.8% during the forecast period. Companies prefer this technology for its simplicity, cost-efficiency, and consistent user interactions. Marker-based AR leverages predefined images or QR codes on packaging to trigger interactive content, making it easier for brands to customize user experiences in line with marketing goals. This tech-forward strategy is proving highly effective in boosting customer engagement and brand storytelling.
In terms of end-use industries, the food and beverage segment stands out and is anticipated to reach USD 228 million by 2034. The demand for transparency regarding ingredients, sourcing, and nutritional value is prompting manufacturers to incorporate AR features that deliver relevant information directly to consumers through simple packaging scans.
The U.S. Augmented Reality Packaging Market alone is projected to hit USD 227.5 million by 2034, driven by the appetite for immersive, data-rich shopping experiences. Brands are transforming traditional packaging into interactive digital touchpoints that cater to evolving consumer preferences.
Key players in the global market include BrandXR, SmartTek Solutions.LLC, Zappar (Infinite Reality), FlippAR, and Jasoren. These companies continue to innovate by expanding their AR capabilities, investing in R&D, and forming strategic partnerships that bring next-gen AR solutions to life through packaging.
Table of Contents
Chapter 1 Methodology and Scope
- 1.1 Market scope and definitions
- 1.2 Research design
- 1.2.1 Research approach
- 1.2.2 Data collection methods
- 1.3 Base estimates and calculations
- 1.3.1 Base year calculation
- 1.3.2 Key trends for market estimation
- 1.4 Forecast model
- 1.5 Primary research and validation
- 1.5.1 Primary sources
- 1.5.2 Data mining sources
Chapter 2 Executive Summary
- 2.1 Industry 3600 synopsis
Chapter 3 Industry Insights
- 3.1 Industry ecosystem analysis
- 3.2 Industry impact forces
- 3.2.1 Growth drivers
- 3.2.1.1 Rising demand for smart and digital packaging solution
- 3.2.1.2 Increasing adoption of IoT and sensor technologies for real-time packaging optimization
- 3.2.1.3 Rising need for improved supply chain transparency and traceability in packaging
- 3.2.1.4 Increasing focus on enhancing consumer experience
- 3.2.1.5 Expanding e-commerce sector fuelling the need for smart, adaptive packaging
- 3.2.2 Industry pitfalls and challenges
- 3.2.2.1 High initial investment and operational costs
- 3.2.2.2 Slower adoption rate
- 3.2.1 Growth drivers
- 3.3 Growth potential analysis
- 3.4 Regulatory landscape
- 3.5 Technology landscape
- 3.6 Future market trends
- 3.7 Gap analysis
- 3.8 Porter’s analysis
- 3.9 PESTEL analysis
Chapter 4 Competitive Landscape, 2024
- 4.1 Introduction
- 4.2 Company market share analysis
- 4.3 Competitive analysis of major market players
- 4.4 Competitive positioning matrix
- 4.5 Strategy dashboard
Chapter 5 Market Estimates and Forecast, By Technology, 2021 – 2034 ($ Mn)
- 5.1 Key trends
- 5.2 Marker-Based AR
- 5.3 Markerless AR
- 5.4 GPS/Location-Based AR
- 5.5 Others
Chapter 6 Market Estimates and Forecast, By End Use Industry, 2021 – 2034 ($ Mn)
- 6.1 Key trends
- 6.2 Food & Beverage
- 6.3 Pharmaceuticals & Healthcare
- 6.4 Retail & Consumer Goods
- 6.5 Cosmetics & Personal Care
- 6.6 Automotive
- 6.7 Industrial goods
- 6.8 Others
Chapter 7 Market Estimates and Forecast, By Region, 2021 – 2034 ($ Mn)
- 7.1 Key trends
- 7.2 North America
- 7.2.1 U.S.
- 7.2.2 Canada
- 7.3 Europe
- 7.3.1 Germany
- 7.3.2 UK
- 7.3.3 France
- 7.3.4 Spain
- 7.3.5 Italy
- 7.3.6 Netherlands
- 7.4 Asia Pacific
- 7.4.1 China
- 7.4.2 India
- 7.4.3 Australia
- 7.4.4 South Korea
- 7.4.5 Japan
- 7.5 Latin America
- 7.5.1 Brazil
- 7.5.2 Mexico
- 7.6 Middle East and Africa
- 7.6.1 Saudi Arabia
- 7.6.2 U.A.E.
- 7.6.3 South Africa
Chapter 8 Company Profiles
- 8.1 Arloopa Studio
- 8.2 BrandXR
- 8.3 FlippAR
- 8.4 Ink In Caps
- 8.5 Jasoren
- 8.6 PlugXR
- 8.7 Proven Solution
- 8.8 SmartTek Solutions.LLC
- 8.9 THIMM Group GmbH + Co. KG
- 8.10 Travancore Analytics
- 8.11 Vossle
- 8.12 WE/AR Studio
- 8.13 Zappar (Infinite Reality)
 全球航空擴增實境與虛擬實境市場全球擴增實境(AR)購物市場
 2032 年空間運算市場預測:按解決方案、技術、最終用戶和地區進行的全球分析
 擴增實境(AR) 市場 2025-20292032 年擴增實境(AR) 市場預測:按設備類型、產品、技術、應用、最終用戶和地區進行的全球分析
 2025年擴增實境(AR)購物全球市場報告2032 年農業擴增實境市場預測:按組件、部署模式、技術、應用、最終用戶和地區進行的全球分析2025年培訓和教育領域擴增實境全球市場報告2025年擴增實境服務全球市場報告
 全球擴增實境市場研究報告 - 產業分析、規模、佔有率、成長、趨勢及 2025 年至 2033 年預測