

 |
市場調查報告書
商品編碼
1716523
非接觸式支付市場機會、成長動力、產業趨勢分析及 2025 - 2034 年預測Contactless Payment Market Opportunity, Growth Drivers, Industry Trend Analysis, and Forecast 2025 - 2034 |
||||||
2024 年全球非接觸式支付市場規模達到 416 億美元,預估 2025 年至 2034 年期間的複合年成長率為 12.3%。消費者對行動錢包和智慧卡進行數位交易的依賴日益增加,推動了這一成長。智慧手錶、健身追蹤器和其他消費性電子產品等穿戴式裝置正在提高支付的便利性,從而促進其普及。安全無縫支付技術的普及鼓勵金融機構推廣非接觸式支付解決方案,進一步擴大市場。隨著行動支付的發展,將其與存取系統、票務和其他服務的整合確保了其廣泛的應用。這些支付解決方案的安全整合增強了消費者的信任並加速了採用。
穿戴式支付技術使用無線射頻識別 (RFID)、近場通訊 (NFC) 和快速回應 (QR) 碼進行操作。非接觸式銷售點 (POS) 終端和後端支付基礎設施正在將這些功能擴展到穿戴式設備,從而改善整體支付生態系統。 NFC 技術佔超過 68% 的市場佔有率,預計到 2034 年將超過 913 億美元。 NFC 的工作頻率為 13.56 MHz,可確保消費性電子設備和 POS 終端之間的交易安全、快速且可靠。它廣泛用於行動錢包,提供增強的加密和身份驗證,使其成為非接觸式支付的首選技術。全球約有 30 億部智慧型手機配備了 NFC,可實現安全的點擊支付交易。
| 市場範圍 | |
|---|---|
| 起始年份 | 2024 |
| 預測年份 | 2025-2034 |
| 起始值 | 416億美元 |
| 預測值 | 1284億美元 |
| 複合年成長率 | 12.3% |
零售業仍是非接觸式支付市場最大的應用領域,到2024年將佔據39.5%的市場。零售業的數位支付解決方案因其便利性和效率而越來越受歡迎。 POS 終端整合了行動和非接觸式技術,可加快交易速度、減少等待時間並提高客戶滿意度。數位零售解決方案的興起改變了傳統的購物體驗,零售商現在提供無縫結帳選項和先進的庫存管理系統。這些創新不僅增強了客戶參與度,而且提高了整體營運效率。
2024 年,POS 終端佔據了超過 120 億美元的顯著佔有率。零售、飯店、運輸和倉儲等行業日益採用數位化,推動了對 POS 終端的需求。藍牙和 NFC 等無線技術的整合使得這些終端功能多樣且安全。隨著 POS 系統逐漸符合 EMV 等全球安全標準,它們透過創建獨特的加密交易代碼提供了額外的安全保障,降低了詐欺風險並確保了交易安全。
消費者(B2C 交易)主導非接觸式支付市場,預計在預測期內複合年成長率將超過 12%。數位錢包、NFC 卡和行動支付解決方案在日常交易中的廣泛使用正在推動這一領域的發展。零售、交通、旅館和餐飲服務領域採用非接觸式支付方式進一步增強了這一勢頭。消費者更喜歡這些解決方案,因為它們方便、快速、安全,而忠誠度計劃和現金返還優惠則進一步激勵了消費者使用。
中國在亞太地區非接觸式支付市場中處於領先地位,2024 年的收入約為 50 億美元。智慧型手機普及率高、行動錢包的廣泛採用以及政府對數位金融包容性的支持推動了中國在該地區的領導地位。數位支付平台佔據市場主導地位,提供無縫的交易體驗。隨著非接觸式支付技術的不斷發展,中國的金融科技生態系統持續蓬勃發展,確保了亞太地區的持續成長。
目錄
第1章:方法論與範圍
第2章:執行摘要
第3章:行業洞察
- 產業生態系統分析
- 供應商格局
- 支付服務提供者
- 銀行和金融機構
- 商家和零售商
- 最終用途
- 利潤率分析
- 供應商格局
- 技術與創新格局
- 專利分析
- 新創企業概況
- 監管格局
- 衝擊力
- 成長動力
- 北美對行動和穿戴式支付設備的需求
- 生物辨識非接觸式智慧卡需求不斷成長
- 商家擴大採用科技進行小額交易
- 減少交易時間並提高便利性
- 產業陷阱與挑戰
- 銀行和支付協會制定的規則和條例
- 缺乏消費者意識
- 成長動力
- 成長潛力分析
- 波特的分析
- PESTEL分析
第4章:競爭格局
- 介紹
- 公司市佔率分析
- 競爭定位矩陣
- 戰略展望矩陣
第5章:市場估計與預測:按付款方式,2021 - 2034 年
- 主要趨勢
- POS終端
- 智慧卡
- 行動應用程式和錢包
- 穿戴式支付設備
- 其他
第6章:市場估計與預測:依技術分類,2021 - 2034 年
- 主要趨勢
- 近場通訊
- 射頻識別
- 紅外線
- 其他
第7章:市場估計與預測:按應用,2021 - 2034 年
- 主要趨勢
- 零售
- 衛生保健
- 飯店業
- 運輸
- 倉儲與物流
- 其他
第8章:市場估計與預測:依最終用途,2021 - 2034 年
- 主要趨勢
- 消費者(B2C交易)
- 企業(B2B交易)
第9章:市場估計與預測:按地區,2021 - 2034 年
- 主要趨勢
- 北美洲
- 美國
- 加拿大
- 歐洲
- 英國
- 德國
- 法國
- 西班牙
- 義大利
- 俄羅斯
- 北歐人
- 亞太地區
- 中國
- 印度
- 日本
- 韓國
- 澳新銀行
- 東南亞
- 拉丁美洲
- 巴西
- 墨西哥
- 阿根廷
- MEA
- 阿拉伯聯合大公國
- 南非
- 沙烏地阿拉伯
第10章:公司簡介
- Adyen
- Alibaba
- American Express Company
- Apple
- Fiserv
- Ingenico Group
- Mastercard
- Moneris Solutions
- Nayax
- NCR
- On Track Innovations (OTI)
- PayPal
- Samsung Electronics
- Square
- Stripe
- Verifone
- Visa
- WeChat Pay
- Worldpay
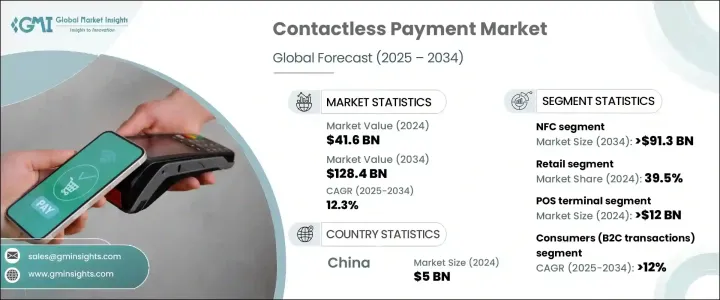
The Global Contactless Payment Market reached USD 41.6 billion in 2024 and is projected to grow at a CAGR of 12.3% between 2025 and 2034. Growing consumer reliance on mobile wallets and smart cards for digital transactions is driving this growth. Wearable devices such as smartwatches, fitness trackers, and other consumer electronics are enhancing the convenience of making payments, contributing to increased adoption. The proliferation of secure and seamless payment technologies encourages financial institutions to promote contactless payment solutions, further expanding the market. As mobile payments evolve, integrating them with access systems, ticketing, and other services ensures widespread use. Secure integration of these payment solutions strengthens consumer trust and accelerates adoption.
Wearable payment technology operates using radio frequency identification (RFID), near-field communication (NFC), and quick response (QR) codes. The contactless point-of-sale (POS) terminals and backend payment infrastructure are extending these capabilities to wearable devices, improving the overall payment ecosystem. NFC technology dominates the market with a share of over 68% and is expected to exceed USD 91.3 billion by 2034. NFC, operating at 13.56 MHz, ensures secure, fast, and reliable transactions between consumer electronic devices and POS terminals. It is widely used in mobile wallets, offering enhanced encryption and authentication, making it a preferred technology for contactless payments. Around three billion smartphones globally are equipped with NFC, allowing secure tap-to-pay transactions.
| Market Scope | |
|---|---|
| Start Year | 2024 |
| Forecast Year | 2025-2034 |
| Start Value | $41.6 Billion |
| Forecast Value | $128.4 Billion |
| CAGR | 12.3% |
Retail remains the largest application segment in the contactless payment market, accounting for 39.5% of the market share in 2024. Digital payment solutions in the retail sector are gaining popularity due to the convenience and efficiency they offer. POS terminals, integrated with mobile and contactless technologies, enable faster transactions, reduce waiting times, and improve customer satisfaction. The rise of digital retail solutions has transformed traditional shopping experiences, where retailers now provide seamless checkout options and advanced inventory management systems. These innovations not only enhance customer engagement but also increase overall operational efficiency.
POS terminals accounted for a significant share of over USD 12 billion in 2024. The increasing adoption of digitalization across industries such as retail, hospitality, transportation, and warehousing is fueling the demand for POS terminals. The integration of wireless technologies like Bluetooth and NFC has made these terminals versatile and secure. As POS systems become compliant with global security standards like EMV, they provide an added layer of safety by creating unique, encrypted transaction codes, reducing the risk of fraud and ensuring secure transactions.
Consumer (B2C transactions) dominate the contactless payment market and are anticipated to grow at a CAGR of over 12% during the forecast period. The widespread use of digital wallets, NFC-enabled cards, and mobile payment solutions for daily transactions is driving this segment. The adoption of contactless payment options in retail, transportation, hospitality, and food services adds to this momentum. Consumers prefer these solutions for their convenience, speed, and security, with loyalty programs and cashback offers providing further incentives for use.
China led the APAC contactless payment market with revenue of approximately USD 5 billion in 2024. High smartphone penetration, widespread adoption of mobile wallets, and government support for digital financial inclusion have propelled China's leadership in the region. Digital payment platforms dominate the market, offering seamless transaction experiences. As contactless payment technology continues to advance, China's fintech ecosystem continues to thrive, ensuring sustained growth in the APAC region.
Table of Contents
Chapter 1 Methodology & Scope
- 1.1 Research design
- 1.1.1 Research approach
- 1.1.2 Data collection methods
- 1.2 Base estimates & calculations
- 1.2.1 Base year calculation
- 1.2.2 Key trends for market estimation
- 1.3 Forecast model
- 1.4 Primary research and validation
- 1.4.1 Primary sources
- 1.4.2 Data mining sources
- 1.5 Market scope & definition
Chapter 2 Executive Summary
- 2.1 Industry 3600 synopsis, 2021 - 2034
Chapter 3 Industry Insights
- 3.1 Industry ecosystem analysis
- 3.1.1 Supplier landscape
- 3.1.1.1 Payment service providers
- 3.1.1.2 Banks & financial institutions
- 3.1.1.3 Merchants & retailers
- 3.1.1.4 End use
- 3.1.2 Profit margin analysis
- 3.1.1 Supplier landscape
- 3.2 Technology & innovation landscape
- 3.3 Patent analysis
- 3.4 Start-up landscape
- 3.5 Regulatory landscape
- 3.6 Impact forces
- 3.6.1 Growth drivers
- 3.6.1.1 Demand for mobile and wearable payment devices in North America
- 3.6.1.2 Growing demand for biometric contactless smart cards
- 3.6.1.3 Rising adoption of technology by merchants for small value transactions
- 3.6.1.4 Reduced transaction time and increased convenience
- 3.6.2 Industry pitfalls & challenges
- 3.6.2.1 Rules and regulations imposed by banks and payment associations
- 3.6.2.2 Lack of consumer awareness
- 3.6.1 Growth drivers
- 3.7 Growth potential analysis
- 3.8 Porter's analysis
- 3.9 PESTEL analysis
Chapter 4 Competitive Landscape, 2024
- 4.1 Introduction
- 4.2 Company market share analysis
- 4.3 Competitive positioning matrix
- 4.4 Strategic outlook matrix
Chapter 5 Market Estimates & Forecast, By Payment, 2021 - 2034 ($Bn, Transactional Value, Transactional Volume)
- 5.1 Key trends
- 5.2 POS terminals
- 5.3 Smart card
- 5.4 Mobile apps & wallets
- 5.5 Wearable payment devices
- 5.6 Other
Chapter 6 Market Estimates & Forecast, By Technology, 2021 - 2034 ($Bn, Transactional Value, Transactional Volume)
- 6.1 Key trends
- 6.2 NFC
- 6.3 RFID
- 6.4 IR
- 6.5 Others
Chapter 7 Market Estimates & Forecast, By Application, 2021 - 2034 ($Bn, Transactional Value, Transactional Volume)
- 7.1 Key trends
- 7.2 Retail
- 7.3 Healthcare
- 7.4 Hospitality
- 7.5 Transportation
- 7.6 Warehouse & logistics
- 7.7 Others
Chapter 8 Market Estimates & Forecast, By End Use, 2021 - 2034 ($Bn, Transactional Value, Transactional Volume)
- 8.1 Key trends
- 8.2 Consumers (B2C transactions)
- 8.3 Enterprises (B2B transactions)
Chapter 9 Market Estimates & Forecast, By Region, 2021 - 2034 ($Bn, Transactional Value, Transactional Volume)
- 9.1 Key trends
- 9.2 North America
- 9.2.1 U.S.
- 9.2.2 Canada
- 9.3 Europe
- 9.3.1 UK
- 9.3.2 Germany
- 9.3.3 France
- 9.3.4 Spain
- 9.3.5 Italy
- 9.3.6 Russia
- 9.3.7 Nordics
- 9.4 Asia Pacific
- 9.4.1 China
- 9.4.2 India
- 9.4.3 Japan
- 9.4.4 South Korea
- 9.4.5 ANZ
- 9.4.6 Southeast Asia
- 9.5 Latin America
- 9.5.1 Brazil
- 9.5.2 Mexico
- 9.5.3 Argentina
- 9.6 MEA
- 9.6.1 UAE
- 9.6.2 South Africa
- 9.6.3 Saudi Arabia
Chapter 10 Company Profiles
- 10.1 Adyen
- 10.2 Alibaba
- 10.3 American Express Company
- 10.4 Apple
- 10.5 Fiserv
- 10.6 Google
- 10.7 Ingenico Group
- 10.8 Mastercard
- 10.9 Moneris Solutions
- 10.10 Nayax
- 10.11 NCR
- 10.12 On Track Innovations (OTI)
- 10.13 PayPal
- 10.14 Samsung Electronics
- 10.15 Square
- 10.16 Stripe
- 10.17 Verifone
- 10.18 Visa
- 10.19 WeChat Pay
- 10.20 Worldpay
 2026年Android非接觸式支付全球市場報告
 非接觸式支付市場:按技術、終端、終端用戶和應用分類-2026-2032年全球市場預測工業PDA市場:按類型、作業系統、連接方式、分銷管道、應用和最終用戶分類,全球預測,2026-2032年
 行動NFC支付市場分析及預測(至2035年):依類型、產品類型、服務、技術、組件、應用、設備、部署模式、最終用戶及功能分類非接觸式支付市場分析及預測(至2035年):依類型、產品類型、服務、技術、組件、應用、設備、部署模式及最終用戶分類近距離支付市場分析及預測(至2035年):依類型、產品類型、服務、技術、組件、應用、設備、最終用戶、功能及部署方式分類
 非接觸式支付市場規模、佔有率、成長及全球產業分析:按類型、應用和地區分類的洞察,以及2026-2034年的預測非接觸式支付全球市場規模、佔有率、趨勢和成長分析報告(2026-2034)依最終用戶、應用程式類型、作業系統、連接方式、部署方式和銷售管道的電子支付用PDA市場,全球預測,2026-2032年
 非接觸式支付市場預測至2032年:按技術、設備類型、解決方案、應用、最終用戶和地區分類的全球分析