

 |
市場調查報告書
商品編碼
1664856
授權玩具市場機會、成長動力、產業趨勢分析與 2024 - 2032 年預測Licensed Toy Market Opportunity, Growth Drivers, Industry Trend Analysis, and Forecast 2024 - 2032 |
||||||
2023 年全球授權玩具市場價值為 289 億美元,預計 2024 年至 2032 年期間將以 4.7% 的強勁年複合成長率(CAGR) 成長。 擴增實境 (AR)、虛擬實境 (VR) 和人工智慧 (AI) 等技術創新正在成為授權玩具的重要組成部分,增強了其互動性和吸引力。這些科技驅動的玩具通常與知名品牌有關,它們正在激發當今精通科技的消費者的更大參與度並推動其需求。
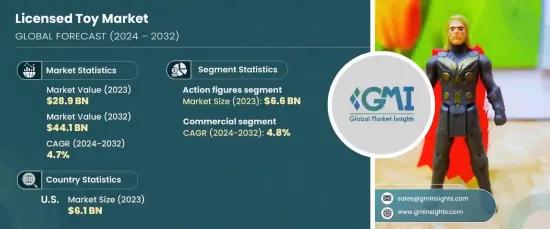
授權玩具市場按產品類型細分,包括動作人物、玩偶和毛絨玩具、工藝品、遊戲和拼圖、戶外和運動玩具、建築套裝、益智玩具等。其中,2023 年可動人偶市場價值為 66 億美元,預計 2024 年至 2032 年期間複合年成長率將達到 5.4%。專注於高品質、可收藏人物模型的公司繼續滿足愛好者的需求,為該行業的收入做出了重大貢獻。
| 市場範圍 | |
|---|---|
| 起始年份 | 2023 |
| 預測年份 | 2024-2032 |
| 起始值 | 289億美元 |
| 預測值 | 441億美元 |
| 複合年成長率 | 4.7% |
從最終用途來看,授權玩具市場分為個人類和商業類。商業領域在 2023 年佔據了 56% 的市場佔有率,預計在 2024 年至 2032 年期間的成長率將達到 4.8%。此外,與娛樂特許經營的合作通常會帶來獨家產品的推出,進一步刺激商業領域的需求。許多受歡迎的特許經營商策略性地使用授權玩具作為主題公園景點和活動商品的核心部分。
2023 年,美國授權玩具市場價值為 61 億美元,預計到 2032 年將以 4.8% 的複合年成長率成長。熱心收藏家社群和粉絲大會的存在繼續推動對授權產品的需求,從而創造了一個充滿活力且不斷發展的市場。美國不僅是授權玩具市場的重要參與者,也是潮流引領者,影響著該產業的全球轉變。
目錄
第 1 章:方法論與範圍
- 市場範圍和定義
- 基礎估算與計算
- 預測計算。
- 資料來源
- 基本的
- 次要
- 付費來源
- 公共資源
第 2 章:執行摘要
第 3 章:產業洞察
- 產業生態系統分析
- 影響價值鏈的因素
- 利潤率分析
- 中斷
- 未來展望
- 製造商
- 經銷商
- 供應商概況
- 利潤率分析
- 重要新聞及舉措
- 監管格局
- 衝擊力
- 成長動力
- 系列和角色玩具的受歡迎程度
- 專注於教育和 STEM 玩具
- 產業陷阱與挑戰
- 許可成本高
- 成長動力
- 成長潛力分析
- 波特的分析
- PESTEL 分析
第4章:競爭格局
- 介紹
- 公司市佔率分析
- 競爭定位矩陣
- 戰略展望矩陣
第 5 章:市場估計與預測:按產品類型,2021-2032 年
- 主要趨勢
- 活動人物
- 娃娃和毛絨玩具
- 藝術與手工藝
- 遊戲和謎題
- 戶外及運動玩具
- 建築套件
- 益智玩具
- 其他(車輛等)
第6章:市場估計與預測:依價格範圍,2021-2032 年
- 主要趨勢
- 低的
- 中等的
- 高的
第7章:市場估計與預測:依年齡層,2021-2032 年
- 主要趨勢
- 1 歲以下
- 1- 3歲
- 3- 5歲
- 年齡 5- 12 歲
- 年齡 12 歲以上
第 8 章:市場估計與預測:依最終用途,2021-2032 年
- 主要趨勢
- 個人
- 商業的
第 9 章:市場估計與預測:按配銷通路,2021-2032 年
- 主要趨勢
- 線上
- 電子商務網站
- 公司自有網站
- 離線
- 大賣場/超市
- 百貨公司
- 專賣店
- 其他零售店
第 10 章:市場估計與預測:按地區,2021-2032 年
- 主要趨勢
- 北美洲
- 美國
- 加拿大
- 歐洲
- 英國
- 德國
- 法國
- 義大利
- 西班牙
- 俄羅斯
- 亞太地區
- 中國
- 印度
- 日本
- 韓國
- 澳洲
- 拉丁美洲
- 巴西
- 墨西哥
- 中東及非洲
- 阿拉伯聯合大公國
- 沙烏地阿拉伯
- 南非
第 11 章:公司簡介
- Bandai Namco Holdings Inc.
- Basic Fun!
- Fisher-Price (Division of Mattel)
- Funko Inc.
- Hasbro Inc.
- JAKKS Pacific Inc.
- LEGO Group
- Mattel Inc.
- Mega Brands Inc. (Owned by Mattel)
- Melissa & Doug LLC
- Playmobil (Brand of Geobra Brandstätter Stiftung & Co. KG)
- Ravensburger AG
- Spin Master Corp.
- Tomy Company Ltd.
- VTech Holdings Ltd.
The Global Licensed Toy Market was valued at USD 28.9 billion in 2023 and is projected to grow at a robust compound annual growth rate (CAGR) of 4.7% from 2024 to 2032. Innovations in technology, including augmented reality (AR), virtual reality (VR), and artificial intelligence (AI), are becoming essential components of licensed toys, enhancing their interactivity and appeal. These tech-driven toys, often associated with well-known franchises, are fueling greater engagement and driving up demand among today's tech-savvy consumers.
The licensed toy market is segmented by product type, which includes action figures, dolls and plush toys, arts and crafts, games and puzzles, outdoor and sports toys, construction sets, educational toys, and more. Among these, the action figures segment was valued at USD 6.6 billion in 2023 and is expected to grow at a strong CAGR of 5.4% from 2024 to 2032. The enduring popularity of action figures, often tied to successful movie franchises, TV shows, and video games, ensures a constant flow of consumer interest. Companies focusing on high-quality, collectible action figures continue to cater to enthusiasts, significantly contributing to the sector's revenue generation.
| Market Scope | |
|---|---|
| Start Year | 2023 |
| Forecast Year | 2024-2032 |
| Start Value | $28.9 Billion |
| Forecast Value | $44.1 Billion |
| CAGR | 4.7% |
From an end-use perspective, the licensed toy market is divided into individual and commercial categories. The commercial segment held 56% of the market share in 2023 and is anticipated to experience a growth rate of 4.8% from 2024 to 2032. Large retail chains and specialty toy stores play a crucial role in the distribution of licensed toys, ensuring widespread availability and securing prime shelf space for these coveted products. Moreover, collaborations with entertainment franchises often result in exclusive product launches, further boosting demand in the commercial sector. Many popular franchises strategically use licensed toys as a core part of their merchandise for theme park attractions and events.
The U.S. licensed toy market was valued at USD 6.1 billion in 2023 and is projected to grow at a CAGR of 4.8% through 2032. As the home of major entertainment companies, the U.S. remains a central hub for licensed toys, particularly during the release of new content tied to popular franchises. The presence of avid collector communities and fan conventions continues to drive demand for licensed products, creating a dynamic and ever-evolving market. The U.S. is not only a key player in the licensed toy market but also a trendsetter, influencing global shifts in the industry.
Table of Contents
Chapter 1 Methodology & Scope
- 1.1 Market scope & definitions
- 1.2 Base estimates & calculations
- 1.3 Forecast calculations.
- 1.4 Data sources
- 1.4.1 Primary
- 1.4.2 Secondary
- 1.4.2.1 Paid sources
- 1.4.2.2 Public sources
Chapter 2 Executive Summary
- 2.1 Industry synopsis, 2021-2032
Chapter 3 Industry Insights
- 3.1 Industry ecosystem analysis
- 3.1.1 Factor affecting the value chain
- 3.1.2 Profit margin analysis
- 3.1.3 Disruptions
- 3.1.4 Future outlook
- 3.1.5 Manufacturers
- 3.1.6 Distributors
- 3.2 Supplier landscape
- 3.3 Profit margin analysis
- 3.4 Key news & initiatives
- 3.5 Regulatory landscape
- 3.6 Impact forces
- 3.6.1 Growth drivers
- 3.6.1.1 Popularity of franchise and character-based toys
- 3.6.1.2 Focus on educational and STEM toys
- 3.6.2 Industry pitfalls & challenges
- 3.6.2.1 High licensing costs
- 3.6.1 Growth drivers
- 3.7 Growth potential analysis
- 3.8 Porter’s analysis
- 3.9 PESTEL analysis
Chapter 4 Competitive Landscape, 2023
- 4.1 Introduction
- 4.2 Company market share analysis
- 4.3 Competitive positioning matrix
- 4.4 Strategic outlook matrix
Chapter 5 Market Estimates & Forecast, By Product Type, 2021-2032 (USD Billion) (Billion Units)
- 5.1 Key trends
- 5.2 Action figures
- 5.3 Dolls & plush toys
- 5.4 Arts & crafts
- 5.5 Games & puzzles
- 5.6 Outdoor & sports toys
- 5.7 Construction sets
- 5.8 Educational toys
- 5.9 Others (Vehicles, Etc)
Chapter 6 Market Estimates & Forecast, By Price Range, 2021-2032 (USD Billion) (Billion Units)
- 6.1 Key trends
- 6.2 Low
- 6.3 Medium
- 6.4 High
Chapter 7 Market Estimates & Forecast, By Age Group, 2021-2032 (USD Billion) (Billion Units)
- 7.1 Key trends
- 7.2 Below 1 Yrs.
- 7.3 Age 1- 3
- 7.4 Age 3- 5
- 7.5 Age 5- 12
- 7.6 Age 12+
Chapter 8 Market Estimates & Forecast, By End Use, 2021-2032 (USD Billion) (Billion Units)
- 8.1 Key trends
- 8.2 Individual
- 8.3 Commercial
Chapter 9 Market Estimates & Forecast, By Distribution Channel, 2021-2032 (USD Billion) (Billion Units)
- 9.1 Key trends
- 9.2 Online
- 9.2.1 E-Commerce website
- 9.2.2 Company owned website
- 9.3 Offline
- 9.3.1 Hypermarket/Supermarket
- 9.3.2 Departmental stores
- 9.3.3 Specialized stores
- 9.3.4 Other retail stores
Chapter 10 Market Estimates & Forecast, By Region, 2021-2032 (USD Billion) (Billion Units)
- 10.1 Key trends
- 10.2 North America
- 10.2.1 U.S.
- 10.2.2 Canada
- 10.3 Europe
- 10.3.1 UK
- 10.3.2 Germany
- 10.3.3 France
- 10.3.4 Italy
- 10.3.5 Spain
- 10.3.6 Russia
- 10.4 Asia Pacific
- 10.4.1 China
- 10.4.2 India
- 10.4.3 Japan
- 10.4.4 South Korea
- 10.4.5 Australia
- 10.5 Latin America
- 10.5.1 Brazil
- 10.5.2 Mexico
- 10.6 MEA
- 10.6.1 UAE
- 10.6.2 Saudi Arabia
- 10.6.3 South Africa
Chapter 11 Company Profiles
- 11.1 Bandai Namco Holdings Inc.
- 11.2 Basic Fun!
- 11.3 Fisher-Price (Division of Mattel)
- 11.4 Funko Inc.
- 11.5 Hasbro Inc.
- 11.6 JAKKS Pacific Inc.
- 11.7 LEGO Group
- 11.8 Mattel Inc.
- 11.9 Mega Brands Inc. (Owned by Mattel)
- 11.10 Melissa & Doug LLC
- 11.11 Playmobil (Brand of Geobra Brandstätter Stiftung & Co. KG)
- 11.12 Ravensburger AG
- 11.13 Spin Master Corp.
- 11.14 Tomy Company Ltd.
- 11.15 VTech Holdings Ltd.
 授權體育用品市場:按產品類型、運動項目、授權類型、分銷管道、最終用戶和性別分類-2026-2032年全球市場預測
 2026-2030年全球授權運動用品市場
 授權體育用品市場分析及預測(至2035年):類型、產品類型、服務、技術、組件、應用、最終用戶、部署形式、模式和解決方案
 全球授權體育用品市場規模、佔有率、趨勢和成長分析報告(2026-2034年)
 授權體育用品市場報告:按產品類型、分銷管道、價格範圍、最終用戶和地區分類(2026-2034 年)
 授權體育用品市場規模、佔有率及成長分析(按產品、通路、最終用戶和地區分類)-2026-2033年產業預測
 全球授權玩具市場
 授權體育產品市場報告:2030 年趨勢、預測與競爭分析