


 |
市場調查報告書
商品編碼
1289003
3D列印材料市場 - 按產品,按終端用戶,3D列印設備市場 - 按產品及全球預測,2023-2032年3D Printing Materials Market - By Product, By End-user, 3D Printing Equipment Market - By Product & Global Forecast, 2023-2032 |
||||||
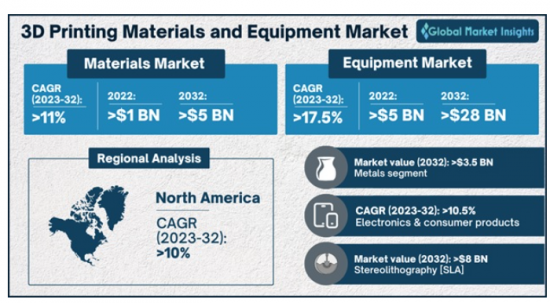
全球3D列印材料和設備市場將在2032年之前獲得大幅成長,主要原因是3D列印技術的進步。此外,電子行業在全球範圍內蓬勃發展,與電子相關的商業機會不斷擴大,也將促進市場在預計時間範圍內的成長。
雖然3D列印材料市場已按產品和最終用戶以及地區分類,但3D列印設備市場也已按產品和地區分類。
就基於材料的產品部分而言,3D列印材料市場可能通過陶瓷部分來定義,到2032年底將以超過9.5%的年復合成長率擴張。現有的公司正在尋求通過有意義的收購來擴大其投資組合,從而促進了市場需求。例如,2022年10月,總部位於奧地利的Lithoz公司收購了德國初創公司CerAMing,以利用其開創的LSD(層間漿料處置)過程。這一計劃預計將擴大該公司的陶瓷3D列印組合。
在終端用戶方面,3D列印材料市場是通過工業領域來定義的。由於3D列印是靈活的,允許製造商決定產品的質地、形狀和強度,因此它們被廣泛用於各種行業。不斷增加的工業生產可能會促進2032年的市場成長。
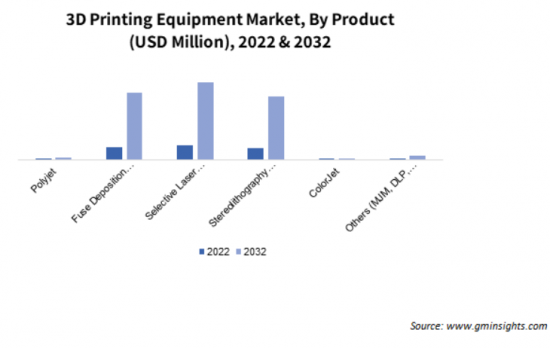
基於產品部分,3D列印設備市場可能以聚能噴射器子部分為特徵。聚酯噴射器有一系列的功用,目前的一些市場營運商正試圖通過推出新的基於聚酯噴射器的3D列印機來擴大其投資組合。例如,2021年7月,聚合物3D列印解決方案的領導者Stratasys有限公司推出了兩款新的PolyJet^(TM)3D列印機,Stratasys J55^(TM)和Stratasys J35^(TM)Pro。 J55 Prime包括新的多功能材料,提供紡織、觸覺、感官功能和全彩,而J35 Pro則代表了第一台用於台式機的多材料3D列印機。
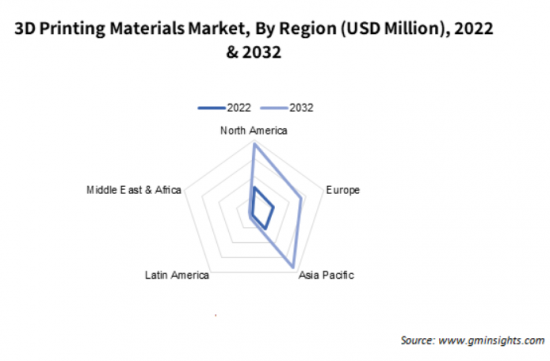
就地區而言,北美3D列印設備市場預計將在2023-2032年期間經歷超過17%的複合年成長率的穩固成長。技術進步和現有產業的擴張是促進2023年至2032年期間市場成長的主要因素。舉個例子,2022年7月,吉凱恩航太公司宣布將其設備搬遷到德克薩斯州的一個10萬平方英尺的設施。該設施將使該公司能夠專注於雷射金屬線沉積,這是一種3D列印技術,然後將用於建造大規模的鈦航空結構。
目錄
第一章:方法和範圍
第二章:執行摘要
第三章:幕牆行業洞察力
- 行業細分
- 行業規模和預測,2018 - 2032
- COVID-19對行業格局的影響
- 行業生態系統分析
- 供應商矩陣
- 配銷通路分析
- COVID-19對行業價值鏈的影響
- 技術格局
- 行業影響力量
- 成長動力
- 與3D列印相關的技術進步
- 與汽車和航太領域相關的有利趨勢
- 電子行業的積極前景
- 行業隱患和挑戰
- 與3D列印設備相關的高成本
- 成長動力
- 監管情況
- 美國
- 歐洲
- 中國
- 成長潛力分析,2022年
- 價格分析
- 波特的分析
- PESTEL分析
第四章:競爭格局
- 簡介
- 公司市場佔有率分析,2022年
- 北美市場佔有率分析,2022年
- 2022年歐洲市場佔有率分析
- 亞太地區市場佔有率分析,2022年
- 拉丁美洲市場佔有率分析,2022年
- 2022年MEA市場佔有率分析
- 戰略儀表板
第五章:3D列印材料市場:按產品分類
- 全球3D列印材料市場的產品洞察力
- 陶瓷
- 塑膠
- 金屬
- 其他
第六章:3D列印材料市場:按終端用戶分類
- 全球3D列印材料市場的終端用戶洞察力
- 電子和消費產品
- 汽車
- 醫療
- 工業
- 教育行業
- 航太
- 其他
第七章:3D列印設備市場:按產品分類
- 全球3D列印設備市場的產品洞察力
- 寶利捷
- 熔融沈積成型(FDM)
- 選擇性雷射燒結(SLS)
- 立體光刻(SLA)
- 彩色噴氣機
- 其他
第八章:3D列印材料和設備市場:按地區分類
- 3D列印材料和設備市場收入佔有率,按地區分類
- 北美洲
- 美國
- 加拿大
- 歐洲
- 德國
- 英國
- 法國
- 西班牙
- 義大利
- 亞太地區
- 中國
- 印度
- 日本
- 澳大利亞
- 印尼
- 馬來西亞
- 拉丁美洲
- 巴西
- 墨西哥
- 中東和非洲
- 南非
- 海灣合作委員會
第九章:公司簡介
- Höganäs AB
- Concept Laser GmbH
- 3D Systems, Inc.
- Stratasys Ltd.
- Arkema SA
- Arcam AB
- Solidscape, Inc.
- EOS GmbH (Electro Optical Systems)
- ExOne
- Voxeljet AG
- Royal DSM NV
- EnvisionTEC GmbH
- LPW Technology, Ltd.
- SLM Solutions
- Optomec
Global 3D Printing Materials and Equipment Market is poised to gain significant growth through 2032, primarily owing to the technological advancements in 3D printing. Besides, the electronics industry is thriving across the world, and the expanding electronics-related business opportunity will also foster market growth through the estimated timespan.
While the 3D printing material market has been divided in terms of product and end user, and region, the 3D printing equipment market has also been divided in terms of product and region.
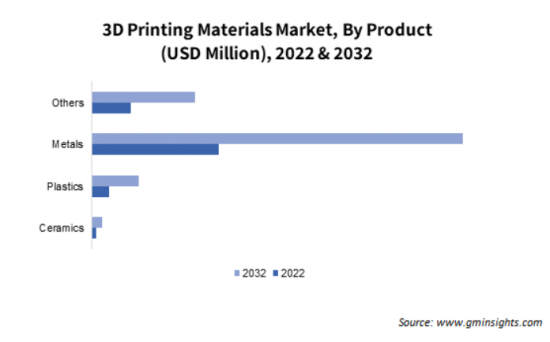
In terms of the material-based product segment, the 3D printing materials market is likely to be defined through the ceramics segment which will expand at over 9.5% CAGR by 2032 end. Existing firms are seeking the expansion of their portfolios through meaningful acquisitions, thus fostering the market demand. For instance, in October 2022, Lithoz, an Austria-based firm acquired CerAMing, a German startup, to utilize its pioneered process of LSD (layer-wise slurry disposition). The initiative is projected to expand the company's ceramic 3D printing portfolio.
In the context of end user, the 3D printing materials market is defined through the industrial segment. Since 3D printing is flexible and allows manufacturers determine the texture, shape, and strength of a product, they are used in a wide range of industries. Increasing industrial production is likely to foster the market growth through 2032.
Based on the product segment, the 3D printing equipment market is likely to be characterized by the polyjet subsegment. Polyjets have a range of utilities and some of the current market operators are trying to expand their portfolios by introducing new polyjet-based 3D printers. For instance, in July 2021, a leader in polymer 3D printing solutions, Stratasys Ltd., launched two new PolyJet^™ 3D printers, the Stratasys J55^™ and the Stratasys J35^™ Pro. While the J55 Prime includes new versatile materials providing textile, tactile, sensory capabilities, and full color, the J35 Pro represents the first multi-material 3D printer for desktops.
In terms of region, the North America 3D printing equipment market is anticipated to experience a solid growth of over 17% CAGR during 2023-2032. Technological advancements and the expansion of existing industries are the major factors augmenting the market growth between 2023 and 2032. To cite an instance, in July 2022, GKN Aerospace announced relocating its equipment to a 100,000 sq. ft. facility in Texas. The facility would enable the company to focus on laser metal deposition with wire, a 3D printing technology, which will then be used to build large-scale titanium aerostructures.
Table of Contents
Chapter 1. Methodology & Scope
- 1.1. Market definition
- 1.2. Base estimates & calculations
- 1.3. Forecast calculation
- 1.4. Data Sources
- 1.4.1. Secondary
- 1.4.1.1. Paid sources
- 1.4.1.2. Public sources
- 1.4.2. Primary
- 1.4.1. Secondary
Chapter 2. Executive Summary
- 2.1. 3D Printing Materials Industry 360° synopsis, 2018 - 2032
- 2.2. Business trends
- 2.3. Regional trends
- 2.4. Product trends
- 2.5. End User trends
- 2.6. Equipment trends
Chapter 3. 3D Printing Materials Industry Insights
- 3.1. Industry ecosystem analysis
- 3.1.1. Profit margin
- 3.1.2. Vendor matrix
- 3.1.3. Distribution channel analysis
- 3.1.4. Impact of COVID-19 on industry value chain
- 3.2. Technology landscape
- 3.3. Raw material analysis
- 3.3.1. COVID-19 impact on raw material supply
- 3.4. Pricing analysis
- 3.4.1. Pricing analysis by region
- 3.4.2. Cost structure analysis, 2022
- 3.5. Regulatory landscape
- 3.6. Innovation & Sustainability
- 3.7. Industry impact forces
- 3.7.1. Growth drivers
- 3.7.1.1. Technological Advancements
- 3.7.1.2. Growing Adoption Across Industries
- 3.7.1.3. Customization and Personalization
- 3.7.2. Industry pitfalls & challenges
- 3.7.2.1. Intellectual Property and Counterfeiting Concerns
- 3.7.1. Growth drivers
- 3.8. Growth potential analysis
- 3.8.1. Emerging business model
- 3.9. COVID- 19 impact analysis
- 3.10. Porter's analysis
- 3.10.1. Buyer's power
- 3.10.2. Supplier power
- 3.10.3. Threat of substitutes
- 3.10.4. Threat of new entrants
- 3.10.5. Degree of competition
- 3.11. PESTEL analysis
- 3.12. Impact of COVID-19 on 3D Printing Materials market
- 3.13. Impact of Russia-Ukraine war on 3D Printing Materials market
Chapter 4. Competitive Landscape, 2022
- 4.1. Introduction
- 4.2. Company market share, 2022
- 4.2.1. Global Company Market Share, 2022
- 4.2.2. North America Company Market Share, 2022
- 4.2.3. Europe Company Market Share, 2022
- 4.2.4. APAC Company Market Share, 2022
- 4.2.5. LATAM Company Market Share, 2022
- 4.2.6. MEA Company Market Share, 2022
- 4.3. Top player overview
- 4.4. Strategy dashboard
Chapter 5. 3D Printing Materials Market Size and Forecast, By Product (Tons & USD Million)
- 5.1. Key trends, by product
- 5.2. Ceramics
- 5.3. Plastics
- 5.4. Metals
- 5.5. Others
Chapter 6. 3D Printing Materials Market Size and Forecast, By End User (Tons & USD Million)
- 6.1. Key trends, by end user
- 6.2. Electronics & consumer products
- 6.3. Automotive
- 6.4. Medical
- 6.5. Industrial
- 6.6. Education
- 6.7. Aerospace
- 6.8. Others
Chapter 7. 3D Printing Equipment Market Size and Forecast, By Equipment (Tons & USD Million)
- 7.1. Key trends, by equipment
- 7.2. Polyjet
- 7.3. Fuse deposition modelling (FDM)
- 7.4. Selective laser sintering (SLS)
- 7.5. Stereolithography (SLA)
- 7.6. Colorjet
- 7.7. Others
Chapter 8. 3D Printing Materials Market Size and Forecast, By Region (Tons & USD Million)
- 8.1. Key trends, by region
- 8.2. North America
- 8.2.1. Market estimates & forecast, 2018-2032
- 8.2.2. Market estimates & forecast, by product, 2018-2032
- 8.2.3. Market estimates & forecast, by end user, 2018-2032
- 8.2.4. Market estimates & forecast, by equipment, 2018-2032
- 8.2.5. U.S.
- 8.2.5.1. Market estimates & forecast, 2018-2032
- 8.2.5.2. Market estimates & forecast, by product, 2018-2032
- 8.2.5.3. Market estimates & forecast, by end user, 2018-2032
- 8.2.5.4. Market estimates & forecast, by equipment, 2018-2032
- 8.2.6. Canada
- 8.2.6.1. Market estimates & forecast, 2018-2032
- 8.2.6.2. Market estimates & forecast, by product, 2018-2032
- 8.2.6.3. Market estimates & forecast, by end user, 2018-2032
- 8.2.6.4. Market estimates & forecast, by equipment, 2018-2032
- 8.3. Europe
- 8.3.1. Market estimates & forecast, 2018-2032
- 8.3.2. Market estimates & forecast, by product, 2018-2032
- 8.3.3. Market estimates & forecast, by end user, 2018-2032
- 8.3.4. Market estimates & forecast, by equipment, 2018-2032
- 8.3.5. Germany
- 8.3.6. Market estimates & forecast, 2018-2032
- 8.3.7. Market estimates & forecast, by product, 2018-2032
- 8.3.8. Market estimates & forecast, by end user, 2018-2032
- 8.3.9. Market estimates & forecast, by equipment, 2018-2032
- 8.3.10. UK
- 8.3.11. Market estimates & forecast, 2018-2032
- 8.3.12. Market estimates & forecast, by product, 2018-2032
- 8.3.13. Market estimates & forecast, by end user, 2018-2032
- 8.3.14. Market estimates & forecast, by equipment, 2018-2032
- 8.3.15. France
- 8.3.16. Market estimates & forecast, 2018-2032
- 8.3.17. Market estimates & forecast, by product, 2018-2032
- 8.3.18. Market estimates & forecast, by end user, 2018-2032
- 8.3.19. Market estimates & forecast, by equipment, 2018-2032
- 8.3.20. Spain
- 8.3.21. Market estimates & forecast, 2018-2032
- 8.3.22. Market estimates & forecast, by product, 2018-2032
- 8.3.23. Market estimates & forecast, by end user, 2018-2032
- 8.3.24. Market estimates & forecast, by equipment, 2018-2032
- 8.3.25. Italy
- 8.3.26. Market estimates & forecast, 2018-2032
- 8.3.27. Market estimates & forecast, by product, 2018-2032
- 8.3.28. Market estimates & forecast, by end user, 2018-2032
- 8.3.29. Market estimates & forecast, by equipment, 2018-2032
- 8.3.30. Russia
- 8.3.31. Market estimates & forecast, 2018-2032
- 8.3.32. Market estimates & forecast, by product, 2018-2032
- 8.3.33. Market estimates & forecast, by end user, 2018-2032
- 8.3.34. Market estimates & forecast, by equipment, 2018-2032
- 8.4. Asia Pacific
- 8.4.1. Market estimates & forecast, 2018-2032
- 8.4.2. Market estimates & forecast, by product, 2018-2032
- 8.4.3. Market estimates & forecast, by end user, 2018-2032
- 8.4.4. Market estimates & forecast, by equipment, 2018-2032
- 8.4.5. Japan
- 8.4.6. Market estimates & forecast, 2018-2032
- 8.4.7. Market estimates & forecast, by product, 2018-2032
- 8.4.8. Market estimates & forecast, by end user, 2018-2032
- 8.4.9. Market estimates & forecast, by equipment, 2018-2032
- 8.4.10. China
- 8.4.11. Market estimates & forecast, 2018-2032
- 8.4.12. Market estimates & forecast, by product, 2018-2032
- 8.4.13. Market estimates & forecast, by end user, 2018-2032
- 8.4.14. Market estimates & forecast, by equipment, 2018-2032
- 8.4.15. India
- 8.4.16. Market estimates & forecast, 2018-2032
- 8.4.17. Market estimates & forecast, by product, 2018-2032
- 8.4.18. Market estimates & forecast, by end user, 2018-2032
- 8.4.19. Market estimates & forecast, by equipment, 2018-2032
- 8.4.20. Australia
- 8.4.21. Market estimates & forecast, 2018-2032
- 8.4.22. Market estimates & forecast, by product, 2018-2032
- 8.4.23. Market estimates & forecast, by end user, 2018-2032
- 8.4.24. Market estimates & forecast, by equipment, 2018-2032
- 8.4.25. South Korea
- 8.4.26. Market estimates & forecast, 2018-2032
- 8.4.27. Market estimates & forecast, by product, 2018-2032
- 8.4.28. Market estimates & forecast, by end user, 2018-2032
- 8.4.29. Market estimates & forecast, by equipment, 2018-2032
- 8.4.30. Indonesia
- 8.4.31. Market estimates & forecast, 2018-2032
- 8.4.32. Market estimates & forecast, by product, 2018-2032
- 8.4.33. Market estimates & forecast, by end user, 2018-2032
- 8.4.34. Market estimates & forecast, by equipment, 2018-2032
- 8.5. Latin America
- 8.5.1. Market estimates & forecast, 2018-2032
- 8.5.2. Market estimates & forecast, by product, 2018-2032
- 8.5.3. Market estimates & forecast, by end user, 2018-2032
- 8.5.4. Market estimates & forecast, by equipment, 2018-2032
- 8.5.5. Brazil
- 8.5.6. Market estimates & forecast, 2018-2032
- 8.5.7. Market estimates & forecast, by product, 2018-2032
- 8.5.8. Market estimates & forecast, by end user, 2018-2032
- 8.5.9. Market estimates & forecast, by equipment, 2018-2032
- 8.5.10. Mexico
- 8.5.11. Market estimates & forecast, 2018-2032
- 8.5.12. Market estimates & forecast, by product, 2018-2032
- 8.5.13. Market estimates & forecast, by end user, 2018-2032
- 8.5.14. Market estimates & forecast, by equipment, 2018-2032
- 8.6. MEA
- 8.6.1. Market estimates & forecast, 2018-2032
- 8.6.2. Market estimates & forecast, by product, 2018-2032
- 8.6.3. Market estimates & forecast, by end user, 2018-2032
- 8.6.4. Market estimates & forecast, by equipment, 2018-2032
- 8.6.5. South Africa
- 8.6.6. Market estimates & forecast, 2018-2032
- 8.6.7. Market estimates & forecast, by product, 2018-2032
- 8.6.8. Market estimates & forecast, by end user, 2018-2032
- 8.6.9. Market estimates & forecast, by equipment, 2018-2032
- 8.6.10. Saudi Arabia
- 8.6.11. Market estimates & forecast, 2018-2032
- 8.6.12. Market estimates & forecast, by product, 2018-2032
- 8.6.13. Market estimates & forecast, by end user, 2018-2032
- 8.6.14. Market estimates & forecast, by equipment, 2018-2032
- 8.6.15. UAE
- 8.6.16. Market estimates & forecast, 2018-2032
- 8.6.17. Market estimates & forecast, by product, 2018-2032
- 8.6.18. Market estimates & forecast, by end user, 2018-2032
- 8.6.19. Market estimates & forecast, by equipment, 2018-2032
Chapter 9. Company Profiles
- 9.1. 3D Systems
- 9.1.1. Business overview
- 9.1.2. Financial data
- 9.1.3. Product landscape
- 9.1.4. Strategic outlook
- 9.1.5. SWOT analysis
- 9.2. Stratasys
- 9.2.1. Business overview
- 9.2.2. Financial data
- 9.2.3. Product landscape
- 9.2.4. Strategic outlook
- 9.2.5. SWOT analysis
- 9.3. ExOne
- 9.3.1. Business overview
- 9.3.2. Financial data
- 9.3.3. Product landscape
- 9.3.4. Strategic outlook
- 9.3.5. SWOT analysis
- 9.4. EOS
- 9.4.1. Business overview
- 9.4.2. Financial data
- 9.4.3. Product landscape
- 9.4.4. Strategic outlook
- 9.4.5. SWOT analysis
- 9.5. Materialise
- 9.5.1. Business overview
- 9.5.2. Financial data
- 9.5.3. Product landscape
- 9.5.4. Strategic outlook
- 9.5.5. SWOT analysis
- 9.6. Arkema
- 9.6.1. Business overview
- 9.6.2. Financial data
- 9.6.3. Product landscape
- 9.6.4. Strategic outlook
- 9.6.5. SWOT analysis
- 9.7. DSM
- 9.7.1. Business overview
- 9.7.2. Financial data
- 9.7.3. Product landscape
- 9.7.4. Strategic outlook
- 9.7.5. SWOT analysis
- 9.8. SABIC
- 9.8.1. Business overview
- 9.8.2. Financial data
- 9.8.3. Product landscape
- 9.8.4. Strategic outlook
- 9.8.5. SWOT analysis
- 9.9. BASF
- 9.9.1. Business overview
- 9.9.2. Financial data
- 9.9.3. Product landscape
- 9.9.4. Strategic outlook
- 9.9.5. SWOT analysis
- 9.10. Evonik
- 9.10.1. Business overview
- 9.10.2. Financial data
- 9.10.3. Product landscape
- 9.10.4. Strategic outlook
- 9.10.5. SWOT analysis
- 9.11. HP Inc.
- 9.11.1. Business overview
- 9.11.2. Financial data
- 9.11.3. Product landscape
- 9.11.4. Strategic outlook
- 9.11.5. SWOT analysis
- 9.12. Carbon
- 9.12.1. Business overview
- 9.12.2. Financial data
- 9.12.3. Product landscape
- 9.12.4. Strategic outlook
- 9.12.5. SWOT analysis
- 9.13. EnvisionTEC
- 9.13.1. Business overview
- 9.13.2. Financial data
- 9.13.3. Product landscape
- 9.13.4. Strategic outlook
- 9.13.5. SWOT analysis
- 9.14. Ultimaker
- 9.14.1. Business overview
- 9.14.2. Financial data
- 9.14.3. Product landscape
- 9.14.4. Strategic outlook
- 9.14.5. SWOT analysis
- 9.15. Solvay
- 9.15.1. Business overview
- 9.15.2. Financial data
- 9.15.3. Product landscape
- 9.15.4. Strategic outlook
- 9.15.5. SWOT analysis
The above list of companies is only partial and will be revised as research progresses. We will profile all key companies in the market and will add to this list.
Data Tables
- TABLE 1: 3D printing materials industry 360 degree synopsis, 2018 - 2032
- TABLE 2: 3D printing equipment industry 360 degree synopsis, 2018 - 2032
- TABLE 3: Global 3D printing materials estimates & forecast, (Tons) (USD Million), 2018 - 2032
- TABLE 4: Global 3D printing materials market volume estimates & forecast by product, (Tons), 2018 - 2032
- TABLE 5: Global 3D printing materials market revenue estimates & forecast by product, (USD Million), 2018 - 2032
- TABLE 6: Global 3D printing materials market volume estimates & forecast by end-user, (Tons), 2018 - 2032
- TABLE 7: Global 3D printing materials market revenue estimates & forecast by end-user, (USD Million), 2018 - 2032
- TABLE 8: Global 3D printing materials market volume estimates & forecast by region, (Tons), 2018 - 2032
- TABLE 9: Global 3D printing materials market revenue estimates & forecast by region, (USD Million), 2018 - 2032
- TABLE 10: Global 3D printing equipment estimates & forecast, (Units) (USD Million), 2018 - 2032
- TABLE 11: Global 3D printing equipment market volume estimates & forecast by product, (Units), 2018 - 2032
- TABLE 12: Global 3D printing equipment market revenue estimates & forecast by product, (USD Million), 2018 - 2032
- TABLE 13: Global 3D printing equipment market volume estimates & forecast by region, (Units), 2018 - 2032
- TABLE 14: Global 3D printing equipment market revenue estimates & forecast by region, (USD Million), 2018 - 2032
- TABLE 15: Industry impact forces
- TABLE 16: Strategy dashboard
- TABLE 17: Global 3D printing materials market estimates & forecast for ceramics (Tons) (USD Million), 2018 - 2032
- TABLE 18: Global 3D printing materials market volume estimates & forecast for ceramics by region, (Tons), 2018 - 2032
- TABLE 19: Global 3D printing materials market revenue estimates & forecast for ceramics by region, (USD Million), 2018 - 2032
- TABLE 20: Global 3D printing materials market estimates & forecast for plastics (Tons) (USD Million), 2018 - 2032
- TABLE 21: Global 3D printing materials market volume estimates & forecast for plastics by region, (Tons), 2018 - 2032
- TABLE 22: Global 3D printing materials market revenue estimates & forecast for plastics by region, (USD Million), 2018 - 2032
- TABLE 23: Global 3D printing materials market estimates & forecast for metal (Tons) (USD Million), 2018 - 2032
- TABLE 24: Global 3D printing materials market volume estimates & forecast for metal by region, (Tons), 2018 - 2032
- TABLE 25: Global 3D printing materials market revenue estimates & forecast for metal by region, (USD Million), 2018 - 2032
- TABLE 26: Global 3D printing materials market estimates & forecast for others (Tons) (USD Million), 2018 - 2032
- TABLE 27: Global 3D printing materials market volume estimates & forecast for others by region, (Tons), 2018 - 2032
- TABLE 28: Global 3D printing materials market revenue estimates & forecast for others by region, (USD Million), 2018 - 2032
- TABLE 29: Global 3D printing materials market estimates & forecast for electronics & consumer products (Tons) (USD Million), 2018 - 2032
- TABLE 30: Global 3D printing materials market volume estimates & forecast for electronics & consumer products by region, (Tons), 2018 - 2032
- TABLE 31: Global 3D printing materials market revenue estimates & forecast for electronics & consumer products by region, (USD Million), 2018 - 2032
- TABLE 32: Global 3D printing materials market estimates & forecast for automotive (Tons) (USD Million), 2018 - 2032
- TABLE 33: Global 3D printing materials market volume estimates & forecast for automotive by region, (Tons), 2018 - 2032
- TABLE 34: Global 3D printing materials market revenue estimates & forecast for automotive by region, (USD Million), 2018 - 2032
- TABLE 35: Global 3D printing materials market estimates & forecast for medical (Tons) (USD Million), 2018 - 2032
- TABLE 36: Global 3D printing materials market volume estimates & forecast for medical by region, (Tons), 2018 - 2032
- TABLE 37: Global 3D printing materials market revenue estimates & forecast for medical by region, (USD Million), 2018 - 2032
- TABLE 38: Global 3D printing materials market estimates & forecast for industrial (Tons) (USD Million), 2018 - 2032
- TABLE 39: Global 3D printing materials market volume estimates & forecast for industrial by region, (Tons), 2018 - 2032
- TABLE 40: Global 3D printing materials market revenue estimates & forecast for industrial by region, (USD Million), 2018 - 2032
- TABLE 41: Global 3D printing materials market estimates & forecast for education (Tons) (USD Million), 2018 - 2032
- TABLE 42: Global 3D printing materials market volume estimates & forecast for education by region, (Tons), 2018 - 2032
- TABLE 43: Global 3D printing materials market revenue estimates & forecast for education by region, (USD Million), 2018 - 2032
- TABLE 44: Global 3D printing materials market estimates & forecast for aerospace (Tons) (USD Million), 2018 - 2032
- TABLE 45: Global 3D printing materials market volume estimates & forecast for aerospace by region, (Tons), 2018 - 2032
- TABLE 46: Global 3D printing materials market revenue estimates & forecast for aerospace by region, (USD Million), 2018 - 2032
- TABLE 47: Global 3D printing materials market estimates & forecast for others (Tons) (USD Million), 2018 - 2032
- TABLE 48: Global 3D printing materials market volume estimates & forecast for others by region, (Tons), 2018 - 2032
- TABLE 49: Global 3D printing materials market revenue estimates & forecast for others by region, (USD Million), 2018 - 2032
- TABLE 50: Global 3D printing equipment market estimates & forecast for polyjet (Units) (USD Million), 2018 - 2032
- TABLE 51: Global 3D printing equipment market volume estimates & forecast for polyjet by region, (Units), 2018 - 2032
- TABLE 52: Global 3D printing equipment market revenue estimates & forecast for polyjet by region, (USD Million), 2018 - 2032
- TABLE 53: Global 3D printing equipment market estimates & forecast for Fuse Deposition Modeling (FDM) (Units) (USD Million), 2018 - 2032
- TABLE 54: Global 3D printing equipment market volume estimates & forecast for Fuse Deposition Modeling (FDM)by region, (Units), 2018 - 2032
- TABLE 55: Global 3D printing equipment market revenue estimates & forecast for Fuse Deposition Modeling (FDM) by region, (USD Million), 2018 - 2032
- TABLE 56: Global 3D printing equipment market estimates & forecast for Selective Laser Sintering (SLS) (Units) (USD Million), 2018 - 2032
- TABLE 57: Global 3D printing equipment market volume estimates & forecast for Selective Laser Sintering (SLS) by region, (Units), 2018 - 2032
- TABLE 58: Global 3D printing equipment market revenue estimates & forecast for Selective Laser Sintering (SLS) by region, (USD Million), 2018 - 2032
- TABLE 59: Global 3D printing equipment market estimates & forecast for Stereolithography (SLA) (Units) (USD Million), 2018 - 2032
- TABLE 60: Global 3D printing equipment market volume estimates & forecast for Stereolithography (SLA) by region, (Units), 2018 - 2032
- TABLE 61: Global 3D printing equipment market revenue estimates & forecast for Stereolithography (SLA) by region, (USD Million), 2018 - 2032
- TABLE 62: Global 3D printing equipment market estimates & forecast for ColorJet (Units) (USD Million), 2018 - 2032
- TABLE 63: Global 3D printing equipment market volume estimates & forecast for ColorJet by region, (Units), 2018 - 2032
- TABLE 64: Global 3D printing equipment market revenue estimates & forecast for ColorJet by region, (USD Million), 2018 - 2032
- TABLE 65: Global 3D printing equipment market estimates & forecast for others (Units) (USD Million), 2018 - 2032
- TABLE 66: Global 3D printing equipment market volume estimates & forecast for others by region, (Units), 2018 - 2032
- TABLE 67: Global 3D printing equipment market revenue estimates & forecast for others by region, (USD Million), 2018 - 2032
- TABLE 68: North America 3D printing materials estimates & forecast, (Tons) (USD Million), 2018 - 2032
- TABLE 69: North America 3D printing materials market volume estimates & forecast by product, (Tons), 2018 - 2032
- TABLE 70: North America 3D printing materials market revenue estimates & forecast by product, (USD Million), 2018 - 2032
- TABLE 71: North America 3D printing materials market volume estimates & forecast by end-user, (Tons), 2018 - 2032
- TABLE 72: North America 3D printing materials market revenue estimates & forecast by end-user, (USD Million), 2018 - 2032
- TABLE 73: North America 3D printing equipment estimates & forecast, (Units) (USD Million), 2018 - 2032
- TABLE 74: North America 3D printing equipment market volume estimates & forecast by product, (Units), 2018 - 2032
- TABLE 75: North America 3D printing equipment market revenue estimates & forecast by product, (USD Million), 2018 - 2032
- TABLE 76: U.S. 3D printing materials estimates & forecast, (Tons) (USD Million), 2018 - 2032
- TABLE 77: U.S. 3D printing materials market volume estimates & forecast by product, (Tons), 2018 - 2032
- TABLE 78: U.S. 3D printing materials market revenue estimates & forecast by product, (USD Million), 2018 - 2032
- TABLE 79: U.S. 3D printing materials market volume estimates & forecast by end-user, (Tons), 2018 - 2032
- TABLE 80: U.S. 3D printing materials market revenue estimates & forecast by end-user, (USD Million), 2018 - 2032
- TABLE 81: U.S. 3D printing equipment estimates & forecast, (Units) (USD Million), 2018 - 2032
- TABLE 82: U.S. 3D printing equipment market volume estimates & forecast by product, (Units), 2018 - 2032
- TABLE 83: U.S. 3D printing equipment market revenue estimates & forecast by product, (USD Million), 2018 - 2032
- TABLE 84: Canada 3D printing materials estimates & forecast, (Tons) (USD Million), 2018 - 2032
- TABLE 85: Canada 3D printing materials market volume estimates & forecast by product, (Tons), 2018 - 2032
- TABLE 86: Canada 3D printing materials market revenue estimates & forecast by product, (USD Million), 2018 - 2032
- TABLE 87: Canada 3D printing materials market volume estimates & forecast by end-user, (Tons), 2018 - 2032
- TABLE 88: Canada 3D printing materials market revenue estimates & forecast by end-user, (USD Million), 2018 - 2032
- TABLE 89: Canada 3D printing equipment estimates & forecast, (Units) (USD Million), 2018 - 2032
- TABLE 90: Canada 3D printing equipment market volume estimates & forecast by product, (Units), 2018 - 2032
- TABLE 91: Canada 3D printing equipment market revenue estimates & forecast by product, (USD Million), 2018 - 2032
- TABLE 92: Europe 3D printing materials estimates & forecast, (Tons) (USD Million), 2018 - 2032
- TABLE 93: Europe 3D printing materials market volume estimates & forecast by product, (Tons), 2018 - 2032
- TABLE 94: Europe 3D printing materials market revenue estimates & forecast by product, (USD Million), 2018 - 2032
- TABLE 95: Europe 3D printing materials market volume estimates & forecast by end-user, (Tons), 2018 - 2032
- TABLE 96: Europe 3D printing materials market revenue estimates & forecast by end-user, (USD Million), 2018 - 2032
- TABLE 97: Europe 3D printing equipment estimates & forecast, (Units) (USD Million), 2018 - 2032
- TABLE 98: Europe 3D printing equipment market volume estimates & forecast by product, (Units), 2018 - 2032
- TABLE 99: Europe 3D printing equipment market revenue estimates & forecast by product, (USD Million), 2018 - 2032
- TABLE 100: Germany 3D printing materials estimates & forecast, (Tons) (USD Million), 2018 - 2032
- TABLE 101: Germany 3D printing materials market volume estimates & forecast by product, (Tons), 2018 - 2032
- TABLE 102: Germany 3D printing materials market revenue estimates & forecast by product, (USD Million), 2018 - 2032
- TABLE 103: Germany 3D printing materials market volume estimates & forecast by end-user, (Tons), 2018 - 2032
- TABLE 104: Germany 3D printing materials market revenue estimates & forecast by end-user, (USD Million), 2018 - 2032
- TABLE 105: Germany 3D printing equipment estimates & forecast, (Units) (USD Million), 2018 - 2032
- TABLE 106: Germany 3D printing equipment market volume estimates & forecast by product, (Units), 2018 - 2032
- TABLE 107: Germany 3D printing equipment market revenue estimates & forecast by product, (USD Million), 2018 - 2032
- TABLE 108: UK 3D printing materials estimates & forecast, (Tons) (USD Million), 2018 - 2032
- TABLE 109: UK 3D printing materials market volume estimates & forecast by product, (Tons), 2018 - 2032
- TABLE 110: UK 3D printing materials market revenue estimates & forecast by product, (USD Million), 2018 - 2032
- TABLE 111: UK 3D printing materials market volume estimates & forecast by end-user, (Tons), 2018 - 2032
- TABLE 112: UK 3D printing materials market revenue estimates & forecast by end-user, (USD Million), 2018 - 2032
- TABLE 113: UK 3D printing equipment estimates & forecast, (Units) (USD Million), 2018 - 2032
- TABLE 114: UK 3D printing equipment market volume estimates & forecast by product, (Units), 2018 - 2032
- TABLE 115: UK 3D printing equipment market revenue estimates & forecast by product, (USD Million), 2018 - 2032
- TABLE 116: France 3D printing materials estimates & forecast, (Tons) (USD Million), 2018 - 2032
- TABLE 117: France 3D printing materials market volume estimates & forecast by product, (Tons), 2018 - 2032
- TABLE 118: France 3D printing materials market revenue estimates & forecast by product, (USD Million), 2018 - 2032
- TABLE 119: France 3D printing materials market volume estimates & forecast by end-user, (Tons), 2018 - 2032
- TABLE 120: France 3D printing materials market revenue estimates & forecast by end-user, (USD Million), 2018 - 2032
- TABLE 121: France 3D printing equipment estimates & forecast, (Units) (USD Million), 2018 - 2032
- TABLE 122: France 3D printing equipment market volume estimates & forecast by product, (Units), 2018 - 2032
- TABLE 123: France 3D printing equipment market revenue estimates & forecast by product, (USD Million), 2018 - 2032
- TABLE 124: Spain 3D printing materials estimates & forecast, (Tons) (USD Million), 2018 - 2032
- TABLE 125: Spain 3D printing materials market volume estimates & forecast by product, (Tons), 2018 - 2032
- TABLE 126: Spain 3D printing materials market revenue estimates & forecast by product, (USD Million), 2018 - 2032
- TABLE 127: Spain 3D printing materials market volume estimates & forecast by end-user, (Tons), 2018 - 2032
- TABLE 128: Spain 3D printing materials market revenue estimates & forecast by end-user, (USD Million), 2018 - 2032
- TABLE 129: Spain 3D printing equipment estimates & forecast, (Units) (USD Million), 2018 - 2032
- TABLE 130: Spain 3D printing equipment market volume estimates & forecast by product, (Units), 2018 - 2032
- TABLE 131: Spain 3D printing equipment market revenue estimates & forecast by product, (USD Million), 2018 - 2032
- TABLE 132: Italy 3D printing materials estimates & forecast, (Tons) (USD Million), 2018 - 2032
- TABLE 133: Italy 3D printing materials market volume estimates & forecast by product, (Tons), 2018 - 2032
- TABLE 134: Italy 3D printing materials market revenue estimates & forecast by product, (USD Million), 2018 - 2032
- TABLE 135: Italy 3D printing materials market volume estimates & forecast by end-user, (Tons), 2018 - 2032
- TABLE 136: Italy 3D printing materials market revenue estimates & forecast by end-user, (USD Million), 2018 - 2032
- TABLE 137: Italy 3D printing equipment estimates & forecast, (Units) (USD Million), 2018 - 2032
- TABLE 138: Italy 3D printing equipment market volume estimates & forecast by product, (Units), 2018 - 2032
- TABLE 139: Italy 3D printing equipment market revenue estimates & forecast by product, (USD Million), 2018 - 2032
- TABLE 140: Asia Pacific 3D printing materials estimates & forecast, (Tons) (USD Million), 2018 - 2032
- TABLE 141: Asia Pacific 3D printing materials market volume estimates & forecast by product, (Tons), 2018 - 2032
- TABLE 142: Asia Pacific 3D printing materials market revenue estimates & forecast by product, (USD Million), 2018 - 2032
- TABLE 143: Asia Pacific 3D printing materials market volume estimates & forecast by end-user, (Tons), 2018 - 2032
- TABLE 144: Asia Pacific 3D printing materials market revenue estimates & forecast by end-user, (USD Million), 2018 - 2032
- TABLE 145: Asia Pacific 3D printing equipment estimates & forecast, (Units) (USD Million), 2018 - 2032
- TABLE 146: Asia Pacific 3D printing equipment market volume estimates & forecast by product, (Units), 2018 - 2032
- TABLE 147: Asia Pacific 3D printing equipment market revenue estimates & forecast by product, (USD Million), 2018 - 2032
- TABLE 148: China 3D printing materials estimates & forecast, (Tons) (USD Million), 2018 - 2032
- TABLE 149: China 3D printing materials market volume estimates & forecast by product, (Tons), 2018 - 2032
- TABLE 150: China 3D printing materials market revenue estimates & forecast by product, (USD Million), 2018 - 2032
- TABLE 151: China 3D printing materials market volume estimates & forecast by end-user, (Tons), 2018 - 2032
- TABLE 152: China 3D printing materials market revenue estimates & forecast by end-user, (USD Million), 2018 - 2032
- TABLE 153: China 3D printing equipment estimates & forecast, (Units) (USD Million), 2018 - 2032
- TABLE 154: China 3D printing equipment market volume estimates & forecast by product, (Units), 2018 - 2032
- TABLE 155: China 3D printing equipment market revenue estimates & forecast by product, (USD Million), 2018 - 2032
- TABLE 156: India 3D printing materials estimates & forecast, (Tons) (USD Million), 2018 - 2032
- TABLE 157: India 3D printing materials market volume estimates & forecast by product, (Tons), 2018 - 2032
- TABLE 158: India 3D printing materials market revenue estimates & forecast by product, (USD Million), 2018 - 2032
- TABLE 159: India 3D printing materials market volume estimates & forecast by end-user, (Tons), 2018 - 2032
- TABLE 160: India 3D printing materials market revenue estimates & forecast by end-user, (USD Million), 2018 - 2032
- TABLE 161: India 3D printing equipment estimates & forecast, (Units) (USD Million), 2018 - 2032
- TABLE 162: India 3D printing equipment market volume estimates & forecast by product, (Units), 2018 - 2032
- TABLE 163: India 3D printing equipment market revenue estimates & forecast by product, (USD Million), 2018 - 2032
- TABLE 164: Japan 3D printing materials estimates & forecast, (Tons) (USD Million), 2018 - 2032
- TABLE 165: Japan 3D printing materials market volume estimates & forecast by product, (Tons), 2018 - 2032
- TABLE 166: Japan 3D printing materials market revenue estimates & forecast by product, (USD Million), 2018 - 2032
- TABLE 167: Japan 3D printing materials market volume estimates & forecast by end-user, (Tons), 2018 - 2032
- TABLE 168: Japan 3D printing materials market revenue estimates & forecast by end-user, (USD Million), 2018 - 2032
- TABLE 169: Japan 3D printing equipment estimates & forecast, (Units) (USD Million), 2018 - 2032
- TABLE 170: Japan 3D printing equipment market volume estimates & forecast by product, (Units), 2018 - 2032
- TABLE 171: Japan 3D printing equipment market revenue estimates & forecast by product, (USD Million), 2018 - 2032
- TABLE 172: Australia 3D printing materials estimates & forecast, (Tons) (USD Million), 2018 - 2032
- TABLE 173: Australia 3D printing materials market volume estimates & forecast by product, (Tons), 2018 - 2032
- TABLE 174: Australia 3D printing materials market revenue estimates & forecast by product, (USD Million), 2018 - 2032
- TABLE 175: Australia 3D printing materials market volume estimates & forecast by end-user, (Tons), 2018 - 2032
- TABLE 176: Australia 3D printing materials market revenue estimates & forecast by end-user, (USD Million), 2018 - 2032
- TABLE 177: Australia 3D printing equipment estimates & forecast, (Units) (USD Million), 2018 - 2032
- TABLE 178: Australia 3D printing equipment market volume estimates & forecast by product, (Units), 2018 - 2032
- TABLE 179: Australia 3D printing equipment market revenue estimates & forecast by product, (USD Million), 2018 - 2032
- TABLE 180: Indonesia 3D printing materials estimates & forecast, (Tons) (USD Million), 2018 - 2032
- TABLE 181: Indonesia 3D printing materials market volume estimates & forecast by product, (Tons), 2018 - 2032
- TABLE 182: Indonesia 3D printing materials market revenue estimates & forecast by product, (USD Million), 2018 - 2032
- TABLE 183: Indonesia 3D printing materials market volume estimates & forecast by end-user, (Tons), 2018 - 2032
- TABLE 184: Indonesia 3D printing materials market revenue estimates & forecast by end-user, (USD Million), 2018 - 2032
- TABLE 185: Indonesia 3D printing equipment estimates & forecast, (Units) (USD Million), 2018 - 2032
- TABLE 186: Indonesia 3D printing equipment market volume estimates & forecast by product, (Units), 2018 - 2032
- TABLE 187: Indonesia 3D printing equipment market revenue estimates & forecast by product, (USD Million), 2018 - 2032
- TABLE 188: Malaysia 3D printing materials estimates & forecast, (Tons) (USD Million), 2018 - 2032
- TABLE 189: Malaysia 3D printing materials market volume estimates & forecast by product, (Tons), 2018 - 2032
- TABLE 190: Malaysia 3D printing materials market revenue estimates & forecast by product, (USD Million), 2018 - 2032
- TABLE 191: Malaysia 3D printing materials market volume estimates & forecast by end-user, (Tons), 2018 - 2032
- TABLE 192: Malaysia 3D printing materials market revenue estimates & forecast by end-user, (USD Million), 2018 - 2032
- TABLE 193: Malaysia 3D printing equipment estimates & forecast, (Units) (USD Million), 2018 - 2032
- TABLE 194: Malaysia 3D printing equipment market volume estimates & forecast by product, (Units), 2018 - 2032
- TABLE 195: Malaysia 3D printing equipment market revenue estimates & forecast by product, (USD Million), 2018 - 2032
- TABLE 196: Brazil 3D printing materials estimates & forecast, (Tons) (USD Million), 2018 - 2032
- TABLE 197: Brazil 3D printing materials market volume estimates & forecast by product, (Tons), 2018 - 2032
- TABLE 198: Brazil 3D printing materials market revenue estimates & forecast by product, (USD Million), 2018 - 2032
- TABLE 199: Brazil 3D printing materials market volume estimates & forecast by end-user, (Tons), 2018 - 2032
- TABLE 200: Brazil 3D printing materials market revenue estimates & forecast by end-user, (USD Million), 2018 - 2032
- TABLE 201: Brazil 3D printing equipment estimates & forecast, (Units) (USD Million), 2018 - 2032
- TABLE 202: Brazil 3D printing equipment market volume estimates & forecast by product, (Units), 2018 - 2032
- TABLE 203: Brazil 3D printing equipment market revenue estimates & forecast by product, (USD Million), 2018 - 2032
- TABLE 204: Mexico 3D printing materials estimates & forecast, (Tons) (USD Million), 2018 - 2032
- TABLE 205: Mexico 3D printing materials market volume estimates & forecast by product, (Tons), 2018 - 2032
- TABLE 206: Mexico 3D printing materials market revenue estimates & forecast by product, (USD Million), 2018 - 2032
- TABLE 207: Mexico 3D printing materials market volume estimates & forecast by end-user, (Tons), 2018 - 2032
- TABLE 208: Mexico 3D printing materials market revenue estimates & forecast by end-user, (USD Million), 2018 - 2032
- TABLE 209: Mexico 3D printing equipment estimates & forecast, (Units) (USD Million), 2018 - 2032
- TABLE 210: Mexico 3D printing equipment market volume estimates & forecast by product, (Units), 2018 - 2032
- TABLE 211: Mexico 3D printing equipment market revenue estimates & forecast by product, (USD Million), 2018 - 2032
- TABLE 212: South Africa 3D printing materials estimates & forecast, (Tons) (USD Million), 2018 - 2032
- TABLE 213: South Africa 3D printing materials market volume estimates & forecast by product, (Tons), 2018 - 2032
- TABLE 214: South Africa 3D printing materials market revenue estimates & forecast by product, (USD Million), 2018 - 2032
- TABLE 215: South Africa 3D printing materials market volume estimates & forecast by end-user, (Tons), 2018 - 2032
- TABLE 216: South Africa 3D printing materials market revenue estimates & forecast by end-user, (USD Million), 2018 - 2032
- TABLE 217: South Africa 3D printing equipment estimates & forecast, (Units) (USD Million), 2018 - 2032
- TABLE 218: South Africa 3D printing equipment market volume estimates & forecast by product, (Units), 2018 - 2032
- TABLE 219: South Africa 3D printing equipment market revenue estimates & forecast by product, (USD Million), 2018 - 2032
- TABLE 220: GCC 3D printing materials estimates & forecast, (Tons) (USD Million), 2018 - 2032
- TABLE 221: GCC 3D printing materials market volume estimates & forecast by product, (Tons), 2018 - 2032
- TABLE 222: GCC 3D printing materials market revenue estimates & forecast by product, (USD Million), 2018 - 2032
- TABLE 223: GCC 3D printing materials market volume estimates & forecast by end-user, (Tons), 2018 - 2032
- TABLE 224: GCC 3D printing materials market revenue estimates & forecast by end-user, (USD Million), 2018 - 2032
- TABLE 225: GCC 3D printing equipment estimates & forecast, (Units) (USD Million), 2018 - 2032
- TABLE 226: GCC 3D printing equipment market volume estimates & forecast by product, (Units), 2018 - 2032
- TABLE 227: GCC 3D printing equipment market revenue estimates & forecast by product, (USD Million), 2018 - 2032
Charts & Figures
- FIG. 1: Industry segmentation
- FIG. 2: 3D printing materials & equipment market 2018-2032
- FIG. 3: Industry ecosystem analysis
- FIG. 4: Growth potential analysis
- FIG. 5: Porter's analysis
- FIG. 6: Top players overview, 2022
- FIG. 7: PESTEL analysis
- FIG. 8: Regional price trends
- FIG. 9: SWOT analysis, Höganäs AB.
- FIG. 10: SWOT analysis, Concept Laser GmbH
- FIG. 11: SWOT Analysis, 3D Systems, Inc.
- FIG. 12: SWOT analysis, Stratasys Ltd.
- FIG. 13: SWOT analysis, Arkema S.A.
- FIG. 14: SWOT analysis, Arcam AB
- FIG. 15: SWOT analysis, Solidscape, Inc.
- FIG. 16: SWOT analysis, EOS GmbH (Electro Optical Systems)
- FIG. 17: SWOT analysis, ExOne
- FIG. 18: SWOT analysis, voxeljet AG
- FIG. 19: SWOT analysis, Royal DSM N.V.
- FIG. 20: SWOT analysis, EnvisionTEC GmbH
- FIG 21: SWOT analysis, LPW Technology, Ltd.
- FIG 22: SWOT analysis, SLM Solutions
- FIG 23: SWOT analysis, Optomec
 3D 列印材料市場:按形狀、技術、類型、應用和最終用戶 - 2024-2030 年全球預測
 3D 列印材料市場報告,按類型(聚合物、金屬、陶瓷等)、形式(粉末、長絲、液體)、最終用戶(消費品、航太和國防、汽車、醫療保健、教育和研究等)和地區2024-2032
 PLA長絲3D列印材料市場-2024年至2029年預測
 3D 列印材料 - 市場佔有率分析、產業趨勢與統計、成長預測(2024 年 - 2029 年)
 全球 3D 列印塑膠市場:按類型、形狀、應用、最終用途產業、地區 - 預測(至 2028 年)
 3D 列印氣體市場、份額、規模、趨勢、產業分析報告:按類型、技術、應用、分佈、地區、細分市場預測,2024-2032 年
 3D 列印塑膠市場:按形狀、產品類型、技術、產業分類 - 2024-2030 年全球預測
 3D 列印陶瓷市場:按類型、形狀和最終用戶分類 - 全球預測 2024-2030
 全球3D列印材料市場-產業趨勢與預測(~2031年)
 3D 列印粉末市場(產品:塑膠、金屬、陶瓷等;應用:汽車、航太、醫療等)- 2023-2031 年全球產業分析、規模、佔有率、數量、成長、趨勢和預測