


 |
市場調查報告書
商品編碼
2107346
遠距放射學醫療服務市場:依影像方式、最終用戶、經營模式和地區分類-趨勢與預測至2035年Teleradiology Services Market by Imaging Modality, End User, Business Model, and Geographical Regions - Trends and Forecast Till 2035 |
||||||

遠距放射醫療服務市場概覽
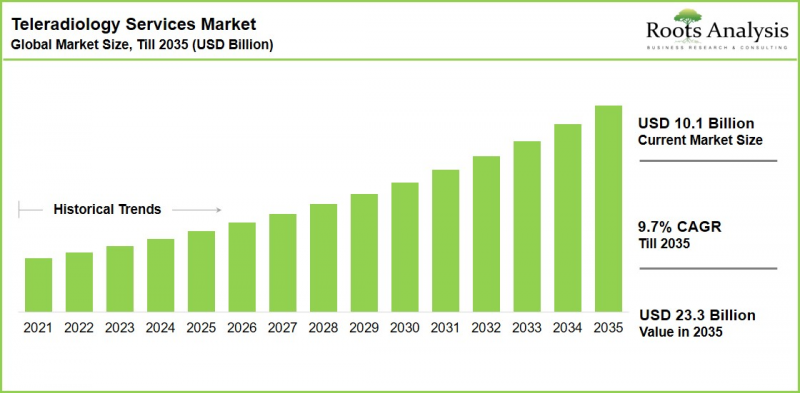
全球遠距放射學服務市場規模預計將從今年的 101 億美元成長到 2035 年的 233 億美元,在預測期內(到 2035 年)的複合年成長率為 9.7%。
遠距放射醫療服務市場:成長與趨勢
在醫療系統面臨越來越大的壓力,需要提供更快、更準確的診斷服務之際,醫學影像技術正在全球大規模部署。在這些技術中,遠距放射學服務已成為實現遠距離診斷的關鍵工具。遠距放射診斷能夠安全地傳輸醫學影像,使合格的放射科醫生能夠跨越地域限制進行解讀。
這些服務支援多種影像檢查方式,包括電腦斷層掃描 (CT)、磁振造影(MRI)、超音波、乳房X光檢查和X光檢查,廣泛應用於從常規臨床實踐到急診醫學的各個領域。影像檢查數量的不斷增加,以及慢性病盛行率的上升,推動了對高效放射學報告服務的需求。這促使醫療機構採用擴充性的解決方案,以應對日益成長的影像檢查工作量,同時確保患者照護不受影響。
由於勞動力短缺日益嚴重和數據量不斷成長,這種需求變得愈發迫切。預計醫生短缺和放射科醫生因工作量過大而日益疲憊,正在加速對更有效率診斷工作流程的需求。這些壓力加劇了人們對醫療系統長期能否滿足不斷成長的診斷影像需求的擔憂。為了應對這些挑戰,市場相關人員擴大採用先進的遠端遠距放射診斷解決方案,以提高報告效率並實現連續的診斷操作。此外,基於雲端的診斷成像基礎設施、人工智慧驅動的診斷成像以及整合工作流程平台的進步,進一步提升了這些服務的便利性和效率。這些努力,加上整個醫療保健行業日益成長的需求,正將遠距放射診斷從輔助服務轉變為現代診斷服務的核心要素。
成長要素:推動全球遠距放射學醫療服務市場擴張的因素
推動這一市場發展的關鍵因素之一是全球合格放射科醫生的持續短缺。隨著CT、MRI、乳房X光攝影光檢查和X光檢查等影像檢查數量的增加,醫院和診斷中心越來越依賴遠距放射診斷供應商,以確保及時發布報告、減少積壓病例並提供快速診斷。
此外,醫療機構需要在保證影像判讀準確性的前提下,加快診斷速度。因此,醫院和影像診斷中心擴大將影像診斷外包,以確保全天候影像判讀系統正常運行,並利用神經放射學、肌肉骨骼放射學、兒童放射學和腫瘤成像等各個專業領域的專家資源。這種外包趨勢進一步拓展了遠距放射診斷在急診醫學和常規臨床實踐中的作用。
市場挑戰:阻礙進展的主要障礙
儘管市場需求不斷成長,但仍存在諸多阻礙因素。遠距放射診斷營運商需要管理跨多個醫療網路和司法管轄區的大量高度敏感的患者影像數據,並且必須遵守嚴格的數據隱私法規、網路安全要求和醫療資訊標準。如何在履行這些義務的同時,確保影像傳輸和報告的無縫銜接,仍然是參與企業面臨的一項持續營運挑戰。
此外,醫療服務提供者仍面臨複雜的醫師執照要求和不一致的報銷機制。在某些地區,放射科醫生需要獲得多個執照才能在不同的州或國家進行影像檢查,這增加了行政負擔和營運成本。遠距放射學服務的報銷政策差異進一步加劇了這種不確定性,減緩了某些市場對遠距放射學服務的接受速度。
遠距放射醫療服務市場:關鍵洞察
本報告詳細分析了遠距放射醫療服務市場的現狀,並指出了該行業的潛在成長機會。主要發現包括:
- 活躍的併購與合作:近期產業趨勢著重於整合與平台擴張。值得關注的例子包括Evidia收購Teleconsult和Meditecs,從而擴大其在歐洲的遠距離診斷業務;以及Sirona Medical與Everlight Radiology合作,向數百家合作醫院部署基於雲端的放射科營運平台。
- 人工智慧作為競爭優勢:人工智慧 (AI) 擴大被整合到報告工作流程中,以幫助確定病例的優先順序、檢測異常情況和縮短回應時間,這使得人工智慧能力成為醫院和診斷網路選擇供應商的新標準。
- 拓展至門診和專科領域:醫療服務提供者正將業務拓展至醫院合約之外,涵蓋門診和整形外科影像網路。 Premier Radiology Services 收購 Global Imaging Solutions 便反映了這一趨勢,此次收購為其門診中心增加了專科影像解讀服務。
- 醫療機構的積極採用:政府主導的舉措,例如支持公共醫療網路內遠距影像判讀的全國性遠距放射學計劃,不斷增強醫療機構對遠距報告模式的信心。
- 未來需要考慮的關鍵因素:遠距放射治療服務的相互認可和許可統一化在區域間仍存在差異。監管協調的步伐預計將成為影響跨境服務擴充性的關鍵因素,投資者應密切關注這一點。
遠距放射醫療服務市場細分
市場規模和機會分析是根據以下參數進行細分的:
透過診斷影像方式
- 電腦斷層掃描
- MRI
- 超音波
- X光
- 其他
最終用戶
- 醫院
- 診斷和影像中心
- 門診手術中心
- 其他
按經營模式
- B2B
- B2C
按地區
- 北美洲
- 歐洲
- 亞太地區
- 中東和北非
- 拉丁美洲
遠距放射醫療服務市場:關鍵市場細分洞察
電腦斷層掃描產業是市場的主要驅動力。
我們的市場評估表明, 電腦斷層掃描領域預計將佔據遠距放射學醫療服務市場的最大佔有率。這一主導地位源自於CT影像在急診醫學、腫瘤學和創傷病例中的廣泛應用。在這些領域,大型醫院和診斷連鎖機構每天進行的大量掃描,對遠端影像解讀服務產生了強勁而穩定的需求。此外,部分地區放射科醫師的短缺也是醫療機構將CT影像解讀外包的原因之一。另外,由於中風和創傷病例的救治往往需要爭分奪秒,遠距放射診斷是實現快速反應的最佳途徑。
同時,預計在預測期內,磁振造影(MRI)產業將實現最高的複合年成長率。這一成長歸因於神經系統疾病、肌肉骨骼疾病和癌症發病率的上升,這些疾病正在推動全球MRI檢查需求的激增。隨著MRI技術在中型醫院和影像中心變得更加經濟實惠且易於獲取,對遠端影像解讀服務的需求預計也將隨之成長。
醫院在市場中佔據主導地位。
根據我們獨家發布的市場報告,醫院在遠距放射醫療服務市場中佔據最大佔有率。大規模綜合性三級醫療機構每天在包括急診、腫瘤科、整形外科和神經科在內的各個科室產生大量的醫學影像。管理如此龐大的診斷數據需要醫院內部持續的放射科現場支援。此外,在郊區和農村醫療機構,由於放射科醫師長期短缺,遠距放射診斷服務對這些終端使用者群體而言至關重要。
未來幾年,診斷和影像中心預計將在預測期內實現最高的複合年成長率。這一成長主要得益於亞太地區以及中東和非洲新興經濟體中獨立診斷和影像中心的快速擴張。在這些機構中,遠距放射診斷正逐漸成為一種經濟高效且擴充性的替代方案,因為營運團隊無力聘請全職的放射科專科醫生。
B2B模式正在推動市場發展。
就經營模式而言,B2B模式預計將佔據最大的市場佔有率。這是因為醫院、連鎖診斷機構和放射科集團等醫療機構是遠距放射醫療服務的主要買家。這些機構與遠距放射診斷公司簽訂長期服務契約,以確保穩定的診斷影像病例量,這使得B2B模式對雙方都具有經濟吸引力和營運穩定性。
未來幾年,B2C模式預計將在預測期內實現最高的複合年成長率。隨著患者對放射診斷第二意見、遠距醫療和快速報告交付的需求不斷成長,以及數位健康平台和遠端醫療應用的擴展,遠距放射學服務提供者正能夠直接與個人消費者聯繫,這使得B2C模式成為一個快速成長的新興領域。
北美市佔率最大。
根據Roots Analysis的區域市場報告,北美將在預測期內佔據全球市場收入的最大佔有率。該地區擁有高度發達的醫療保健基礎設施、廣泛應用的先進影像技術以及已運行超過20年的成熟遠距放射學生態系統。美國仍然是最大的貢獻者,這得益於對非工作時間放射診斷的強勁需求、放射科醫生長期短缺以及財務狀況良好的私人醫療保健系統持續投資於遠距離診斷解決方案。國家遠距放射學計畫等措施進一步促進了醫療機構對遠距放射學的採用,該計畫將遠距影像解讀服務擴展到退伍軍人和公共醫療保健網路。
亞太地區蘊藏著廣闊的長期發展機會。
預計亞太地區在預測期內將以最高的複合年成長率成長。這一成長趨勢主要受以下因素驅動:醫療基礎設施的擴張、慢性病負擔的加重、影像檢查率的上升,以及印度、中國、印尼和越南等國合格放射科醫師的嚴重短缺。這一成長主要歸功於亞太、中東和非洲等新興經濟體診斷和影像中心的快速擴張。由於許多此類機構無法聘請全職放射科醫生,遠距放射診斷提供了一種經濟高效且擴充性的解決方案。
遠距放射醫療服務市場的主要公司範例
- 4ways
- Envision Physician Services
- Everlight Radiology
- Krsnaa Diagnostics
- Medica
- ONRAD
- 美國陸軍航空兵控股公司
- vRad
專家訪談和行業洞察
本研究提出的觀點和見解是基於與多位相關人員的討論。本報告包含與以下行業相關人員的詳細訪談記錄:
- 一家美國中型公司的總裁兼執行長
- 印度小規模企業的共同創辦人
此外,本市場報告還包括與以下其他第三方進行的討論記錄:
- 美國一家中型公司的醫療總監
- 美國小規模企業首席醫療保健官
- 英國一家中型公司的執行長
- 英國某中型公司執行長
- 印度一家領先公司的執行長首席放射科醫師
- 印度一家中型公司的創辦人兼首席放射科顧問。
- 美國一家小型企業的總裁兼董事長
- 美國一家中型公司的資訊長長兼軟體工程主管。
- 阿拉伯聯合大公國一家中型公司的執行長
- 美國一家中型公司的共同創辦人
遠距醫療服務市場:研究範圍
- 市場規模和機會分析:本報告對遠距放射學醫療服務市場進行了詳細分析,重點關注成像方式、最終用戶、經營模式和地區等關鍵市場細分。
- 遠端放射學服務市場趨勢:本報告對遠端放射學服務市場進行了詳細評估,涵蓋了成像方式、終端用戶、經營模式以及服務供應商的地理分佈等多個相關參數。此外,報告還基於成立年份、公司規模(以員工人數為依據)和總部所在地等參數,對遠距放射學公司進行了分析。
- 公司簡介:提供遠距放射學服務領域領導企業的詳細介紹。資訊包括成立年份、總部所在地、公司規模(基於員工人數)、經營團隊、服務組合和主要措施。
- 近期趨勢與措施:本節根據多個相關參數,對產業內的各種近期趨勢進行了詳細分析,包括併購、夥伴關係與聯盟以及其他策略性措施。
- 藍海策略分析:本章對藍海策略架構進行定性評估,重點在於其核心概念、關鍵策略工具以及在遠距放射學市場的實際應用。本章分析了紅海和藍海戰略概述,比較了兩種戰略方法,並探討了價值創新、戰略畫布、四個行動框架、ERRC矩陣、六條路徑框架、PMS圖、三層非客戶群、買方效用圖、大眾價格區間、戰略執行障礙、臨界點領導力,以及識別永續差異化和長期競爭優勢機會的公平流程。
- 成本降低分析:本分析比較並評估了遠距放射學服務在三種情境(基準情境、保守情境和樂觀情境)下的成本降低潛力。它揭示了關鍵假設、影像量、人事費用、技術採用率、報銷趨勢和區域市場動態對預期成本降低的影響。
- 市場影響分析:本報告分析了影響市場成長的各種因素,包括阻礙因素、機會和挑戰。
本報告解答的主要問題
- 遠距放射醫療服務市場的主要參與者有哪些?
- 哪個地區正在引領遠距放射醫療服務市場?
- 遠距放射醫療服務市場的主要發展趨勢是什麼?
- 哪些因素可能會影響該市場的未來發展?
- 遠距放射學醫療服務供應商面臨的主要挑戰是什麼?
- 目前和未來的市場規模是多少?
- 遠距放射學醫療服務市場的複合年成長率是多少?
- 當前和未來的市場機會預計將如何在主要市場區隔中分佈?
購買本報告的理由
- 實務工作者檢驗的見解:調查結果並非僅基於桌上研究,而是透過與執業放射科醫生、首席醫療官 (CMO) 和遠距放射學公司高管的直接訪談進行檢驗,從而提高了特定細分市場佔有率和成長預測的可靠性。
- 詳細且便於投資者理解的細分:市場估算按成像方式、最終用戶、經營模式和地區細分到國家級別,使相關人員能夠了解特定目標機會的規模,而不是依賴單一的匯總值。
- 前瞻性的技術觀點:與靜態的市場規模研究不同,本報告清楚地評估了人工智慧驅動的報告工作流程對競爭定位的影響,為策略和企業發展團隊提供了有關差異化重點正在轉移到哪裡的見解。
- 持續追蹤交易趨勢:本報告捕捉即時產業重組趨勢,包括近期收購和平台合作,可作為併購篩檢和合作基準的及時參考,而不僅僅是某一時刻的簡介。
- 分析師專屬說明和售後支援:購買我們報告的客戶將獲得調查團隊的詳細說明、免費的 Excel 資料包以及免費的客製化服務。這使您可以利用研究成果來解決具體的業務挑戰,而不是只接收一份固定的交付物。
目錄
第1章:序言
第2章執行摘要
第3章:引言
第4章 市場狀況
第5章:企業競爭力
第6章:公司簡介
- 章節概要
- 4ways Healthcare
- Envision Physician Services
- Everlight Radiology
- Krsnaa Diagnostics
- Medica
- ONRAD
- USARAD Holdings
- vRad
第7章:近期趨勢與舉措
第8章:藍海策略:新創企業進入競爭激烈市場的策略指南
第9章:成本降低分析
第10章 市場預測
第11章 結論
第12章:高階主管洞見
第13章附錄一:表格形式數據
第14章附錄二:公司與組織列表
TELERADIOLOGY SERVICES MARKET: OVERVIEW
As per Roots Analysis, the global teleradiology services market is estimated to grow from USD 10.1 billion in the current year to USD 23.3 billion by 2035, at an impressive CAGR of 9.7%, during the forecast period, till 2035.
Teleradiology Services Market: Growth and Trends
Driven by the growing pressure on healthcare systems to deliver faster and more accurate diagnostic services, medical imaging technologies have been adopted on a large scale worldwide. Within medical imaging technologies, teleradiology services have emerged as a key technology that enables remote diagnostics. Teleradiology allows medical images to be transmitted securely and interpreted by qualified radiologists across geographic boundaries.
These services support a broad range of imaging modalities, including computed tomography, magnetic resonance imaging, ultrasound, mammography, and X-ray examinations, across both routine and emergency care settings. The rising volume of diagnostic imaging procedures, coupled with the increasing prevalence of chronic diseases, has driven demand for efficient radiology reporting services. It encourages healthcare providers to adopt scalable solutions capable of managing growing imaging workloads without compromising patient care.
This need has become more critical due to growing workforce shortages and increasing data volumes. A projected shortage of physicians and rising burnout among radiologists, driven by heavy workloads, are accelerating the demand for more efficient diagnostic workflows. These pressures have raised concerns regarding the long-term capacity of healthcare systems to keep pace with rising diagnostic imaging demand. To address these challenges, market players are increasingly deploying advanced teleradiology solutions that improve reporting efficiency and enable continuous diagnostic coverage. Further, advancements in cloud-based imaging infrastructure, AI-assisted image interpretation, and integrated workflow platforms are further enhancing the accessibility and efficiency of these services. These initiatives along with growing demand across healthcare sector are reinforcing teleradiology's transition from a supplemental offering to a core component of modern diagnostic delivery.
Growth Drivers: Factors Fueling Expansion of the Global Teleradiology Services Market
One of the significant drivers of this market is the persistent global shortage of qualified radiologists. As imaging volumes rise across CT, MRI, mammography, and X-ray modalities, hospitals and diagnostic centers are increasingly relying on teleradiology providers for timely reporting, reducing case backlogs, and ensure timely diagnosis.
In addition, healthcare providers face pressure to deliver faster diagnostic decisions while preserving reporting accuracy. Consequently, hospitals and imaging centers are increasingly outsourcing image interpretation to secure round-the-clock reporting coverage and gain access to subspecialty expertise across neuroradiology, musculoskeletal radiology, paediatric radiology, and oncology imaging. This outsourcing trend continues to widen the role of teleradiology across both emergency and routine care settings.
Market Challenges: Critical Barriers Hindering Progress
Despite growing demand, the market faces several restraining factors. Teleradiology providers manage substantial volumes of sensitive patient imaging data across multiple healthcare networks and jurisdictions, requiring compliance with stringent data privacy regulations, cybersecurity requirements, and healthcare information standards. Managing these obligations while maintaining seamless image transmission and reporting remains an ongoing operational challenge for market participants.
In addition, providers continue to contend with complex physician licensing requirements and inconsistent reimbursement frameworks. In several regions, radiologists must secure multiple licenses to interpret scans across different states or countries, adding administrative burden and operational cost. Variability in reimbursement policy for remote radiology services further compounds this uncertainty, tempering the pace of adoption in certain markets.
Teleradiology Services Market: Key Insights
The report delves into the current state of the teleradiology services market and identifies potential growth opportunities within the industry. Some key findings include:
- Active M&A and Partnership Activity: Recent industry activity has centred on consolidation and platform expansion, exemplified by Evidia's acquisition of Teleconsult and Meditecs to broaden its pan-European tele-diagnostics footprint, and Sirona Medical's collaboration with Everlight Radiology to deploy its cloud-based radiology operating platform across hundreds of partner hospitals.
- AI as a Competitive Differentiator: Artificial intelligence is increasingly embedded within reporting workflows to support case prioritization, anomaly detection, and turnaround-time reduction, positioning AI capability as an emerging benchmark for provider selection among hospitals and diagnostic networks.
- Outpatient and Subspecialty Expansion: Providers are extending reach beyond hospital contracts into outpatient and orthopedic-linked imaging networks, as reflected in Premier Radiology Services' acquisition of Global Imaging Solutions, which added subspecialty reads for outpatient centers.
- Favorable Institutional Adoption: Government-backed initiatives, including national teleradiology programs supporting remote interpretation for public healthcare networks, continue to reinforce institutional confidence in remote reporting models.
- Key Factors for Future Consideration: Licensing portability and reimbursement parity for remote radiology services remain inconsistent across geographies. The pace of regulatory harmonization is expected to be an important determinant of cross-border service scalability and is worth close monitoring by investors.
Teleradiology Services Market Segments
The market sizing and opportunity analysis has been segmented across the following parameters:
By Imaging Modality
- CT scan
- MRI
- Ultrasound
- X-Ray
- Others
By End User
- Hospitals
- Diagnostic / Imaging Centers
- Ambulatory Surgical Centers
- Others
By Business Model
- B2B
- B2C
By Geographical Regions
- North America
- Europe
- Asia-Pacific
- Middle East and North Africa
- Latin America
Teleradiology Services Market: Key Segmentation Insights
CT-Scan Segment Leads the Market
Based on our market assessment, the CT scan segment is expected to account for the largest share of the teleradiology services market. This dominance is due to the widespread use of CT imaging across emergency care, oncology, and trauma cases, where high daily scan volumes at large hospitals and diagnostic chains generate strong, consistent demand for remote reading services. Radiologist shortages in several regions further encourage facilities to outsource CT interpretation. In addition, the time-sensitive nature of stroke and trauma cases makes teleradiology a natural fit for faster turnaround times.
On the other hand, the MRI segment is projected to witness the highest CAGR during the forecast period. This growth is attributed to the rising prevalence of neurological disorders, musculoskeletal conditions, and cancer, which is driving a sudden increase in MRI scan volumes globally. As MRI technology becomes more affordable and accessible across mid-sized hospitals and imaging centers, demand for remote interpretation services is expected to rise correspondingly.
Hospitals Dominate the Market
According to our proprietary market report, hospitals hold the highest share of the teleradiology services market. Large multi-specialty and tertiary care facilities generate the highest volume of medical imaging on a daily basis across departments such as emergency, oncology, orthopedics, and neurology. In order to manage large volume of diagnostic data, there is need for continuous radiology coverage in hospitals. Further, the persistent on-site radiologist shortages in semi-urban and rural facilities makes teleradiology an operationally essential service for this end-user group.
In the coming years, diagnostic and imaging centers are expected to register the highest CAGR during the forecast period. This growth is driven by the rapid proliferation of standalone diagnostic and imaging centers across emerging economies in Asia-Pacific, and Middle East, and Africa, operating teams cannot justify full-time specialist radiologists, making teleradiology a cost-effective and scalable alternative.
B2B Model Leads the Market
On the basis of business model, the B2B model is expected to hold the highest market share. This can be attributed to the fact that healthcare institutions, including hospitals, diagnostic chains, and radiology groups are the primary buyers of teleradiology services. These institutions enter into long-term service contracts with teleradiology companies to ensure a steady, high-volume flow of imaging cases, making the B2B model financially attractive and operationally stable for both parties.
In the coming years, the B2C model is expected to register the highest CAGR during the forecast period. Growing patient demand for direct access to radiology second opinions, remote consultations, and faster report delivery, alongside the expansion of digital health platforms and telemedicine applications, is enabling teleradiology providers to reach individual consumers directly, positioning B2C as a fast-emerging growth avenue
North America Holds the Highest Share
According to Roots Analysis regional market report, North America holds the largest share of global market revenue through the forecast period. The region combines highly developed healthcare infrastructure, widespread adoption of advanced imaging technologies, and a teleradiology ecosystem that has matured over two decades. The US remains the single largest contributor, supported by robust demand for after-hours radiology coverage, consistent radiologist shortage, and a well-funded private healthcare system that continues to invest in remote diagnostic solutions. Institutional adoption is further reinforced through initiatives such as national teleradiology programs that extend remote interpretation services to veteran and public healthcare networks.
Asia-Pacific Offers Long-Term Opportunity
Asia-Pacific is expected to grow at the highest CAGR during the forecast period. This trajectory is driven by expanding healthcare infrastructure, a rising chronic disease burden, increasing imaging volumes, and a significant shortage of qualified radiologists in countries such as India, China, Indonesia, and Vietnam. This growth is largely due to the rapid expansion of diagnostic and imaging centers across emerging economies in Asia-Pacific, the Middle East, and Africa. As many of these facilities cannot support full-time radiologists, teleradiology offers a cost-effective and scalable solution.
Example Players in Teleradiology Services Market
- 4ways
- Envision Physician Services
- Everlight Radiology
- Krsnaa Diagnostics
- Medica
- ONRAD
- USARAD Holdings
- vRad
Expert Interview and Industry Insights
The opinions and insights presented in this study were influenced by discussions conducted with multiple stakeholders. The research report features detailed transcripts of interviews held with the following industry stakeholders:
- President and Chief Executive Officer, Mid-sized Company, US
- Co-Founder, Small Company, India
In addition, the market report includes transcripts of the following other third-party discussions:
- Medical Director, Mid-sized Company, US
- Chief Medical Officer, Small Company, US
- Chief Executive Officer, Mid-sized Company, UK
- Chief Executive Officer, Mid-sized Company, UK
- Chief Executive Officer and Chief Radiologist, Large Company, India
- Founder and Chief Consultant Radiologist, Mid-sized, India
- President and Chairman, Small Company, US
- Chief Information Officer, and Director of Software Engineering, Mid-sized Company, US
- Chief Executive Officer, Mid-sized Company, UAE
- Co-Founder, Mid-sized Company, US
TELERADIOLOGY SERVICES MARKET: RESEARCH COVERAGE
- Market Sizing and Opportunity Analysis: The report features an in-depth analysis of the teleradiology services market, focusing on key market segments, including imaging modality, end user, business model, and geographical regions.
- Teleradiology Services Landscape: A detailed assessment of the overall teleradiology services market landscape, featuring information on several relevant parameters, such as imaging modality, end user, business model, and geographical presence of service providers. Additionally, it features an analysis of teleradiology companies, based on parameters such as year of establishment, company size (based on employee count), and location of headquarters.
- Company Profiles: In-depth profiles of prominent players engaged in offering teleradiology services, featuring information on their year of establishment, location of headquarters, company size (in terms of number of employees), management team, service portfolio, and key initiatives.
- Recent Developments and Initiatives: A detailed analysis of the various recent developments in this industry, including mergers and acquisitions, partnerships and collaborations, and other strategic initiatives, based on several relevant parameters.
- Blue Ocean Strategy Analysis: A qualitative assessment of the blue ocean strategy framework, highlighting its core concepts, key strategic tools, and practical applications in the teleradiology market. The chapter includes an overview of red and blue oceans, a comparison of both strategic approaches, and an analysis of value innovation, strategy canvas, four actions framework, ERRC grid, six path framework, PMS map, three tiers of noncustomers, buyer utility map, price corridor of the mass, strategy execution hurdles, tipping point leadership, and fair process to identify opportunities for sustainable differentiation and long-term competitive advantage.
- Cost Saving Analysis: A comparative assessment of the cost saving potential of teleradiology services under base, conservative, and optimistic scenarios, highlighting the impact of key assumptions, imaging volumes, labor costs, technology adoption rates, reimbursement trends, and regional market dynamics on projected cost savings.
- Market Impact Analysis: The report analyzes various factors such as drivers, restraints, opportunities, and challenges affecting market growth.
Key Questions Answered in this Report
- Which are the leading companies in the teleradiology services market?
- Which region dominates the teleradiology services market?
- What are the key trends observed in the teleradiology services market?
- What factors are likely to influence the evolution of this market?
- What are the primary challenges faced by teleradiology services providers?
- What is the current and future market size?
- What is the CAGR of the teleradiology services market?
- How is the current and future market opportunity likely to be distributed across key market segments?
Reasons to Buy this Report
- Practitioner-Validated Insights: Findings are triangulated against primary interviews held with practicing radiologists, chief medical officers, and teleradiology company executives, rather than being based on desk research alone, lending greater confidence to segment-level share and growth estimates.
- Granular, Investor-Ready Segmentation: Market estimates are provided across imaging modality, end user, business model, and geographical regions, down to the country level, enabling stakeholders to size specific addressable pockets of opportunity rather than working from a single aggregate figure.
- Forward-Looking Technology Lens: Unlike static market-sizing studies, the report explicitly evaluates the influence of AI-enabled reporting workflows on competitive positioning, giving strategy and corporate development teams a view on where differentiation is shifting.
- Continuously Tracked Deal Activity: The report captures live consolidation trends, including recent acquisitions and platform partnerships, positioning the study as a current reference for M&A screening and partnership benchmarking rather than a point-in-time snapshot.
- Analyst Access and Post-Purchase Support: Buyers receive a dedicated report walkthrough with the research team, complimentary Excel data packs, and free customization, allowing the findings to be adapted to a specific business question rather than consumed as a fixed deliverable.
Additional Benefits
- Complementary Insights Packs
- 15% Free Content Customization
- Detailed Report Walkthrough Session with Research Team
- Free Updated report if the report is 6-12 months old or older
TABLE OF CONTENTS
1. PREFACE
- 1.1. Scope of the Report
- 1.2. Research Methodology
- 1.3. Key Questions Answered
- 1.4. Chapter Outlines
2. EXECUTIVE SUMMARY
3. INTRODUCTION
- 3.1. Chapter Overview
- 3.2. Overview of Teleradiology
- 3.2.1. Historical Evolution of Teleradiology
- 3.2.2. Need for Teleradiology Services
- 3.3. Types of Medical Images Processed
- 3.4. Types of Medical Image Storage and Transmission Systems
- 3.5. Current Regulatory Scenario
- 3.6. Benefits and Limitations of Teleradiology
- 3.7. Concluding Remarks
4. MARKET LANDSCAPE
- 4.1. Chapter Overview
- 4.2. Teleradiology Services: Overall Market Landscape
- 4.2.1. Analysis by Target Market
- 4.2.2. Analysis by Imaging Modality
- 4.2.3. Analysis by Target Market and Imaging Modality
- 4.2.4. Analysis by Type of Subspeciality Offered
- 4.2.5. Analysis by End User
- 4.2.6. Analysis by Imaging Modality and End User
- 4.2.7. Analysis by Type of Subspeciality Offered and End User
- 4.2.8. Analysis by Type of Software
- 4.2.9. Analysis by Additional Capabilities
- 4.2.10. Analysis by Imaging Modality and Additional Capabilities
- 4.3. Teleradiology: Service Providers Landscape
- 4.3.1. Analysis by Year of Establishment
- 4.3.2. Analysis by Company Size
- 4.3.3. Analysis by Type of Business Model
- 4.3.4. Analysis by Location of Headquarters
5. COMPANY COMPETITIVENESS
- 5.1. Chapter Overview
- 5.2. Key Assumptions and Parameters
- 5.3. Methodology
- 5.3.1. Company Competitiveness Analysis: Very Small Companies
- 5.3.2. Company Competitiveness Analysis: Small Companies
- 5.3.3. Company Competitiveness Analysis: Mid-Sized Companies
- 5.3.4. Company Competitiveness Analysis: Large Companies
6. COMPANY PROFILES
- 6.1. Chapter Overview
- 6.2. 4ways Healthcare
- 6.2.1. Company Overview
- 6.2.2. Recent Developments and Future Outlook
- 6.3. Envision Physician Services
- 6.3.1. Company Overview
- 6.3.2. Recent Developments and Future Outlook
- 6.4. Everlight Radiology
- 6.4.1. Company Overview
- 6.4.2. Recent Developments and Future Outlook
- 6.5. Krsnaa Diagnostics
- 6.5.1. Company Overview
- 6.5.2. Recent Developments and Future Outlook
- 6.6. Medica
- 6.6.1. Company Overview
- 6.6.2. Recent Developments and Future Outlook
- 6.7. ONRAD
- 6.7.1. Company Overview
- 6.7.2. Recent Developments and Future Outlook
- 6.8. USARAD Holdings
- 6.8.1. Company Overview
- 6.8.2. Recent Developments and Future Outlook
- 6.9. vRad
- 6.9.1. Company Overview
- 6.9.2. Recent Developments and Future Outlook
7. RECENT DEVELOPMENTS AND INITIATIVES
- 7.1. Chapter Overview
- 7.2. Teleradiology Services Market: Partnerships and Collaborations
- 7.2.1. Partnership Models
- 7.2.2. List of Partnerships and Collaborations
- 7.2.3. Analysis by Number of Partnership Instances
- 7.2.4. Analysis by Type of Partnership
- 7.2.5. Analysis by Year and Type of Partnership
- 7.2.6. Analysis by Type of Partnership and Company Size
- 7.2.7. Most Active Players: Analysis by Number of Partnerships
- 7.2.8. Analysis by Region
- 7.2.9. Intercontinental and Intracontinental Agreements
- 7.3. Teleradiology Services Market: Funding and Investment
- 7.3.1. Type of Funding
- 7.3.2. List of Funding and Investments
- 7.3.3. Analysis by Number of Funding Instances
- 7.3.4. Analysis by Amount Invested
- 7.3.5. Analysis by Type of Funding
- 7.3.6. Analysis by Region
- 7.3.7. Most Active Players: Analysis by Number of Funding Instances
- 7.3.8. Most Active Players: Analysis by Amount Raised
- 7.4. Teleradiology Services Market: Recent Initiatives
- 7.4.1. Analysis by Number of Initiatives
- 7.4.2. Analysis by Type of Initiative
- 7.4.3. Analysis by Region
- 7.5. Teleradiology Services Market: COVID-19 Specific Initiatives
8. BLUE OCEAN STRATEGY: A STRATEGIC GUIDE FOR START-UPS TO ENTER INTO HIGHLY COMPETITIVE MARKET
- 8.1. Chapter Overview
- 8.2. Overview of Blue Ocean Strategy
- 8.2.1. Red Oceans
- 8.2.2. Blue Oceans30
- 8.2.3. Comparison of Red Ocean Strategy and Blue Ocean Strategy
- 8.2.4. Blue Ocean Strategy and Shift in Tools Used in Teleradiology
- 8.2.4.1. Value Innovation
- 8.2.4.2. Strategy Canvas
- 8.2.4.3. Four Action Framework
- 8.2.4.4. Eliminate-Raise-Reduce-Create (ERRC) Grid
- 8.2.4.5. Six Path Framework
- 8.2.4.6. Pioneer-Migrator-Settler (PMS) Map
- 8.2.4.7. Three Tiers of Noncustomers
- 8.2.4.8. Sequence of Blue Ocean Strategy
- 8.2.4.9. Buyer Utility Map
- 8.2.4.10. The Price Corridor of the Mass
- 8.2.4.11. Four Hurdles to Strategy Execution
- 8.2.4.12. Tipping Point Leadership
- 8.2.4.13. Fair Process
- 8.3. Conclusion
9. COST SAVING ANALYSIS
- 9.1. Chapter Overview
- 9.2. Key Assumptions and Methodology
- 9.3. Key Parameters Influencing the Cost of Teleradiology Services
- 9.4. Overall Cost Saving Potential of Teleradiology Services, Since 2021
- 9.5. Cost Saving Potential of Teleradiology Services: Analysis by Imaging Modality
- 9.5.1. Cost Saving Potential of Teleradiology Services in CT Scan, Since 2021
- 9.5.2. Cost Saving Potential of Teleradiology Services in MRI, Since 2021
- 9.5.3. Cost Saving Potential of Teleradiology Services in Ultrasound, Since 2021
- 9.5.4. Cost Saving Potential of Teleradiology Services in X-Ray, Since 2021
- 9.6. Cost Saving Potential of Teleradiology Services: Analysis by Region
- 9.6.1. Cost Saving Potential of Teleradiology Services in North America, Since 2021
- 9.6.2. Cost Saving Potential of Teleradiology Services in Europe, Since 2021
- 9.6.3. Cost Saving Potential of Teleradiology Services in Asia-Pacific, Since 2021
- 9.6.4. Cost Saving Potential of Teleradiology Services in Rest of the World, Since 2021
- 9.7. Cost Saving Potential of Teleradiology Services: Analysis by Economic Strength
- 9.7.1. Cost Saving Potential of Teleradiology Services in High Income Countries, Since 2021
- 9.7.2. Cost Saving Potential of Teleradiology Services in Middle Income Countries, Since 2021
- 9.8. Concluding Remarks: Base, Conservative and Optimistic Scenarios
10. MARKET FORECAST
- 10.1. Chapter Overview
- 10.2. Forecast Methodology and Key Assumptions
- 10.3. Teleradiology Services Market, Historical Trends (Since 2021) and Forecasted Estimates (Till 2035)
- 10.4. Teleradiology Services Market: Analysis by Imaging Modality
- 10.4.1. Teleradiology Services Market for CT scan, Historical Trends (Since 2021) and Forecasted Estimates (Till 2035)
- 10.4.2. Teleradiology Services Market for MRI, Historical Trends (Since 2021) and Forecasted Estimates (Till 2035)
- 10.4.3. Teleradiology Services Market for Ultrasound, Historical Trends (Since 2021) and Forecasted Estimates (Till 2035)
- 10.4.4. Teleradiology Services Market for X-Ray, Historical Trends (Since 2021) and Forecasted Estimates (Till 2035)
- 10.4.5. Teleradiology Services Market for Others, Historical Trends (Since 2021) and Forecasted Estimates (Till 2035)
- 10.5. Teleradiology Services Market: Analysis by End User
- 10.5.1. Teleradiology Services Market for Hospitals, Historical Trends (Since 2021) and Forecasted Estimates (Till 2035)
- 10.5.2. Teleradiology Services Market for Diagnostic / Imaging Centers, Historical Trends (Since 2021) and Forecasted Estimates (Till 2035)
- 10.5.3. Teleradiology Services Market for Ambulatory Surgical Centers, Historical Trends (Since 2021) and Forecasted Estimates (Till 2035)
- 10.5.4. Teleradiology Services Market for Others, Historical Trends (Since 2021) and Forecasted Estimates (Till 2035)
- 10.6. Teleradiology Services Market: Analysis by Type of Business Model
- 10.6.1. Teleradiology Services Market for B2B, Historical Trends (Since 2021) and Forecasted Estimates (Till 2035)
- 10.6.2. Teleradiology Services Market for B2C, Historical Trends (Since 2021) and Forecasted Estimates (Till 2035)
- 10.7. Teleradiology Services Market: Analysis by Geographical Regions
- 10.7.1. Teleradiology Services Market in North America, Historical Trends (Since 2021) and Forecasted Estimates (Till 2035)
- 10.7.2. Teleradiology Services Market in Europe, Historical Trends (Since 2021) and Forecasted Estimates (Till 2035)
- 10.7.3. Teleradiology Services Market in Asia-Pacific, Historical Trends (Since 2021) and Forecasted Estimates (Till 2035)
- 10.7.4. Teleradiology Services Market in Middle East and North Africa, Historical Trends (Since 2021) and Forecasted Estimates (Till 2035)
- 10.7.5. Teleradiology Services Market in Latin America, Historical Trends (Since 2021) and Forecasted Estimates (Till 2035)
- 10.8. Concluding Remarks
11. CONCLUSION
12. EXECUTIVE INSIGHTS
13. APPENDIX I: TABULATED DATA
14. APPENDIX II: LIST OF COMPANIES AND ORGANIZATIONS
List of Tables
- Table 4.1 Teleradiology Services: Information on Target Market
- Table 4.2 Teleradiology Services: Information on Imaging Modality
- Table 4.3 Teleradiology Services: Information on Type of Subspeciality Offered
- Table 4.4 Teleradiology Services: Information on End User
- Table 4.5 Teleradiology Services: Information on Type of Software
- Table 4.6 Teleradiology Services: Information on Additional Capabilities
- Table 4.7 Teleradiology Service Providers: Information on Year of Establishment, Company Size, Type of Business Model and Location of Headquarters
- Table 5.1 Company Competitiveness Analysis: List of Very Small Players
- Table 5.2 Company Competitiveness Analysis: List of Small Players
- Table 5.3 Company Competitiveness Analysis: List of Mid-sized Players
- Table 5.4 Company Competitiveness Analysis: List of Large Players
- Table 6.1 List of Companies Profiled
- Table 6.2 4ways Healthcare: Company Overview
- Table 6.3 4ways Healthcare: Recent Developments and Future Outlook
- Table 6.4 Envision Physician Services: Company Overview
- Table 6.5 Envision Physician Services: Recent Developments and Future Outlook
- Table 6.6 Everlight Radiology: Company Overview
- Table 6.7 Everlight Radiology: Recent Developments and Future Outlook
- Table 6.8 Krsnaa Diagnostics: Company Overview
- Table 6.9 Krsnaa Diagnostics: Recent Developments and Future Outlook
- Table 6.10 Medica: Company Overview
- Table 6.11 Medica: Recent Developments and Future Outlook
- Table 6.12 ONRAD: Company Overview
- Table 6.13 ONRAD: Recent Developments and Future Outlook
- Table 6.14 USARAD Holdings: Company Overview
- Table 6.15 USARAD Holdings: Recent Developments and Future Outlook
- Table 6.16 vRad: Company Overview
- Table 6.17 vRad: Recent Developments and Future Outlook
- Table 7.1 Partnerships and Collaborations: Information on Year of Agreement, Type of Partnership and Partner, Since 2015
- Table 7.2 Partnerships and Collaborations: Information on Type of Agreement (Region-wise and Geography-wise), Since 2015
- Table 7.3 Funding and Investments: Information on Year of Establishment, Location of Headquarters of Recipients, Month-Year of Investment, Type of Funding, Amount Invested and Lead Investors, Since 2015
- Table 7.4 Recent Initiatives: Information on Name of Companies, Location of Headquarters, Year of Initiative and Type of Initiative, Since 2017
- Table 9.1 Cost Saving Analysis: Information on Number of Radiologists in Various Countries
- Table 9.2 Cost Saving Analysis: Information on Number of Images (X-Ray, MRI, CT, Ultrasound) Likely to be Generated across Different Geographical Regions (In Million)
- Table 12.1 Eminence Health Solutions: Company Snapshot
- Table 12.2 NucleusHealth: Company Snapshot
- Table 13.1 Teleradiology Services: Distribution by Target Market
- Table 13.2 Teleradiology Services: Distribution by Imaging Modality
- Table 13.3 Teleradiology Services: Distribution by Target Market and Imaging Modality
- Table 13.4 Teleradiology Services: Distribution by Type of Subspeciality Offered
- Table 13.5 Teleradiology Services: Distribution by End User
- Table 13.6 Teleradiology Services: Distribution by Imaging Modality and End User
- Table 13.7 Teleradiology Services: Distribution by Type of Subspeciality Offered and End User
- Table 13.8 Teleradiology Services: Distribution by Type of Software
- Table 13.9 Teleradiology Services: Distribution by Additional Capabilities
- Table 13.10 Teleradiology Services: Distribution by Imaging Modality and Additional Capabilities
- Table 13.11 Teleradiology Service Providers: Distribution by Year of Establishment
- Table 13.12 Teleradiology Service Providers: Distribution by Company Size
- Table 13.13 Teleradiology Service Providers: Distribution by Type of Business Model
- Table 13.14 Teleradiology Service Providers: Distribution by Location of Headquarters
- Table 13.15 Partnerships and Collaborations: Cumulative Year-wise Trend, Since 2015
- Table 13.16 Partnerships and Collaborations: Distribution by Type of Partnership
- Table 13.17 Partnerships and Collaborations: Distribution by Year and Type of Partnership
- Table 13.18 Partnerships and Collaborations: Distribution by Type of Partnership and Company Size
- Table 13.19 Most Active Players: Distribution by Number of Partnerships
- Table 13.20 Partnerships and Collaborations: Local and International Agreements
- Table 13.21 Partnerships and Collaborations: Distribution by Geography
- Table 13.22 Partnerships and Collaborations: Intercontinental and Intracontinental Agreements
- Table 13.23 Funding and Investment Analysis: Cumulative Year-wise Trend of Instances, Since 2015
- Table 13.24 Funding and Investment Analysis: Cumulative Year-wise Trend of Amount Invested, Since 2015 (USD Million)
- Table 13.25 Funding and Investment Analysis: Distribution of Instances by Type of Funding
- Table 13.26 Funding and Investment Analysis: Year-Wise Distribution of Instances by Type of Funding, Since 2015
- Table 13.27 Funding and Investment Analysis: Year-Wise Distribution of Amount Invested by Type of Funding, Since 2015 (USD Million)
- Table 13.28 Funding and Investment Analysis: Distribution by Type of Funding and Year of Establishment
- Table 13.29 Funding and Investment Analysis: Distribution of Instances by Region
- Table 13.30 Funding and Investment Analysis: Distribution of Total Amount Invested by Region
- Table 13.31 Most Active Players: Distribution by Number of Funding Instances
- Table 13.32 Most Active Players: Distribution by Amount Raised (USD Million)
- Table 13.33 Recent Initiatives Analysis: Cumulative Year-Wise Trend of Instances, Since 2017
- Table 13.34 Recent Initiatives Analysis: Distribution by Type of Initiative
- Table 13.35 Recent Initiatives Analysis: Distribution of Instances by Region, Since 2017
- Table 13.36 Overall Cost Saving Potential of Teleradiology Services, Since 2021 (USD Billion)
- Table 13.37 Cost Saving Potential of Teleradiology Services in CT scan, Since 2021 (USD Billion)
- Table 13.38 Cost Saving Potential of Teleradiology Services in MRI, Since 2021 (USD Billion)
- Table 13.39 Cost Saving Potential of Teleradiology Services in Ultrasound, Since 2021 (USD Billion)
- Table 13.40 Cost Saving Potential of Teleradiology Services in X-Ray, Since 2021 (USD Billion)
- Table 13.41 Cost Saving Potential of Teleradiology Services in North America, Since 2021 (USD Billion)
- Table 13.42 Cost Saving Potential of Teleradiology Services in Europe, Since 2021 (USD Billion)
- Table 13.43 Cost Saving Potential of Teleradiology Services in Asia-Pacific, Since 2021 (USD Billion)
- Table 13.44 Cost Saving Potential of Teleradiology Services in Rest of the World, Since 2021 (USD Billion)
- Table 13.45 Cost Saving Potential of Teleradiology Services in High Income Countries, Since 2021 (USD Billion)
- Table 13.46 Cost Saving Potential of Teleradiology Services in Middle Income Countries, Since 2021 (USD Billion)
- Table 13.47 Cost Saving Potential of Teleradiology Services, Conservative, Base and Optimistic Scenarios (USD Billion)
- Table 13.48 Teleradiology Services Market, (Since 2021) and Forecasted Estimates (Till 2035), Conservative, Base and Optimistic Scenarios (USD Billion)
- Table 13.49 Teleradiology Services Market: Distribution by Imaging Modality
- Table 13.50 Teleradiology Services Market for CT scan, (Since 2021) and Forecasted Estimates (Till 2035), Conservative, Base and Optimistic Scenarios (USD Billion)
- Table 13.51 Teleradiology Services Market for MRI, (Since 2021) and Forecasted Estimates (Till 2035), Conservative, Base and Optimistic Scenarios (USD Billion)
- Table 13.52 Teleradiology Services Market for Ultrasound, (Since 2021) and Forecasted Estimates (Till 2035), Conservative, Base and Optimistic Scenarios (USD Billion)
- Table 13.53 Teleradiology Services Market for X-Ray, (Since 2021) and Forecasted Estimates (Till 2035), Conservative, Base and Optimistic Scenarios (USD Billion)
- Table 13.54 Teleradiology Services Market for Others, (Since 2021) and Forecasted Estimates (Till 2035), Conservative, Base and Optimistic Scenarios (USD Billion)
- Table 13.55 Teleradiology Services Market: Distribution by End User
- Table 13.56 Teleradiology Services Market for Hospitals, (Since 2021) and Forecasted Estimates (Till 2035), Conservative, Base and Optimistic Scenarios (USD Billion)
- Table 13.57 Teleradiology Services Market for Diagnostic / Imaging Centers, (Since 2021) and Forecasted Estimates (Till 2035), Conservative, Base and Optimistic Scenarios (USD Billion)
- Table 13.58 Teleradiology Services Market for Ambulatory Surgical Centers, (Since 2021) and Forecasted Estimates (Till 2035), Conservative, Base and Optimistic Scenarios (USD Billion)
- Table 13.59 Teleradiology Services Market for Others, (Since 2021) and Forecasted Estimates (Till 2035), Conservative, Base and Optimistic Scenarios (USD Billion)
- Table 13.60 Teleradiology Services Market: Distribution by Type of Business Model
- Table 13.61 Teleradiology Services Market for B2B, (Since 2021) and Forecasted Estimates (Till 2035), Conservative, Base and Optimistic Scenarios (USD Billion)
- Table 13.62 Teleradiology Services Market for B2C, (Since 2021) and Forecasted Estimates (Till 2035), Conservative, Base and Optimistic Scenarios (USD Billion)
- Table 13.63 Teleradiology Services Market: Distribution by Geographical Regions
- Table 13.64 Teleradiology Services Market in North America, (Since 2021) and Forecasted Estimates (Till 2035), Conservative, Base and Optimistic Scenarios (USD Billion)
- Table 13.65 Teleradiology Services Market in Europe, (Since 2021) and Forecasted Estimates (Till 2035), Conservative, Base and Optimistic Scenarios (USD Billion)
- Table 13.66 Teleradiology Services Market in Asia-Pacific, (Since 2021) and Forecasted Estimates (Till 2035), Conservative, Base and Optimistic Scenarios (USD Billion)
- Table 13.67 Teleradiology Services Market in Middle East and North Africa, (Since 2021) and Forecasted Estimates (Till 2035), Conservative, Base and Optimistic Scenarios (USD Billion)
- Table 13.68 Teleradiology Services Market in Latin America, (Since 2021) and Forecasted Estimates (Till 2035), Conservative, Base and Optimistic Scenarios (USD Billion)
List of Figures
- Figure 3.1 Historical Evolution of Teleradiology
- Figure 3.2 Types of Medical Images Processed
- Figure 3.3 Types of Medical Image Storage and Transmission Systems
- Figure 3.4 Key Regulatory Bodies
- Figure 3.5 Benefits and Limitations of Teleradiology Services
- Figure 4.1 Teleradiology Services: Distribution by Target Market
- Figure 4.2 Teleradiology Services: Distribution by Imaging Modality
- Figure 4.3 Teleradiology Services: Distribution by Target Market and Imaging Modality
- Figure 4.4 Teleradiology Services: Distribution by Type of Subspeciality Offered
- Figure 4.5 Teleradiology Services: Distribution by End User
- Figure 4.6 Teleradiology Services: Distribution by Imaging Modality and End User
- Figure 4.7 Teleradiology Services: Distribution by Type of Subspeciality Offered and End User
- Figure 4.8 Teleradiology Services: Distribution by Type of Software
- Figure 4.9 Teleradiology Services: Distribution by Additional Capabilities
- Figure 4.10 Teleradiology Services: Distribution by Imaging Modality and Additional Capabilities
- Figure 4.11 Teleradiology Service Providers: Distribution by Year of Establishment
- Figure 4.12 Teleradiology Service Providers: Distribution by Company Size
- Figure 4.13 Teleradiology Service Providers: Distribution by Type of Business Model
- Figure 4.14 Teleradiology Service Providers: Distribution by Location of Headquarters
- Figure 5.1 Company Competitiveness Analysis: Very Small Companies
- Figure 5.2 Company Competitiveness Analysis: Small Companies
- Figure 5.3 Company Competitiveness Analysis: Mid-sized Companies
- Figure 5.4 Company Competitiveness Analysis: Large Companies
- Figure 7.1 Partnerships and Collaborations: Cumulative Year-wise Trend, Since 2015
- Figure 7.2 Partnerships and Collaborations: Distribution by Type of Partnership
- Figure 7.3 Partnerships and Collaborations: Distribution by Year and Type of Partnership
- Figure 7.4 Partnerships and Collaborations: Distribution by Type of Partnership and Company Size
- Figure 7.5 Most Active Players: Distribution by Number of Partnerships
- Figure 7.6 Partnerships and Collaborations: Local and International Agreements
- Figure 7.7 Partnerships and Collaborations: Distribution by Geography
- Figure 7.8 Partnerships and Collaborations: Intercontinental and Intracontinental Agreements
- Figure 7.9 Funding and Investment Analysis: Cumulative Year-wise Trend of Instances, Since 2015
- Figure 7.10 Funding and Investment Analysis: Cumulative Year-wise Trend of Amount Invested, Since 2015 (USD Million)
- Figure 7.11 Funding and Investment Analysis: Distribution of Instances by Type of Funding
- Figure 7.12 Funding and Investment Analysis: Year-Wise Distribution of Instances by Type of Funding, Since 2015
- Figure 7.13 Funding and Investment Analysis: Year-Wise Distribution of Amount Invested by Type of Funding, Since 2015 (USD Million)
- Figure 7.14 Funding and Investment Analysis: Distribution by Type of Funding and Year of Establishment
- Figure 7.15 Funding and Investment Analysis: Distribution of Instances by Region
- Figure 7.16 Funding and Investment Analysis: Distribution of Total Amount Invested by Region
- Figure 7.17 Most Active Players: Distribution by Number of Funding Instances
- Figure 7.18 Most Active Players: Distribution by Amount Raised (USD Million)
- Figure 7.19 Recent Initiatives Analysis: Cumulative Year-wise Trend of Instances, Since 2017
- Figure 7.20 Recent Initiatives Analysis: Distribution by Type of Initiative
- Figure 7.21 Recent Initiatives Analysis: Distribution of Instances by Region
- Figure 8.1 Comparison of Red Ocean Strategy and Blue Ocean Strategy
- Figure 8.2 Blue Ocean Strategy: Strategy Canvas
- Figure 8.3 Blue Ocean Strategy: Four Action Framework
- Figure 8.4 Blue Ocean Strategy: Eliminate-Raise-Reduce-Create (ERRC) Grid
- Figure 8.5 Blue Ocean Strategy: Six Path Framework
- Figure 8.6 Blue Ocean Strategy: Pioneer-Migrator-Settler (PMS) Map
- Figure 8.7 Blue Ocean Strategy: Three Tiers of Noncustomers
- Figure 8.8 Blue Ocean Strategy: Sequence of Blue Ocean Strategy
- Figure 8.9 Blue Ocean Strategy: Buyer Utility Map
- Figure 8.10 Blue Ocean Strategy: The Price Corridor of the Mass
- Figure 9.1 Overall Cost Saving Potential of Teleradiology Services, Since 2021 (USD Billion)
- Figure 9.2 Cost Saving Potential of Teleradiology Services in CT scan, Since 2021 (USD Billion)
- Figure 9.3 Cost Saving Potential of Teleradiology Services in MRI, Since 2021 (USD Billion)
- Figure 9.4 Cost Saving Potential of Teleradiology Services in Ultrasound, Since 2021 (USD Billion)
- Figure 9.5 Cost Saving Potential of Teleradiology Services in X-Ray, Since 2021 (USD Billion)
- Figure 9.6 Cost Saving Potential of Teleradiology Services in North America, Since 2021 (USD Billion)
- Figure 9.7 Cost Saving Potential of Teleradiology Services in Europe, Since 2021 (USD Billion)
- Figure 9.8 Cost Saving Potential of Teleradiology Services in Asia-Pacific, Since 2021 (USD Billion)
- Figure 9.9 Cost Saving Potential of Teleradiology Services in Rest of the World, Since 2021 (USD Billion)
- Figure 9.10 Cost Saving Potential of Teleradiology Services in High Income Countries, Since 2021 (USD Billion)
- Figure 9.11 Cost Saving Potential of Teleradiology Services in Middle Income Countries, Since 2021 (USD Billion)
- Figure 9.12 Cost Saving Potential of Teleradiology Services: Conservative, Base and Optimistic Scenarios (USD Billion)
- Figure 10.1 Teleradiology Services Market, (Since 2021) and Forecasted Estimates (Till 2035) (USD Billion)
- Figure 10.2 Teleradiology Services Market: Distribution by Imaging Modality
- Figure 10.3 Teleradiology Services Market for CT scan, (Since 2021) and Forecasted Estimates (Till 2035) (USD Billion)
- Figure 10.4 Teleradiology Services Market for MRI, (Since 2021) and Forecasted Estimates (Till 2035) (USD Billion)
- Figure 10.5 Teleradiology Services Market for Ultrasound, (Since 2021) and Forecasted Estimates (Till 2035) (USD Billion)
- Figure 10.6 Teleradiology Services Market for X-Ray, (Since 2021) and Forecasted Estimates (Till 2035) (USD Billion)
- Figure 10.7 Teleradiology Services Market for Others, (Since 2021) and Forecasted Estimates (Till 2035) (USD Billion)
- Figure 10.8 Teleradiology Services Market: Distribution by End User
- Figure 10.9 Teleradiology Services Market for Hospitals, (Since 2021) and Forecasted Estimates (Till 2035) (USD Billion)
- Figure 10.10 Teleradiology Services Market for Diagnostic / Imaging Centers, (Since 2021) and Forecasted Estimates (Till 2035) (USD Billion)
- Figure 10.11 Teleradiology Services Market for Ambulatory Surgical Centers, (Since 2021) and Forecasted Estimates (Till 2035) (USD Billion)
- Figure 10.12 Teleradiology Services Market for Others, (Since 2021) and Forecasted Estimates (Till 2035) (USD Billion)
- Figure 10.13 Teleradiology Services Market: Distribution by Type of Business Model
- Figure 10.14 Teleradiology Services Market for B2B, (Since 2021) and Forecasted Estimates (Till 2035) (USD Billion)
- Figure 10.15 Teleradiology Services Market for B2C, (Since 2021) and Forecasted Estimates (Till 2035) (USD Billion)
- Figure 10.16 Teleradiology Services Market: Distribution by Geographical Regions
- Figure 10.17 Teleradiology Services Market in North America, (Since 2021) and Forecasted Estimates (Till 2035) (USD Billion)
- Figure 10.18 Teleradiology Services Market in Europe, (Since 2021) and Forecasted Estimates (Till 2035) (USD Billion)
- Figure 10.19 Teleradiology Services Market in Asia-Pacific, (Since 2021) and Forecasted Estimates (Till 2035) (USD Billion)
- Figure 10.20 Teleradiology Services Market in Middle East and North Africa, (Since 2021) and Forecasted Estimates (Till 2035) (USD Billion)
- Figure 10.21 Teleradiology Services Market in Latin America, (Since 2021) and Forecasted Estimates (Till 2035) (USD Billion)
- Figure 11.1 Concluding Remarks: Current Market Landscape
- Figure 11.2 Concluding Remarks: Recent Developments and Initiatives
- Figure 11.3 Concluding Remarks: Cost Saving Analysis
- Figure 11.4 Concluding Remarks: Market Forecast

 遠距放射診斷服務市場:2026-2032年全球市場預測(按服務類型、影像模式、部署方式、應用程式和最終用戶分類)遠距放射診斷市場:按模式、組件、部署模式、應用和最終用戶分類的全球市場預測 – 2026-2032 年智慧遠距放射診斷市場:按組件、模式、營運模式、定價模式、最終用戶和病患年齡層分類-2026-2032年全球市場預測
 遠距放射學市場商機、成長要素、產業趨勢分析及2026-2035年預測
 遠距放射診斷服務市場規模、佔有率和成長分析:按服務類型、影像技術、部署方式、應用、最終用戶、報告準備時間和地區分類-2026-2033年產業預測
 遠距醫療影像市場-市場趨勢、競爭格局及市場預測(2034 年)
 遠距放射診斷市場規模、佔有率和成長分析:按產品類型、報告類型、應用和地區分類-2026-2033年產業預測
 遠距醫療影像市場:按產品、最終用途和地區分類
 遠距放射學市場報告:按組件、成像技術、最終用戶和地區分類(2026-2034 年)
 全球遠距放射學市場規模、佔有率、趨勢和成長分析報告(2026-2034年)