


 |
市場調查報告書
商品編碼
2052140
全球整合視覺增強系統市場(至2035年):按產品類型、技術類型、應用、最終用戶和地區分類-產業趨勢和市場預測Integrated Visual Augmentation Systems Market, Till 2035: Distribution by Type of Product, Type of Technology, Type of Application, Type of End User, and Geographical Regions: Industry Trends and Global Forecasts |
||||||
整合視覺增強系統(IVAS)市場展望
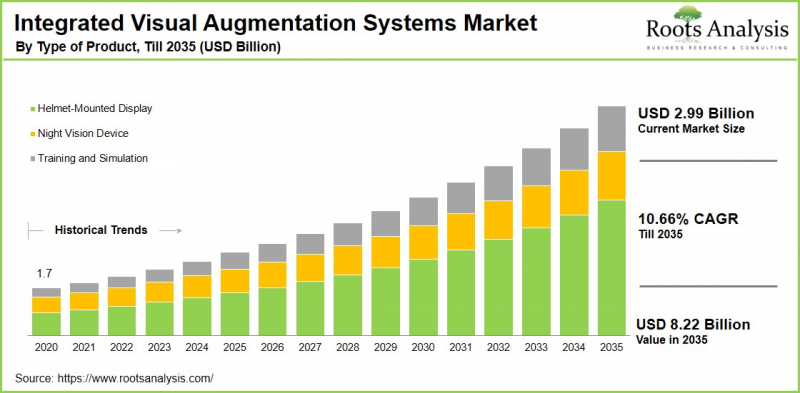
預計到 2035 年,全球整合視覺增強系統 (IVAS) 市場規模將以 10.66% 的年複合成長率成長,達到 82.2 億美元,高於目前的 29.9 億美元。
整合視覺增強系統 (IVAS) 是一種先進的軍用級擴增實境(AR) 平台,旨在提升士兵的情境察覺、決策能力和整體作戰效能。隨著國防部隊擴大採用先進的數位技術,IVAS 市場正經歷顯著成長,這主要得益於其在提升作戰能力方面發揮的關鍵作用。 IVAS 最初由微軟為美國陸軍開發,它基於高度耐環境的微軟 HoloLens 系統,打造出一個整合了夜視、熱成像和即時戰場數據等功能的抬頭顯示器。這種整合提高了任務效率、生存能力和戰場態勢感知能力,使士兵在現代戰場環境中獲得決定性的戰術性優勢。
近年來,各國政府加大對軍用穿戴技術的投資,加速了市場擴張,各國紛紛撥出大量預算用於國防領域擴增實境(AR)和混合實境(MR)技術的應用。整合視覺與行動系統(IVAS)透過人工智慧驅動的資料整合,顯著提升了即時決策能力和作戰效率,從而對軍事行動產生了重大影響。此外,情境察覺技術的持續進步,包括人工智慧和即時視覺化工具的引入,正在透過提升威脅偵測能力和戰場可視性,塑造軍事AR系統的未來。總體而言,國防領域AR和MR技術的廣泛應用預計將在整個預測期內持續推動IVAS市場的強勁成長。
整合視覺增強系統(IVAS)市場成長的關鍵市場促進因素
整合視覺增強系統 (IVAS) 市場的成長受到多個關鍵因素的驅動,包括軍事現代化項目的日益普及、全球國防費用的不斷成長以及先進士兵情境察覺技術的廣泛應用。世界各國政府都將軍事現代化列為優先事項,並大力投資下一代軍事訓練和作戰技術,以提高作戰準備水準。隨著戰爭日益技術化,對能夠支援即時數據整合和增強戰場協同的整合數位解決方案(例如 IVAS)的需求也日益成長。
這些系統具有許多顯著優勢,包括提升情境察覺、整合夜視和熱成像功能,以及擴增實境(AR)和混合實境(MR)特性,所有這些都有助於提高作戰效率和加快決策速度。此外,隨著國防機構尋求創新解決方案以增強作戰效能並在現代作戰環境中保持戰略優勢,穿戴式軍事技術日益受到關注,預計這將進一步加速市場成長。
整合視覺增強系統(IVAS)產業競爭格局的演變
包括微軟、BAE系統公司、埃爾比特系統公司和洛克希德·馬丁公司在內的整合視覺增強系統(IVAS)市場領導者,正透過持續創新、大規模國防合約和戰略聯盟積極推動產業成長。這些領先企業正大力投資研發,以提升自身能力並維持競爭優勢。此外,它們也不斷加強夥伴關係,將人工智慧和雲端運算等先進技術整合到基於擴增實境(AR)的軍事系統中。這些公司正在研發領域投入大規模,以提升系統效能並保持競爭優勢。
北美在整合視覺增強系統市場中佔據最大的市場佔有率。
今年,北美在全球整合視覺增強系統(IVAS)市場佔據最大佔有率。這一主導地位主要歸功於美國龐大的國防預算和廣泛的軍事現代化計畫,這些項目涉及對先進軍事技術的大規模投資。美國陸軍積極支持與IVAS相關的項目,並與國防研究機構和創新中心合作,推動技術的持續進步,加速市場成長。此外,該地區強大的國防採購能力和出口潛力,以及人工智慧在軍事訓練系統中的早期應用和整合,進一步鞏固了北美在全球IVAS市場的主導地位。
整合視覺增強系統(IVAS)市場面臨的主要挑戰
整合視覺增強系統 (IVAS) 部署面臨的主要挑戰之一在於技術限制和多樣化的監管要求,這兩方面都可能阻礙市場擴張。 IVAS 平台依賴高效能運算、即時資料處理和擴增實境(AR) 疊加技術,所有這些都會給系統帶來巨大的功耗負擔,並可能導致電池電量快速耗盡。因此,如何確保系統在長時間運行下無需頻繁充電仍是關鍵所在,這也使得能源效率成為關注的重點領域。
此外,國防領域智慧飛行器輔助系統(IVAS)部署的法律規範因地區而異,導致全球範圍內難以保持一致的合規性。這些技術和監管方面的挑戰可能阻礙IVAS的廣泛應用,減緩部署速度,並限制整體市場成長。
整合視覺增強系統(IVAS)市場:主要市場細分
依產品類型
- 頭盔顯示器
- 夜視設備
- 訓練和模擬
透過技術
- 擴增實境(AR)
- 混合實境(MR)
- 虛擬實境(VR)
透過使用
- 作戰任務
- 模擬和訓練
最終用戶
- 空軍
- 軍隊
- 海軍
按地區
- 北美洲
- 美國
- 加拿大
- 墨西哥
- 其他北美國家
- 歐洲
- 奧地利
- 比利時
- 丹麥
- 法國
- 德國
- 愛爾蘭
- 義大利
- 荷蘭
- 挪威
- 俄羅斯
- 西班牙
- 瑞典
- 瑞士
- 英國
- 其他歐洲國家
- 亞洲
- 中國
- 印度
- 日本
- 新加坡
- 韓國
- 其他亞洲國家
- 拉丁美洲
- 巴西
- 智利
- 哥倫比亞
- 委內瑞拉
- 其他拉丁美洲國家
- 中東和北非
- 埃及
- 伊朗
- 伊拉克
- 以色列
- 科威特
- 沙烏地阿拉伯
- 阿拉伯聯合大公國
- 其他中東和北非國家
- 世界其他地區
- 澳洲
- 紐西蘭
- 其他國家
本報告研究了全球整合視覺增強系統 (IVAS) 市場,提供了概述、背景、市場影響因素分析、市場規模趨勢和預測、按各個細分市場進行的詳細分析、競爭格局以及主要公司的概況。
目錄
第一部分:報告概述
第1章:序言
第2章:調查方法
第3章 市場動態
第4章 宏觀經濟指標
第二部分:定性考量
第5章執行摘要
第6章:引言
第7章 監管情景
第三部分:市場概覽
第8章:主要公司綜合資料庫
第9章 競爭情勢
第10章:閒置頻段分析
第11章:企業競爭力分析
第12章:整合視覺增強系統(IVAS)市場的創業生態系統
第四部分:公司簡介
第13章:公司簡介
- 章節概要
- BAE Systems
- Digital Agents Interactive
- Elbit Systems
- General Atomics
- InVeris Training Solutions
- Lockheed Martin
- Magic Leap
- Microsoft
- NVIDIA
- Optex Systems Holding
- RTX
- Thales
- Vuzix
第五部分:市場趨勢
第14章:分析大趨勢
第15章:未滿足需求的分析
第16章 專利分析
第17章 近期趨勢
第六部分:市場機會分析
第18章:全球整合視覺增強系統(IVAS)市場
第19章 依產品類型分類的市場機會
第20章 依技術類型分類的市場機會
第21章 按應用分類的市場機會
第22章 最終用戶的市場機會
第23章 北美市場機遇
第24章 歐洲市場機遇
第25章 亞洲市場機遇
第26章 中東和北非的市場機遇
第27章 鄰近市場分析
第七部分:戰略工具
第28章:制勝的關鍵策略
第29章:波特五力分析
第30章 SWOT分析
第31章 價值鏈分析
第32章:ROOTS的策略建議
第八部分:其他獨家見解
第33章 來自初步調查的見解
第34章:報告結論
第9章:附錄
第35章:表格形式數據
第36章 公司與組織列表
第37章 客製化的機會
第38章:ROOTS訂閱服務
第39章 作者信息
Integrated Visual Augmentation Systems Market Outlook
As per Roots Analysis, the global integrated visual augmentation systems market size is estimated to grow from USD 2.99 billion in the current year to USD 8.22 billion by 2035, at a CAGR of 10.66% during the forecast period, till 2035.
The integrated visual augmentation system (IVAS) is an advanced, military-grade augmented reality (AR) platform designed to enhance soldiers' situational awareness, decision-making capabilities, and overall operational effectiveness. As defense forces increasingly adopt advanced digital technologies, the IVAS market is experiencing substantial growth, driven by its critical role in improving combat performance. Originally developed for the U.S. Army by Microsoft, IVAS integrates capabilities such as night vision, thermal imaging, and real-time battlefield data into a unified heads-up display, built on a ruggedized Microsoft HoloLens-based system. This integration enables enhanced mission efficiency, survivability, and battlefield awareness, providing soldiers with a decisive tactical advantage in modern warfare environments.
In recent years, increasing government investments in soldier-wearable technologies have accelerated market expansion, with countries allocating significant budgets toward augmented reality (AR) and mixed reality (MR) applications for defense. The impact of IVAS on military operations is significant, as it enhances real-time decision-making and operational efficiency through AI-driven data integration. Furthermore, ongoing advancements in situational awareness technologies, including the incorporation of artificial intelligence and real-time visualization tools, are shaping the future of military AR systems by improving threat detection and battlefield visibility. Collectively, the rising adoption of AR and MR technologies in the defense sector is expected to sustain strong growth in the IVAS market throughout the forecast period.
Strategic Insights for Senior Leaders
Key Drivers Propelling Growth of Integrated Visual Augmentation Systems Market
The growth of the integrated visual augmentation systems (IVAS) market is driven by several key factors, including the increasing prevalence of military modernization programs, rising global defense expenditures, and the growing adoption of advanced soldier situational awareness technologies. Governments worldwide are prioritizing the modernization of their armed forces and investing significantly in next-generation military training and operational technologies to enhance combat readiness. As warfare becomes increasingly technology-centric, there is a heightened demand for integrated digital solutions such as IVAS that can support real-time data integration and improved battlefield coordination.
These systems offer substantial advantages, including enhanced situational awareness, integrated night vision and thermal imaging capabilities, as well as augmented and mixed reality functionalities, all of which contribute to improved combat efficiency, faster decision-making. Furthermore, the increasing focus on wearable military technologies is expected to further accelerate market growth, as defense organizations seek innovative solutions to strengthen operational effectiveness and maintain a strategic advantage in modern combat environments.
Evolving Competitive Landscape of Integrated Visual Augmentation Systems Industry
Key players in the integrated visual augmentation systems (IVAS) market, including Microsoft, BAE Systems, Elbit Systems, and Lockheed Martin, are actively driving industry growth through continuous technological innovation, major defense contracts, and strategic collaborations. These leading organizations are focusing on substantial investments in research and development to advance capabilities and maintain a competitive edge. In addition, they are increasingly forming partnerships and alliances to integrate advanced technologies such as artificial intelligence and cloud computing into augmented reality-based military systems. By aligning their strategies with evolving industry trends and emphasizing innovation, these companies are strengthening their market position and effectively responding to intensifying competition within the sector.
North America Holding the Largest Share in the Integrated Visual Augmentation Systems Market
According to our analysis, in the current year, North America captures the highest share of the global integrated visual augmentation systems market. This dominance is driven by a combination of factors, primarily substantial defense budgets and extensive military modernization initiatives in the United States, which allocate significant funding toward advanced military technologies. The U.S. Army, along with defense research institutions and innovation hubs, actively supports IVAS-related programs, fostering continuous technological advancements and accelerating market growth. In addition, the early adoption and integration of artificial intelligence in military training systems, coupled with the region's strong defense procurement capabilities and export potential, further reinforce North America's leading position in the global IVAS market.
Key Challenges in the Integrated Visual Augmentation Systems Market
One of the primary challenges in the implementation of integrated visual augmentation systems (IVAS) lies in technical constraints and varying regulatory requirements, both of which can hinder market expansion. IVAS platforms depend on high-performance computing, real-time data processing, and augmented reality overlays, all of which place significant demands on power consumption and can lead to rapid battery depletion. Consequently, ensuring sustained operational performance over extended durations without frequent recharging remains a critical concern, making energy efficiency a key focus area.
In addition, regulatory frameworks governing IVAS deployment in the defense sector differ across regions, creating complexities in maintaining consistent compliance on a global scale. These technical and regulatory challenges collectively act as barriers to widespread adoption, potentially slowing the pace of deployment and limiting overall market growth.
Integrated Visual Augmentation Systems Market: Key Market Segmentation
By Type of Product
- Helmet-Mounted Display
- Night Vision Devices
- Training and Simulation
By Type of Technology
- Augmented Reality
- Mixed Reality
- Virtual Reality
By Type of Application
- Combat Mission
- Simulation and Training
By Type of End User
- Air Force
- Army
- Navy
By Geographical Regions
- North America
- US
- Canada
- Mexico
- Other North American countries
- Europe
- Austria
- Belgium
- Denmark
- France
- Germany
- Ireland
- Italy
- Netherlands
- Norway
- Russia
- Spain
- Sweden
- Switzerland
- UK
- Other European countries
- Asia
- China
- India
- Japan
- Singapore
- South Korea
- Other Asian countries
- Latin America
- Brazil
- Chile
- Colombia
- Venezuela
- Other Latin American countries
- Middle East and North Africa
- Egypt
- Iran
- Iraq
- Israel
- Kuwait
- Saudi Arabia
- UAE
- Other MENA countries
- Rest of the World
- Australia
- New Zealand
- Other countries
Example Players in Integrated Visual Augmentation Systems Market
- BAE Systems
- Digital Agents Interactive
- Elbit System
- General Atomics
- Inveris Training Solutions
- Lockheed Martin
- Magic Leap
- Microsoft
- NVIDIA
- Optex Systems Holding
- RTX
- Thales
- Vuzix
Integrated Visual Augmentation Systems Market: Report Coverage
The report on the integrated visual augmentation systems market features insights on various sections, including:
- Market Sizing and Opportunity Analysis: An in-depth analysis of the integrated visual augmentation systems market, focusing on key market segments, including [A] type of product, [B] type of technology, [C] type of application, [D] type of end user, and [E] geographical regions.
- Competitive Landscape: A comprehensive analysis of the companies engaged in the integrated visual augmentation systems market, based on several relevant parameters, such as [A] year of establishment, [B] company size, [C] location of headquarters and [D] ownership structure.
- Company Profiles: Elaborate profiles of prominent players engaged in the integrated visual augmentation systems market, providing details on [A] location of headquarters, [B] company size, [C] company mission, [D] company footprint, [E] management team, [F] contact details, [G] financial information, [H] operating business segments, [I] product / technology portfolio, [J] recent developments, and an informed future outlook.
- Megatrends: An evaluation of ongoing megatrends in the integrated visual augmentation systems industry.
- Patent Analysis: An insightful analysis of patents filed / granted in the integrated visual augmentation systems domain, based on relevant parameters, including [A] type of patent, [B] patent publication year, [C] patent age and [D] leading players.
- Recent Developments: An overview of the recent developments made in the integrated visual augmentation systems market, along with analysis based on relevant parameters, including [A] year of initiative, [B] type of initiative, [C] geographical distribution and [D] most active players.
- Porter's Five Forces Analysis: An analysis of five competitive forces prevailing in the integrated visual augmentation systems market, including threats of new entrants, bargaining power of buyers, bargaining power of suppliers, threats of substitute products and rivalry among existing competitors.
- SWOT Analysis: An insightful SWOT framework, highlighting the strengths, weaknesses, opportunities and threats in the domain. Additionally, it provides Harvey ball analysis, highlighting the relative impact of each SWOT parameter.
Key Questions Answered in this Report
- What is the current and future market size?
- Who are the leading companies in this market?
- What are the growth drivers that are likely to influence the evolution of this market?
- What are the key partnership and funding trends shaping this industry?
- Which region is likely to grow at higher CAGR till 2035?
- How is the current and future market opportunity likely to be distributed across key market segments?
Reasons to Buy this Report
- Detailed Market Analysis: The report provides a comprehensive market analysis, offering detailed revenue projections of the overall market and its specific sub-segments. This information is valuable to both established market leaders and emerging entrants.
- In-depth Analysis of Trends: Stakeholders can leverage the report to gain a deeper understanding of the competitive dynamics within the market. Each report maps ecosystem activity across partnerships, funding, and patent landscapes to reveal growth hotspots and white spaces in the industry.
- Opinion of Industry Experts: The report features extensive interviews and surveys with key opinion leaders and industry experts to validate market trends mentioned in the report.
- Decision-ready Deliverables: The report offers stakeholders with strategic frameworks (Porter's Five Forces, value chain, SWOT), and complimentary Excel / slide packs with customization support.
Additional Benefits
- Complimentary Dynamic Excel Dashboards for Analytical Modules
- Exclusive 15% Free Content Customization
- Personalized Interactive Report Walkthrough with Our Expert Research Team
- Free Report Updates for Versions Older than 6-12 Months
TABLE OF CONTENTS
SECTION I: REPORT OVERVIEW
1. PREFACE
- 1.1. Introduction
- 1.2. Market Share Insights
- 1.3. Key Market Insights
- 1.4. Report Coverage
- 1.5. Key Questions Answered
- 1.6. Chapter Outlines
2. RESEARCH METHODOLOGY
- 2.1. Chapter Overview
- 2.2. Research Assumptions
- 2.3. Database Building
- 2.3.1. Data Collection
- 2.3.2. Data Validation
- 2.3.3. Data Analysis
- 2.4. Project Methodology
- 2.4.1. Secondary Research
- 2.4.1.1. Annual Reports
- 2.4.1.2. Academic Research Papers
- 2.4.1.3. Company Websites
- 2.4.1.4. Investor Presentations
- 2.4.1.5. Regulatory Filings
- 2.4.1.6. White Papers
- 2.4.1.7. Industry Publications
- 2.4.1.8. Conferences and Seminars
- 2.4.1.9. Government Portals
- 2.4.1.10. Media and Press Releases
- 2.4.1.11. Newsletters
- 2.4.1.12. Industry Databases
- 2.4.1.13. Roots Proprietary Databases
- 2.4.1.14. Paid Databases and Sources
- 2.4.1.15. Social Media Portals
- 2.4.1.16. Other Secondary Sources
- 2.4.2. Primary Research
- 2.4.2.1. Introduction
- 2.4.2.2. Types
- 2.4.2.2.1. Qualitative
- 2.4.2.2.2. Quantitative
- 2.4.2.3. Advantages
- 2.4.2.4. Techniques
- 2.4.2.4.1. Interviews
- 2.4.2.4.2. Surveys
- 2.4.2.4.3. Focus Groups
- 2.4.2.4.4. Observational Research
- 2.4.2.4.5. Social Media Interactions
- 2.4.2.5. Stakeholders
- 2.4.2.5.1. Company Executives (CXOs)
- 2.4.2.5.2. Board of Directors
- 2.4.2.5.3. Company Presidents and Vice Presidents
- 2.4.2.5.4. Key Opinion Leaders
- 2.4.2.5.5. Research and Development Heads
- 2.4.2.5.6. Technical Experts
- 2.4.2.5.7. Subject Matter Experts
- 2.4.2.5.8. Scientists
- 2.4.2.5.9. Doctors and Other Healthcare Providers
- 2.4.2.6. Ethics and Integrity
- 2.4.2.6.1. Research Ethics
- 2.4.2.6.2. Data Integrity
- 2.4.3. Analytical Tools and Databases
- 2.4.1. Secondary Research
3. MARKET DYNAMICS
- 3.1. Forecast Methodology
- 3.1.1. Top-Down Approach
- 3.1.2. Bottom-Up Approach
- 3.1.3. Hybrid Approach
- 3.2. Market Assessment Framework
- 3.2.1. Total Addressable Market (TAM)
- 3.2.2. Serviceable Addressable Market (SAM)
- 3.2.3. Serviceable Obtainable Market (SOM)
- 3.2.4. Currently Acquired Market (CAM)
- 3.3. Forecasting Tools and Techniques
- 3.3.1. Qualitative Forecasting
- 3.3.2. Correlation
- 3.3.3. Regression
- 3.3.4. Time Series Analysis
- 3.3.5. Extrapolation
- 3.3.6. Convergence
- 3.3.7. Forecast Error Analysis
- 3.3.8. Data Visualization
- 3.3.9. Scenario Planning
- 3.3.10. Sensitivity Analysis
- 3.4. Key Considerations
- 3.4.1. Demographics
- 3.4.2. Market Access
- 3.4.3. Reimbursement Scenarios
- 3.4.4. Industry Consolidation
- 3.5. Robust Quality Control
- 3.6. Key Market Segmentations
- 3.7. Limitations
4. MACRO-ECONOMIC INDICATORS
- 4.1. Chapter Overview
- 4.2. Market Dynamics
- 4.2.1. Time Period
- 4.2.1.1. Historical Trends
- 4.2.1.2. Current and Forecasted Estimates
- 4.2.2. Currency Coverage
- 4.2.2.1. Overview of Major Currencies Affecting the Market
- 4.2.2.2. Impact of Currency Fluctuations on the Industry
- 4.2.3. Foreign Exchange Impact
- 4.2.3.1. Evaluation of Foreign Exchange Rates and Their Impact on Market
- 4.2.3.2. Strategies for Mitigating Foreign Exchange Risk
- 4.2.4. Recession
- 4.2.4.1. Historical Analysis of Past Recessions and Lessons Learnt
- 4.2.4.2. Assessment of Current Economic Conditions and Potential Impact on the Market
- 4.2.5. Inflation
- 4.2.5.1. Measurement and Analysis of Inflationary Pressures in the Economy
- 4.2.5.2. Potential Impact of Inflation on the Market Evolution
- 4.2.6. Interest Rates
- 4.2.6.1. Overview of Interest Rates and Their Impact on the Market
- 4.2.6.2. Strategies for Managing Interest Rate Risk
- 4.2.7. Commodity Flow Analysis
- 4.2.7.1. Type of Commodity
- 4.2.7.2. Origins and Destinations
- 4.2.7.3. Values and Weights
- 4.2.7.4. Modes of Transportation
- 4.2.8. Global Trade Dynamics
- 4.2.8.1. Import Scenario
- 4.2.8.2. Export Scenario
- 4.2.9. War Impact Analysis
- 4.2.9.1. Russian-Ukraine War
- 4.2.9.2. Israel-Hamas War
- 4.2.10. COVID Impact / Related Factors
- 4.2.10.1. Global Economic Impact
- 4.2.10.2. Industry-specific Impact
- 4.2.10.3. Government Response and Stimulus Measures
- 4.2.10.4. Future Outlook and Adaptation Strategies
- 4.2.11. Other Indicators
- 4.2.11.1. Fiscal Policy
- 4.2.11.2. Consumer Spending
- 4.2.11.3. Gross Domestic Product (GDP)
- 4.2.11.4. Employment
- 4.2.11.5. Taxes
- 4.2.11.6. R&D Innovation
- 4.2.11.7. Stock Market Performance
- 4.2.11.8. Supply Chain
- 4.2.11.9. Cross-Border Dynamics
- 4.2.1. Time Period
SECTION II: QUALITATIVE INSIGHTS
5. EXECUTIVE SUMMARY
6. INTRODUCTION
- 6.1. Chapter Overview
- 6.2. Overview of Integrated Visual Augmentation Systems Market
- 6.2.1. Type of Product
- 6.2.2. Type of Technology
- 6.2.3. Type of Application
- 6.2.4. Type of End User
- 6.3. Future Perspective
7. REGULATORY SCENARIO
SECTION III: MARKET OVERVIEW
8. COMPREHENSIVE DATABASE OF LEADING PLAYERS
9. COMPETITIVE LANDSCAPE
- 9.1. Chapter Overview
- 9.2. Integrated Visual Augmentation System: Overall Market Landscape
- 9.2.1. Analysis by Year of Establishment
- 9.2.2. Analysis by Company Size
- 9.2.3. Analysis by Location of Headquarters
- 9.2.4. Analysis by Ownership Structure
10. WHITE SPACE ANALYSIS
11. COMPANY COMPETITIVENESS ANALYSIS
12. STARTUP ECOSYSTEM IN THE INTEGRATED VISUAL AUGMENTATION SYSTEMS MARKET
- 12.1. Integrated Visual Augmentation Systems: Market Landscape of Startups
- 12.1.1. Analysis by Year of Establishment
- 12.1.2. Analysis by Company Size
- 12.1.3. Analysis by Company Size and Year of Establishment
- 12.1.4. Analysis by Location of Headquarters
- 12.1.5. Analysis by Company Size and Location of Headquarters
- 12.1.6. Analysis by Ownership Structure
- 12.2. Key Findings
SECTION IV: COMPANY PROFILES
13. COMPANY PROFILES
- 13.1. Chapter Overview
- 13.2. BAE Systems*
- 13.2.1. Company Overview
- 13.2.2. Company Mission
- 13.2.3. Company Footprint
- 13.2.4. Management Team
- 13.2.5. Contact Details
- 13.2.6. Financial Performance
- 13.2.7. Operating Business Segments
- 13.2.8. Service / Product Portfolio (project specific)
- 13.2.9. MOAT Analysis
- 13.2.10. Recent Developments and Future Outlook
- 13.3. Digital Agents Interactive
- 13.4. Elbit Systems
- 13.5. General Atomics
- 13.6. InVeris Training Solutions
- 13.7. Lockheed Martin
- 13.8. Magic Leap
- 13.9. Microsoft
- 13.10. NVIDIA
- 13.11. Optex Systems Holding
- 13.12. RTX
- 13.13. Thales
- 13.14. Vuzix
SECTION V: MARKET TRENDS
14. MEGA TRENDS ANALYSIS
15. UNMET NEED ANALYSIS
16. PATENT ANALYSIS
17. RECENT DEVELOPMENTS
- 17.1. Chapter Overview
- 17.2. Recent Funding
- 17.3. Recent Partnerships
- 17.4. Other Recent Initiatives
SECTION VI: MARKET OPPORTUNITY ANALYSIS
18. GLOBAL INTEGRATED VISUAL AUGMENTATION SYSTEMS MARKET
- 18.1. Chapter Overview
- 18.2. Key Assumptions and Methodology
- 18.3. Trends Disruption Impacting Market
- 18.4. Demand Side Trends
- 18.5. Supply Side Trends
- 18.6. Global Integrated Visual Augmentation Systems Market, Historical Trends (Since 2020) and Forecasted Estimates (Till 2035)
- 18.7. Multivariate Scenario Analysis
- 18.7.1. Conservative Scenario
- 18.7.2. Optimistic Scenario
- 18.8. Investment Feasibility Index
- 18.9. Key Market Segmentations
19. MARKET OPPORTUNITIES BASED ON TYPE OF PRODUCT
- 19.1. Chapter Overview
- 19.2. Key Assumptions and Methodology
- 19.3. Revenue Shift Analysis
- 19.4. Market Movement Analysis
- 19.5. Penetration-Growth (P-G) Matrix
- 19.6. Integrated Visual Augmentation Systems Market for Helmet-Mounted Display: Historical Trends (Since 2020) and Forecasted Estimates (Till 2035)
- 19.7. Integrated Visual Augmentation Systems Market for Night Vision Devices: Historical Trends (Since 202) and Forecasted Estimates (Till 2035)
- 19.8. Integrated Visual Augmentation Systems Market for Training and Simulation: Historical Trends (Since 202) and Forecasted Estimates (Till 2035)
- 19.9. Data Triangulation and Validation
- 19.9.1. Secondary Sources
- 19.9.2. Primary Sources
- 19.9.3. Statistical Modeling
20. MARKET OPPORTUNITIES BASED ON TYPE OF TECHNOLOGY
- 20.1. Chapter Overview
- 20.2. Key Assumptions and Methodology
- 20.3. Revenue Shift Analysis
- 20.4. Market Movement Analysis
- 20.5. Penetration-Growth (P-G) Matrix
- 20.6. Integrated Visual Augmentation Systems Market for Augmented Reality: Historical Trends (Since 2020) and Forecasted Estimates (Till 2035)
- 20.7. Integrated Visual Augmentation Systems Market for Mixed Reality: Historical Trends (Since 2020) and Forecasted Estimates (Till 2035)
- 20.8. Integrated Visual Augmentation Systems Market for Virtual Reality: Historical Trends (Since 2020) and Forecasted Estimates (Till 2035)
- 20.9. Data Triangulation and Validation
- 20.9.1. Secondary Sources
- 20.9.2. Primary Sources
- 20.9.3. Statistical Modeling
21. MARKET OPPORTUNITIES BASED ON TYPE OF APPLICATION
- 21.1. Chapter Overview
- 21.2. Key Assumptions and Methodology
- 21.3. Revenue Shift Analysis
- 21.4. Market Movement Analysis
- 21.5. Penetration-Growth (P-G) Matrix
- 21.6. Integrated Visual Augmentation Systems Market for Combat Mission: Historical Trends (Since 2020) and Forecasted Estimates (Till 2035)
- 21.7. Integrated Visual Augmentation Systems Market for Simulation and Training: Historical Trends (Since 2020) and Forecasted Estimates (Till 2035)
- 21.8. Data Triangulation and Validation
- 21.8.1. Secondary Sources
- 21.8.2. Primary Sources
- 21.8.3. Statistical Modeling
22. MARKET OPPORTUNITIES BASED ON TYPE OF END USER
- 22.1. Chapter Overview
- 22.2. Key Assumptions and Methodology
- 22.3. Revenue Shift Analysis
- 22.4. Market Movement Analysis
- 22.5. Penetration-Growth (P-G) Matrix
- 22.6. Integrated Visual Augmentation Systems Market for Air Force: Historical Trends (Since 2020) and Forecasted Estimates (Till 2035)
- 22.7. Integrated Visual Augmentation Systems Market for Army: Historical Trends (Since 2020) and Forecasted Estimates (Till 2035)
- 22.8. Integrated Visual Augmentation Systems Market for Navy: Historical Trends (Since 2020) and Forecasted Estimates (Till 2035)
- 22.9. Data Triangulation and Validation
- 22.9.1. Secondary Sources
- 22.9.2. Primary Sources
- 22.9.3. Statistical Modeling
23. MARKET OPPORTUNITIES FOR INTEGRATED VISUAL AUGMENTATION SYSTEMS IN NORTH AMERICA
- 23.1. Chapter Overview
- 23.2. Key Assumptions and Methodology
- 23.3. Revenue Shift Analysis
- 23.4. Market Movement Analysis
- 23.5. Penetration-Growth (P-G) Matrix
- 23.6. Integrated Visual Augmentation Systems Market in North America: Historical Trends (Since 2020) and Forecasted Estimates (Till 2035)
- 23.6.1. Integrated Visual Augmentation Systems Market in the US: Historical Trends (Since 2020) and Forecasted Estimates (Till 2035)
- 23.6.2. Integrated Visual Augmentation Systems Market in Canada: Historical Trends (Since 2020) and Forecasted Estimates (Till 2035)
- 23.6.3. Integrated Visual Augmentation Systems Market in Mexica: Historical Trends (Since 2020) and Forecasted Estimates (Till 2035)
- 23.6.4. Integrated Visual Augmentation Systems Market in Other North American Countries: Historical Trends (Since 2020) and Forecasted Estimates (Till 2035)
- 23.7. Data Triangulation and Validation
24. MARKET OPPORTUNITIES FOR INTEGRATED VISUAL AUGMENTATION SYSTEMS IN EUROPE
- 24.1. Chapter Overview
- 24.2. Key Assumptions and Methodology
- 24.3. Revenue Shift Analysis
- 24.4. Market Movement Analysis
- 24.5. Penetration-Growth (P-G) Matrix
- 24.6. Integrated Visual Augmentation Systems Market in Europe: Historical Trends (Since 2020) and Forecasted Estimates (Till 2035)
- 24.6.1. Integrated Visual Augmentation Systems Market in Austria: Historical Trends (Since 2020) and Forecasted Estimates (Till 2035)
- 24.6.2. Integrated Visual Augmentation Systems Market in Belgium: Historical Trends (Since 2020) and Forecasted Estimates (Till 2035)
- 24.6.3. Integrated Visual Augmentation Systems Market in Denmark: Historical Trends (Since 2020) and Forecasted Estimates (Till 2035)
- 24.6.4. Integrated Visual Augmentation Systems Market in France: Historical Trends (Since 2020) and Forecasted Estimates (Till 2035)
- 24.6.5. Integrated Visual Augmentation Systems Market in Germany: Historical Trends (Since 2020) and Forecasted Estimates (Till 2035)
- 24.6.6. Integrated Visual Augmentation Systems Market in Ireland: Historical Trends (Since 2020) and Forecasted Estimates (Till 2035)
- 24.6.7. Integrated Visual Augmentation Systems Market in Italy: Historical Trends (Since 2020) and Forecasted Estimates (Till 2035)
- 24.6.8. Integrated Visual Augmentation Systems Market in Netherlands: Historical Trends (Since 2020) and Forecasted Estimates (Till 2035)
- 24.6.9. Integrated Visual Augmentation Systems Market in Norway: Historical Trends (Since 2020) and Forecasted Estimates (Till 2035)
- 24.6.10. Integrated Visual Augmentation Systems Market in Russia: Historical Trends (Since 2020) and Forecasted Estimates (Till 2035)
- 24.6.11. Integrated Visual Augmentation Systems Market in Spain: Historical Trends (Since 2020) and Forecasted Estimates (Till 2035)
- 24.6.12. Integrated Visual Augmentation Systems Market in Sweden: Historical Trends (Since 2020) and Forecasted Estimates (Till 2035)
- 24.6.13. Integrated Visual Augmentation Systems Market in Switzerland: Historical Trends (Since 2020) and Forecasted Estimates (Till 2035)
- 24.6.14. Integrated Visual Augmentation Systems Market in the UK: Historical Trends (Since 2020) and Forecasted Estimates (Till 2035)
- 24.6.15. Integrated Visual Augmentation Systems Market in Other European Countries: Historical Trends (Since 2020) and Forecasted Estimates (Till 2035)
- 24.7. Data Triangulation and Validation
25. MARKET OPPORTUNITIES FOR INTEGRATED VISUAL AUGMENTATION SYSTEMS IN ASIA
- 25.1. Chapter Overview
- 25.2. Key Assumptions and Methodology
- 25.3. Revenue Shift Analysis
- 25.4. Market Movement Analysis
- 25.5. Penetration-Growth (P-G) Matrix
- 25.6. Integrated Visual Augmentation Systems Market in Asia: Historical Trends (Since 2020) and Forecasted Estimates (Till 2035)
- 25.6.1. Integrated Visual Augmentation Systems Market in China: Historical Trends (Since 2020) and Forecasted Estimates (Till 2035)
- 25.6.2. Integrated Visual Augmentation Systems Market in India: Historical Trends (Since 2020) and Forecasted Estimates (Till 2035)
- 25.6.3. Integrated Visual Augmentation Systems Market in Japan: Historical Trends (Since 2020) and Forecasted Estimates (Till 2035)
- 25.6.4. Integrated Visual Augmentation Systems Market in Singapore: Historical Trends (Since 2020) and Forecasted Estimates (Till 2035)
- 25.6.5. Integrated Visual Augmentation Systems Market in South Korea: Historical Trends (Since 2020) and Forecasted Estimates (Till 2035)
- 25.6.6. Integrated Visual Augmentation Systems Market in Other Asian Countries: Historical Trends (Since 2020) and Forecasted Estimates (Till 2035)
- 25.7. Data Triangulation and Validation
26. MARKET OPPORTUNITIES FOR INTEGRATED VISUAL AUGMENTATION SYSTEMS IN MIDDLE EAST AND NORTH AFRICA (MENA)
- 26.1. Chapter Overview
- 26.2. Key Assumptions and Methodology
- 26.3. Revenue Shift Analysis
- 26.4. Market Movement Analysis
- 26.5. Penetration-Growth (P-G) Matrix
- 26.6. Integrated Visual Augmentation Systems Market in Middle East and North Africa (MENA): Historical Trends (Since 2020) and Forecasted Estimates (Till 2035)
- 26.6.1. Integrated Visual Augmentation Systems Market in Egypt: Historical Trends (Since 2020) and Forecasted Estimates (Till 205)
- 26.6.2. Integrated Visual Augmentation Systems Market in Iran: Historical Trends (Since 2020) and Forecasted Estimates (Till 2035)
- 26.6.3. Integrated Visual Augmentation Systems Market in Iraq: Historical Trends (Since 2020) and Forecasted Estimates (Till 2035)
- 26.6.4. Integrated Visual Augmentation Systems Market in Israel: Historical Trends (Since 2020) and Forecasted Estimates (Till 2035)
- 26.6.5. Integrated Visual Augmentation Systems Market in Kuwait: Historical Trends (Since 2020) and Forecasted Estimates (Till 2035)
- 26.6.6. Integrated Visual Augmentation Systems Market in Saudi Arabia: Historical Trends (Since 2020) and Forecasted Estimates (Till 2035)
- 26.6.7. Neuromorphic Computing Marke in United Arab Emirates (UAE): Historical Trends (Since 2020) and Forecasted Estimates (Till 2035)
- 26.6.8. Integrated Visual Augmentation Systems Market in Other MENA Countries: Historical Trends (Since 2020) and Forecasted Estimates (Till 2035)
- 26.7. Data Triangulation and Validation


