


 |
市場調查報告書
商品編碼
1755205
整合視覺增強系統市場機會、成長動力、產業趨勢分析及 2025 - 2034 年預測Integrated Visual Augmentation System Market Opportunity, Growth Drivers, Industry Trend Analysis, and Forecast 2025 - 2034 |
||||||
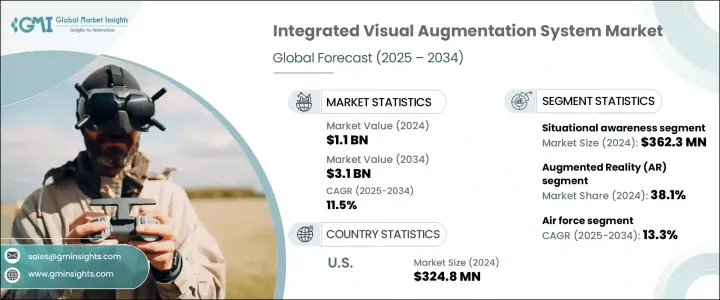
2024年,全球整合視覺增強系統市場規模達11億美元,預計2034年將以11.5%的複合年成長率成長,達到31億美元。影響這一發展軌蹟的一個主要因素是對中國進口產品徵收的關稅,這推高了光學感測器和微電子裝置等關鍵零件的採購成本。這些貿易措施促使許多國防供應商修改其採購策略,轉向其他供應商並增加國內製造,以控制成本並確保專案持續有效。
全球各地的武裝部隊正在加緊現代化建設,旨在提升士兵在不斷變化的戰場上的表現、敏捷性和生存力。 IVAS 解決方案在這一轉變中發揮核心作用,它整合了即時導航、通訊、熱成像和戰術感知等先進功能。軍事組織正在採用這些系統來應對新興威脅,尤其是在城市戰爭日益盛行、全球衝突加劇的背景下。穿戴式科技的整合有助於簡化決策流程並增強指揮控制流程。跨職能國防計畫進一步推動了對高科技、多功能設備的需求,以滿足日益複雜的現代作戰場景的需求。
| 市場範圍 | |
|---|---|
| 起始年份 | 2024 |
| 預測年份 | 2025-2034 |
| 起始值 | 11億美元 |
| 預測值 | 31億美元 |
| 複合年成長率 | 11.5% |
就產品類型而言,頭盔顯示器市場在2023年創造了4.936億美元的收入。這類系統因其能夠直接在士兵視野範圍內提供關鍵任務資料,從而提高反應時間、機動性和環境感知能力,而日益受到歡迎。隨著武裝部隊致力於最佳化即時戰術執行和態勢指揮,對頭盔顯示器的需求也不斷成長。
從技術角度來看,擴增實境 (AR) 預計將在 2024 年佔據整合視覺增強系統市場 38.1% 的佔有率。該技術透過即時疊加關鍵視覺資料來增強戰場功能,顯著提升導航、威脅識別和作戰協調能力。作為一項核心賦能技術,它對於當前和未來專注於沉浸式、數據豐富的作戰支援系統的軍事戰略至關重要。
2024年,美國整合視覺增強系統市場規模達3.248億美元。國防和航太領域的積極投資推動了美國在該領域的成長。對系統升級的持續重視以及聯邦政府對現代軍事計畫的投入,加劇了對整合視覺增強功能的需求,這有助於增強任務準備度和整體作戰效率。
影響全球整合視覺增強系統市場競爭格局的關鍵參與者包括 Varjo、L3Harris Technologies, Inc. 和 Elbit Systems Ltd.。 IVAS 市場的領導企業正在透過策略性投資、產品創新和供應鏈重組等多種方式來提升競爭優勢。為了因應不斷變化的進口形勢,各公司一直在實現供應商基礎多元化,並加強國內零件採購。許多公司將研發工作放在首位,以增強 AR 整合度、光學性能和系統耐用性。這些公司正與軍事現代化目標緊密結合,客製化解決方案以滿足戰場特定需求,包括緊湊設計、無縫通訊模組和即時資料疊加。建立戰略國防夥伴關係和參與政府主導的技術計劃也是擴大市場範圍和獲得長期合約的關鍵策略。
目錄
第1章:方法論與範圍
第2章:執行摘要
第3章:行業洞察
- 產業生態系統分析
- 影響價值鏈的因素
- 利潤率分析
- 中斷
- 未來展望
- 製造商
- 經銷商
- 川普政府關稅分析
- 對貿易的影響
- 貿易量中斷
- 報復措施
- 對產業的影響
- 供應方影響(原料)
- 主要材料價格波動
- 供應鏈重組
- 生產成本影響
- 需求面影響(售價)
- 價格傳導至終端市場
- 市佔率動態
- 消費者反應模式
- 供應方影響(原料)
- 受影響的主要公司
- 策略產業反應
- 供應鏈重組
- 定價和產品策略
- 政策參與
- 展望與未來考慮
- 對貿易的影響
- 供應商格局
- 利潤率分析
- 重要新聞和舉措
- 監管格局
- 衝擊力
- 成長動力
- 軍事現代化計劃不斷推進
- 擴增實境 (AR) 與人工智慧的融合
- 要求提高士兵的安全和表現
- 政府支持資金和合約
- 全球安全威脅與不對稱戰爭不斷上升
- 產業陷阱與挑戰
- 開發和採購成本高
- 操作和技術可靠性問題
- 成長動力
- 成長潛力分析
- 波特的分析
- PESTEL分析
第4章:競爭格局
- 介紹
- 公司市佔率分析
- 競爭定位矩陣
- 戰略展望矩陣
第5章:市場估計與預測:按產品,2021-2034
- 主要趨勢
- 頭盔顯示器
- 夜視裝置
第6章:市場估計與預測:依技術,2021-2034 年
- 主要趨勢
- 擴增實境(AR)
- 混合實境(MR)
- 虛擬實境(VR)
- 熱成像和微光成像
- 其他
第7章:市場估計與預測:按應用,2021-2034
- 主要趨勢
- 態勢感知
- 導航和地圖繪製
- 訓練和模擬
- 目標獲取和參與
- 其他
第8章:市場估計與預測:依最終用途,2021-2034
- 主要趨勢
- 空軍
- 軍隊
- 海軍
第9章:市場估計與預測:按地區,2021-2034
- 主要趨勢
- 北美洲
- 美國
- 加拿大
- 歐洲
- 英國
- 德國
- 法國
- 義大利
- 西班牙
- 俄羅斯
- 亞太地區
- 中國
- 印度
- 日本
- 韓國
- 澳洲
- 拉丁美洲
- 巴西
- 墨西哥
- MEA
- 南非
- 沙烏地阿拉伯
- 阿拉伯聯合大公國
第10章:公司簡介
- Ajnalens
- Anduril
- Elbit Systems Ltd
- L3Harris Technologies, Inc.
- Lockheed Martin
- Optex Systems
- Varjo
- VirTra, Inc.
- Vrgineers, Inc.
- Vuzix Corporation
The Global Integrated Visual Augmentation System Market was valued at USD 1.1 billion in 2024 and is estimated to grow at a CAGR of 11.5% to reach USD 3.1 billion by 2034. A major factor influencing this trajectory is the impact of tariffs imposed on Chinese imports, which have driven up procurement costs for critical components like optical sensors and microelectronics. These trade measures have prompted many defense suppliers to revise their sourcing strategies, turning to alternative vendors and increasing domestic manufacturing to manage costs and ensure continued program functionality.
Worldwide, armed forces are ramping up modernization efforts aimed at enhancing soldier performance, agility, and survivability on evolving battlefields. IVAS solutions play a central role in this shift, integrating advanced capabilities such as real-time navigation, communication, thermal imaging, and tactical awareness. Military organizations are adopting these systems to stay ahead of emerging threats, particularly as urban warfare becomes more prevalent and global conflicts intensify. The integration of wearable tech is helping to streamline decision-making and bolster command-and-control processes. Cross-functional defense programs are further driving demand for high-tech, multifunctional devices that meet the increasing complexity of modern combat scenarios.
| Market Scope | |
|---|---|
| Start Year | 2024 |
| Forecast Year | 2025-2034 |
| Start Value | $1.1 Billion |
| Forecast Value | $3.1 Billion |
| CAGR | 11.5% |
In terms of product types, the helmet-mounted display segment generated USD 493.6 million in 2023. These systems are gaining popularity due to their ability to deliver mission-critical data directly within a soldier's field of view, improving reaction time, mobility, and environmental awareness. Demand is on the rise as armed forces aim to optimize real-time tactical execution and situational command.
By technology, Augmented Reality is expected to hold a 38.1% share of the integrated visual augmentation system market in 2024. This technology enhances battlefield functionality by overlaying essential visual data in real-time, significantly improving navigation, threat identification, and operational coordination. Its role as a core enabling technology makes it vital for current and future military strategies focused on immersive, data-rich combat support systems.
United States Integrated Visual Augmentation System Market reached USD 324.8 million in 2024. The country's growth in this sector is being fueled by aggressive investments from both the defense and aerospace sectors. Continued emphasis on system upgrades and federal spending on modern military initiatives are intensifying the need for integrated visual augmentation capabilities, helping to reinforce mission readiness and overall operational efficiency.
Key players influencing the competitive landscape of the Global Integrated Visual Augmentation System Market include Varjo, L3Harris Technologies, Inc., and Elbit Systems Ltd. Leading players in the IVAS market are advancing their competitive edge through a combination of strategic investments, product innovation, and supply chain restructuring. In response to shifting import dynamics, companies have been diversifying vendor bases and boosting domestic component sourcing. Many are prioritizing R&D to enhance AR integration, optical performance, and system durability. These firms are aligning closely with military modernization goals by customizing solutions to meet battlefield-specific needs, including compact designs, seamless communication modules, and real-time data overlays. Forming strategic defense partnerships and participating in government-led technology initiatives are also key tactics being employed to expand market reach and secure long-term contracts.
Table of Contents
Chapter 1 Methodology & Scope
- 1.1 Market scope & definitions
- 1.2 Base estimates & calculations
- 1.3 Forecast calculations
- 1.4 Data sources
- 1.4.1 Primary
- 1.4.2 Secondary
- 1.4.2.1 Paid sources
- 1.4.2.2 Public sources
Chapter 2 Executive Summary
- 2.1 Industry synopsis, 2021-2034
Chapter 3 Industry Insights
- 3.1 Industry ecosystem analysis
- 3.1.1 Factor affecting the value chain
- 3.1.2 Profit margin analysis
- 3.1.3 Disruptions
- 3.1.4 Future outlook
- 3.1.5 Manufacturers
- 3.1.6 Distributors
- 3.2 Trump administration tariff analysis
- 3.2.1 Impact on trade
- 3.2.1.1 Trade volume disruptions
- 3.2.1.2 Retaliatory measures
- 3.2.2 Impact on the industry
- 3.2.2.1 Supply-side impact (raw materials)
- 3.2.2.1.1 Price volatility in key materials
- 3.2.2.1.2 Supply chain restructuring
- 3.2.2.1.3 Production cost implications
- 3.2.2.2 Demand-side impact (selling price)
- 3.2.2.2.1 Price transmission to end markets
- 3.2.2.2.2 Market share dynamics
- 3.2.2.2.3 Consumer response patterns
- 3.2.2.1 Supply-side impact (raw materials)
- 3.2.3 Key companies impacted
- 3.2.4 Strategic industry responses
- 3.2.4.1 Supply chain reconfiguration
- 3.2.4.2 Pricing and product strategies
- 3.2.4.3 Policy engagement
- 3.2.5 Outlook and future considerations
- 3.2.1 Impact on trade
- 3.3 Supplier landscape
- 3.4 Profit margin analysis
- 3.5 Key news & initiatives
- 3.6 Regulatory landscape
- 3.7 Impact forces
- 3.7.1 Growth drivers
- 3.7.1.1 Rising military modernization programs
- 3.7.1.2 Integration of Augmented Reality (AR) and AI
- 3.7.1.3 Demand for enhanced soldier safety and performance
- 3.7.1.4 Supportive government funding and contracts
- 3.7.1.5 Rising global security threats and asymmetric warfare
- 3.7.2 Industry pitfalls & challenges
- 3.7.2.1 High development and procurement costs
- 3.7.2.2 Operational and technical reliability issues
- 3.7.1 Growth drivers
- 3.8 Growth potential analysis
- 3.9 Porter's analysis
- 3.10 PESTEL analysis
Chapter 4 Competitive Landscape, 2024
- 4.1 Introduction
- 4.2 Company market share analysis
- 4.3 Competitive positioning matrix
- 4.4 Strategic outlook matrix
Chapter 5 Market Estimates & Forecast, By Product, 2021-2034 (USD Million & Thousand Unit)
- 5.1 Key trends
- 5.2 Helmet mounted display
- 5.3 Night vision device
Chapter 6 Market Estimates & Forecast, By Technology, 2021-2034 (USD Million & Thousand Unit)
- 6.1 Key trends
- 6.2 Augmented Reality (AR)
- 6.3 Mixed Reality (MR)
- 6.4 Virtual Reality (VR)
- 6.5 Thermal and low-light imaging
- 6.6 Others
Chapter 7 Market Estimates & Forecast, By Application, 2021-2034 (USD Million & Thousand Unit)
- 7.1 Key trends
- 7.2 Situational awareness
- 7.3 Navigation and mapping
- 7.4 Training and simulation
- 7.5 Target acquisition and engagement
- 7.6 Others
Chapter 8 Market Estimates & Forecast, By End Use, 2021-2034 (USD Million & Thousand Unit)
- 8.1 Key trends
- 8.2 Air force
- 8.3 Army
- 8.4 Navy
Chapter 9 Market Estimates & Forecast, By Region, 2021-2034 (USD Million & Thousand Unit)
- 9.1 Key trends
- 9.2 North America
- 9.2.1 U.S.
- 9.2.2 Canada
- 9.3 Europe
- 9.3.1 UK
- 9.3.2 Germany
- 9.3.3 France
- 9.3.4 Italy
- 9.3.5 Spain
- 9.3.6 Russia
- 9.4 Asia Pacific
- 9.4.1 China
- 9.4.2 India
- 9.4.3 Japan
- 9.4.4 South Korea
- 9.4.5 Australia
- 9.5 Latin America
- 9.5.1 Brazil
- 9.5.2 Mexico
- 9.6 MEA
- 9.6.1 South Africa
- 9.6.2 Saudi Arabia
- 9.6.3 UAE
Chapter 10 Company Profiles
- 10.1 Ajnalens
- 10.2 Anduril
- 10.3 Elbit Systems Ltd
- 10.4 L3Harris Technologies, Inc.
- 10.5 Lockheed Martin
- 10.6 Optex Systems
- 10.7 Varjo
- 10.8 VirTra, Inc.
- 10.9 Vrgineers, Inc.
- 10.10 Vuzix Corporation


