


 |
市場調查報告書
商品編碼
2037813
下一代免疫查核點抑制劑市場(第二版):按標靶免疫查核點、標靶疾病、分子類型、地區、主要參與者和治療方法的銷售預測-趨勢與預測至2035年Next Generation Immune Checkpoint Inhibitors Market (2nd Edition), by Target Immune Checkpoint, Target Disease Indication, Type of Molecule, Geographical Regions, Leading Players and Sales Forecast of Therapies - Trends and Forecast Till 2035 |
||||||
下一代免疫查核點抑制劑市場概述
預計到 2035 年,下一代免疫查核點抑制劑的全球市場規模將從今年的 175 億美元成長到 209 億美元。
下一代免疫查核點抑制劑市場—成長與趨勢
癌症仍然是全球主要的死亡原因之一,主要地區發病率的上升凸顯了開發更永續、更有效治療方法的迫切需求。儘管標靶治療、化療和放射線治療在某些臨床情況下改善了治療效果,但在許多腫瘤類型中,療效仍然有限或短暫。第一代免疫查核點抑制劑(ICIs),特別是那些針對CTLA-4和PD-1/PD-L1路徑的藥物,透過增強抗腫瘤免疫活性,徹底改變了癌症治療。然而,其療效存在個體差異,且治療抗藥性仍是臨床上面臨的重大挑戰。
為了克服這些局限性,人們對新一代免疫查核點抑制劑(NGICIs)的興趣日益濃厚。包括LAG-3、TIM-3、TIGIT、CD47、VISTA、CD38和Adenosine受體在內的新型標靶旨在進一步解決腫瘤微環境中的免疫逃脫機制,有望提高療效並擴大患者獲益。在強大的研發開發平臺、活性化的臨床試驗活動以及日益成長的策略性產業合作的支持下,這些創新技術正展現出強勁的商業性勢頭,並有望成為全球腫瘤免疫市場的主要驅動力。
成長促進因素-市場擴張的策略推動者
人們對最新免疫腫瘤療法的支持日益成長,主要源於傳統癌症治療的局限性以及全球癌症負擔的日益加重。傳統的治療方法,例如化療和放射線治療,常常面臨毒性、長期療效有限以及晚期疾病因腫瘤抗藥性而療效降低等挑戰。相較之下,免疫查核點抑制劑透過活化人體免疫系統,提供了一種更具標靶性和持久性的治療方法,從而改善臨床療效並減少全身副作用。
全球癌症發生率的上升進一步推動了這一轉變,預計到2025年,全球將新增約2000萬新患者,死亡人數將超過1000萬。日益加重的疾病負擔使得人們更需要有效的治療方法,免疫腫瘤療法因此成為關鍵的解決方案。憑藉卓越的臨床療效和在多種腫瘤類型中不斷擴大的核准,這些治療方法正持續顯著地推動市場應用和投資。
市場挑戰-阻礙進展的主要障礙
免疫查核點抑制劑市場在患者選擇和安全性方面仍面臨許多限制。其中一個主要挑戰是缺乏能夠準確預測患者療效的可靠且普遍認可的生物標記。因此,臨床試驗中會納入無應答者,導致時間和資源的低效利用。此外,單一標記方法的有效性也受到限制,因為治療效果受多種生物因素複雜相互作用的影響,包括腫瘤突變、免疫微環境、人類白血球抗原(HLA)譜、微生物組組成以及患者遺傳因素。
此外,免疫相關不利事件(irAEs)仍是重要的安全隱患。這是因為免疫活化增強可能導致意外的器官毒性,例如甲狀腺炎、結腸炎和肺炎。在嚴重的情況下,這些事件可能需要中斷治療或進行免疫抑制治療,從而影響臨床療效並可能導致醫療保健成本增加。總而言之,這些挑戰仍然阻礙新一代查核點抑制劑的廣泛應用和最佳使用。
下一代免疫查核點抑制劑市場—關鍵洞察
本報告詳細分析了下一代免疫查核點抑制劑市場的現狀,並指出了該行業的潛在成長機會。報告的主要發現包括:
- 為了克服對第一代治療方法的抗藥性並控制免疫相關不利事件,各公司正在積極開發下一代免疫查核點抑制劑產品線。
- 目前免疫查核點抑制劑的研發管線包括約 475 個治療項目,重點在於增強路徑調節,以在腫瘤學領域實現持續的治療效果。
- 45% 的免疫查核點抑制劑處於 II 期臨床試驗階段,這反映了該領域目前的成熟度,而這又受到了 ICI 在臨床開發早期階段取得的積極試驗結果的影響。
- 目前,下一代免疫查核點抑制劑的研發管線包含約 150 個治療項目,透過確保標靶藥物遞送和減少脫靶效應,為改善癌症治療做出貢獻。
- 超過 40% 的下一代免疫查核點抑制劑 (NGICI) 正在作為聯合治療(包括放射線治療、化療和標靶治療)進行評估,並且治療方法方向正在發生顯著變化,即改善抗腫瘤反應並提高臨床療效。
- 在過去兩年中,約 30% 的臨床試驗已招募了大部分受試者,而下一代免疫查核點抑制劑 (NGICI) 領域超過 50% 的臨床試驗是由各個製藥公司進行的,這凸顯了它們在該領域推動創新方面的積極作用。
- 由於全球癌症發生率不斷上升,以及由此產生的對複雜標靶治療方法的需求,下一代免疫查核點抑制劑市場正在經歷顯著成長。
- 鑑於免疫查核點抑制劑的快速普及,預計到2035年,該市場將以30%的複合年成長率成長(不包括達雷妥尤單抗)。目前,標靶CD38的治療方法佔了下一代免疫查核點抑制劑(NGICI)市場的大部分佔有率。
- 預計在預測期內,美國免疫查核點抑制劑市場將以穩定的複合年成長率成長,這主要得益於選擇性的提高以及在腫瘤疾病治療中臨床應用的擴展。
- 受臨床應用不斷擴展和免疫療法日益普及的推動,美國下一代免疫查核點抑制劑市場預計將持續成長。
下一代免疫查核點抑制劑市場
市場規模和機會分析是根據以下參數進行細分的:
標靶免疫查核點
- C CD38
- B7-H3
- TIGIT
- LAG-3
- CD73
按目標疾病
- 多發性骨髓瘤
- 肺癌
- 黑色素瘤
- 輕鏈類澱粉沉積症
- 免疫性血小板減少性疾病
- 攝護腺癌
- 食道癌
- 胰臟癌
依分子類型
- 生物製藥
- 低分子化合物
按地區
- 北美洲
- 北美洲
- 亞太地區
- 拉丁美洲
- 中東和北非
由主要公司
依治療方法預測銷售狀況
- 達爾扎雷克斯
- 薩爾克里薩
- ONO-4882
- Ifinatamab deruxtecan/MK-2400
- GSK5764227
- Mezagitamab(TAK-079)
- 菲安利單抗
- 化學反應劑
- 多巴那利單抗
下一代免疫查核點抑制劑市場—關鍵細分市場
目標區隔:市佔率分析
下一代免疫查核點抑制劑市場廣泛分佈於多個靶點,包括CD38、B7-H3、TIGIT、LAG-3和CD73。預計到2035年,CD38標靶將佔市場主導地位,市佔率超過50%。同時,B7-H3靶點預計將在預測期內實現最快成長。這一成長主要得益於B7-H3獨特的雙重功能。 B7-H3既能刺激免疫系統,也能抑制免疫系統,但臨床證據表明,其免疫抑製作用更為顯著,尤其是在膠質母細胞瘤。這些特性使得B7-H3成為目前及未來臨床開發中極具前景的標靶。
以分子類型分析-市場主導與成長趨勢
從分子類型來看,市場可分為生物製劑和小分子藥物。預計到2035年,生物製劑將佔約95%的市場佔有率,成為最大的市場佔有率,這主要得益於其靶向特異性高、給藥頻率低、脫靶效應發生率低等優勢,從而顯著提高了患者的依從性。同時,小分子藥物預計在預測期內將呈現較高的複合年成長率,這得益於其能夠同時調節多種抗腫瘤通路、口服生物生物有效性度高以及免疫抗原性低等優勢。這些因素有助於提高臨床應用的柔軟性,改善患者的用藥便利性,並增強商業性吸引力。
區域分析-成長與市場擴張
憑藉先進的醫療基礎設施、強大的研究能力以及促進廣泛臨床開發的完善法規結構,北美預計將繼續保持主要區域市場地位,到2035年將佔全球60%以上的市場佔有率。相比之下,亞太地區和世界其他地區預計將在預測期內實現最快成長。這一成長主要得益於癌症患者數量龐大且持續成長,尤其是在東南亞地區,以及日益加重的疾病負擔和快速發展的臨床研究生態系統。這些因素預計將顯著提升這些全部區域對下一代免疫查核點抑制劑療法的需求。
下一代免疫查核點抑制劑市場中的關鍵公司範例
- Arcus Biosciences
- Aurigene Oncology
- Genetech
- GlaxoSmithKline
- Johnson and Johnson
- Merck
- NovaBridge Biotherapeutics
- ONO Pharmaceuticals
- Regeneron Pharmaceuticals
- Sanofi
- Takeda
下一代免疫查核點抑制劑市場—研究範圍
- 市場規模和機會分析:本報告詳細分析了下一代免疫查核點抑制劑市場,重點關注關鍵市場細分,例如 [A] 靶向免疫查核點,[B] 靶向疾病,[C] 分子類型,[D] 地區,[E] 主要參與者,以及 [F]治療方法銷售預測。
- 免疫查核點抑制劑市場概覽:除了對免疫查核點抑制劑的整體市場趨勢進行詳細評估外,本報告還包括有關幾個相關參數的信息,例如 [A] 靶向免疫查核點,[B] 開發階段,[C]治療方法,[D] 給藥途徑,[E] 靶向疾病,[F] 治療領域,[G] 成立年份,[H] 公司規模,[E] 公司規模,[F] 治療領域,[G] 成立年份,[H] 公司規模,以及總部。
- 下一代免疫查核點抑制劑市場展望:除了對免疫查核點抑制劑的整體市場前景進行詳細評估外,本報告還提供了有關幾個相關參數的信息,包括[A]靶向免疫查核點,[B]開發階段,[C]治療方法,[D]給藥途徑,[E]靶向疾病,[F]治療領域,[G]成立年份,[H]公司規模,以及[I]總部規模。
- 目標競爭分析:基於各種相關參數,對下一代免疫檢查點標靶進行深入的競爭分析,例如 [A]治療方法數量,[B] 獨特適應症數量,[C] 研發管線成熟度,[D] 研發階段,[E] 臨床查核點數量,以及 [F] 參與的主要製藥公司和新創公司/中小企業數量。
- 臨床試驗分析:針對已完成和正在進行的下一代免疫查核點抑制劑療法的臨床試驗,分析內容包括:[A] 試驗註冊年份,[B]實驗狀況,[C] 試驗階段,[D] 入組患者人數,[E] 試驗設計,[F] 申辦方類型,[G]參與企業性別,[H] 最活躍的行業和非地理
- 公司簡介:詳細介紹總部位於北美、歐洲和亞太地區的領先公司。這些簡介基於多個參數,包括[A]成立年份、[B]總部所在地、[C]藥品組合、[D]近期發展和[E]未來展望。
- 市場影響分析:本部分詳細分析可能影響市場成長的因素,包括關鍵促進因素、潛在限制因素、新興機會和現有挑戰的識別與分析。
目錄
第1章:序言
第2章:調查方法
第3章 經濟及其他項目特定考量因素
第4章 宏觀經濟指標
第5章摘要整理
第6章:引言
- 章節概要
- 癌症免疫療法簡介
- 癌症免疫療法的基礎知識
- 免疫查核點抑制劑
- 第一代免疫查核點調節劑
- 下一代免疫查核點調節劑
- 免疫查核點抑制劑面臨的挑戰
- 前景
第7章 市場概覽:免疫查核點抑制劑
- 章節概要
- 免疫查核點抑制劑:市場概況
- 免疫查核點抑制劑:研發公司概覽
第8章 市場概況:新一代免疫查核點抑制劑
- 章節概要
- 下一代免疫查核點抑制劑:市場現狀
- 下一代免疫查核點抑制劑:研發公司的現狀
第9章 目標競爭力分析
- 章節概要
- 研究範圍和調查方法
- 關鍵參數
- 標靶競爭力分析:下一代免疫查核點抑制劑的關鍵標靶
第10章:臨床試驗分析
- 章節概要
- 研究範圍和調查方法
- 免疫查核點抑制劑:臨床試驗分析
第11章 公司簡介:下一代免疫查核點抑制劑研發公司
- 章節概要
- 由一家北美研發公司開發的免疫查核點抑制劑
- Arcus
- Genentech
- Johnson &Johnson
- Merck
- NovaBridge Biosciences
- Regeneron Pharmaceuticals
- 由一家歐洲研發公司開發的免疫查核點抑制劑
- GlaxoSmithKline
- Sanofi
- 由亞太地區研發公司開發的免疫療法查核點抑制劑
- Aurigene Oncology
- Ono Pharmaceutical
- Takeda Pharmaceutical
第12章 市場影響分析
- 章節概要
- 市場促進因素
- 市場限制
- 市場機遇
- 市場挑戰
- 結論
第13章:下一代免疫查核點抑制劑的全球市場
第14章:下一代免疫查核點抑制劑市場(按標靶免疫查核點分類)
第15章:下一代免疫查核點抑制劑市場(依標靶疾病分類)
第16章:下一代免疫查核點抑制劑市場(按分子類型分類)
第17章:下一代免疫查核點抑制劑市場(按地區分類)
第18章:下一代免疫查核點抑制劑市場:主要公司分析
第19章:下一代免疫查核點抑制劑市場-治療藥物銷售預測
- 章節概要
- 關鍵假設和調查方法
- 下一代免疫查核點抑制劑市場—治療銷售預測
- 數據三角測量與檢驗
第20章 結論
第21章:高階主管洞察
第22章附錄一:表格形式數據
第23章 附錄二:公司與組織列表
Next Generation Immune Checkpoint Inhibitors Market: Overview
As per Roots Analysis, the global next generation immune checkpoint inhibitors market is estimated to grow from USD 17.5 billion in the current year to USD 20.9 billion by 2035.
Next Generation Immune Checkpoint Inhibitors Market: Growth and Trends
Cancer remains a leading cause of mortality worldwide, and its increasing incidence across major geographies continues to underscore the urgent need for more durable and effective therapeutic solutions. While targeted therapies, chemotherapy, and radiation have delivered improved outcomes in certain clinical settings, many tumor types still exhibit limited or transient responses. First-generation immune checkpoint inhibitors (ICIs), particularly those targeting CTLA-4 and PD-1/PD-L1 pathways, have significantly transformed cancer treatment by enhancing antitumor immune activity; however, response rates remain inconsistent, and treatment resistance persists as a critical clinical challenge.
In response to these limitations, there is growing interest in next-generation immune checkpoint inhibitors (NGICIs). Novel targets, including LAG-3, TIM-3, TIGIT, CD47, VISTA, CD38, and adenosine receptors, are designed to address additional immune evasion mechanisms within the tumor microenvironment, thereby offering the potential for enhanced efficacy and expanded patient benefit. Backed by robust R&D pipelines, increasing clinical trial activity, and a rise in strategic industry collaborations, these innovations are driving significant commercial momentum and are expected to emerge as a key growth driver within the global immuno-oncology market.
Growth Drivers: Strategic Enablers of Market Expansion
The growing preference for modern immuno-oncology therapies is largely driven by the limitations of conventional cancer treatments and the rising global cancer burden. Traditional approaches such as chemotherapy and radiotherapy often face challenges related to toxicity, limited long-term efficacy, and reduced effectiveness in advanced disease due to tumor resistance. In contrast, immune checkpoint inhibitors offer a more targeted and durable treatment approach by activating the body's immune system, resulting in improved clinical outcomes and fewer systemic side effects.
This shift is further supported by the increasing incidence of cancer worldwide, with approximately 20 million new cases and over 10 million deaths reported in 2025. The expanding disease burden is intensifying the need for more effective therapies, positioning immuno-oncology treatments as a key solution. Backed by strong clinical performance and expanding approvals across multiple tumor types, these therapies continue to drive significant market adoption and investment.
Market Challenges: Critical Barriers Impeding Progress
The immune checkpoint inhibitor market continues to encounter notable constraints related to both patient selection and safety. A key challenge is the absence of robust and universally accepted biomarkers capable of accurately predicting patient response, resulting in the inclusion of non-responders in clinical trials and inefficient utilization of time and resources. Moreover, treatment efficacy is influenced by a complex interplay of biological factors, including tumor mutations, immune microenvironment, Human Leukocyte Antigen (HLA) profiles, microbiome composition, and patient genetics, limiting the effectiveness of single-marker approaches.
In addition, immune-related adverse events (irAEs) remain a significant safety concern, as enhanced immune activation can lead to unintended organ toxicities such as thyroiditis, colitis, and pneumonitis. In severe cases, these events may necessitate treatment interruption or immunosuppressive interventions, potentially impact clinical outcomes and increasing healthcare costs. Collectively, these challenges continue to pose barriers to broader adoption and optimal utilization of next-generation checkpoint inhibitors.
Next Generation Immune Checkpoint Inhibitors Market: Key Insights
The report delves into the current state of the next generation immune checkpoint inhibitors market and identifies potential growth opportunities within industry. Some key findings from the report include:
- Driven by the need for overcoming acquired resistance to first generation therapies, along with the necessity to manage immune-related adverse events, companies are actively advancing their next generation immune checkpoint inhibitor pipelines.
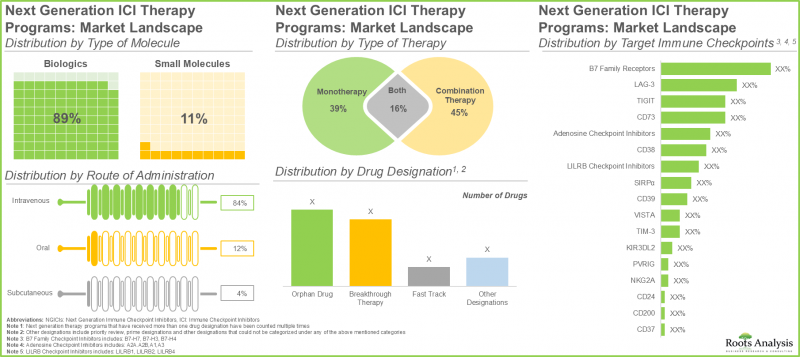
- The current immune checkpoint inhibitor pipeline features ~475 therapy programs, emphasizing on enhanced pathway modulation to deliver sustained therapeutic benefit in the oncology domain.
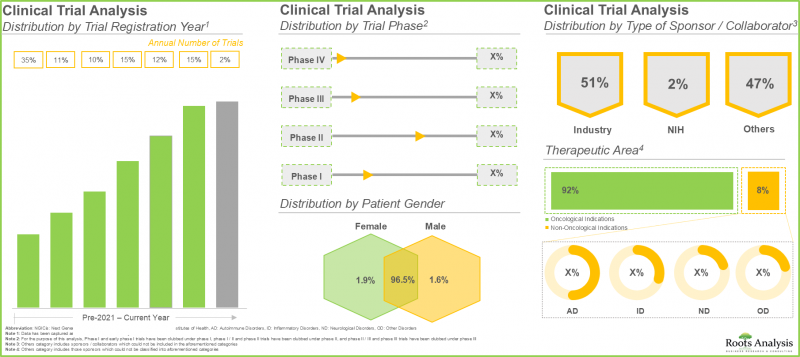
- 45% of the immune checkpoint inhibitors are in phase II of clinical trials, reflecting the maturity of the current pipeline, which is influenced by the positive study trial outcomes of ICIs in early stages of clinical development.
- The current next generation immune checkpoint inhibitor pipeline features ~150 therapy programs, facilitating enhanced cancer treatment by ensuring targeted drug delivery and reduced off target effects.
- >40% of NGICIs are being evaluated in combination therapy (including radiation, chemotherapy and targeted therapies), highlighting the shift toward regimens that improve antitumor response and enhance clinical outcomes.
- Majority of the trials (nearly 30%) were registered in the last two years; >50% of the clinical trials in NGICIs domain are being conducted by industry players, highlighting their active role in driving innovation in this segment.
- The next generation immune checkpoint inhibitors market is experiencing significant growth, owing to the rise in the incidence of cancer, worldwide, demanding advanced targeted treatment approaches.
- Given the rapid increase in popularity of immune checkpoint inhibitors, the market is poised to grow at a CAGR of 30% till 2035 (excluding Darzalex); CD38 targeting therapies currently capture majority of NGICIs market share.
- The immune checkpoint inhibitors market in the US is expected to grow at a steady CAGR during the forecast period due to their enhanced selectivity and expanding clinical use for the treatment of oncological disorders.
- Driven by expanding clinical use and growing adoption of immunotherapies, the next generation immune checkpoint inhibitors market in the US expected to witness sustained progress.
Next Generation Immune Checkpoint Inhibitors Market
The market sizing and opportunity analysis has been segmented across the following parameters:
By Target Immune Checkpoint
- C CD38
- B7-H3
- TIGIT
- LAG-3
- CD73
By Target Disease Indication
- Multiple Myeloma
- Lung Cancer
- Melanoma
- Light Chain Amyloidosis
- Immune Thrombocytopenia
- Prostate Cancer
- Esophageal Cancer
- Pancreatic Cancer
By Type of Molecule
- Biologics
- Small Molecules
By Geographical Regions
- North America
- Europe
- Asia-Pacific
- Latin America
- Middle East and North Africa
By Leading Players
- Leading Player 1
- Leading Player 2
- Leading Player 3
- Leading Player 4
- Leading Player 5
By Sales Forecast of Therapies
- Darzalex
- Sarclisa
- ONO-4882
- Ifinatamab Deruxtecan / MK-2400
- GSK5764227
- Mezagitamab (TAK-079)
- Fianlimab
- Quemliclustat
- Domvanalimab
Next Generation Immune Checkpoint Inhibitors Market: Key Segments
Target-Based Segmentation: Market Share Insights
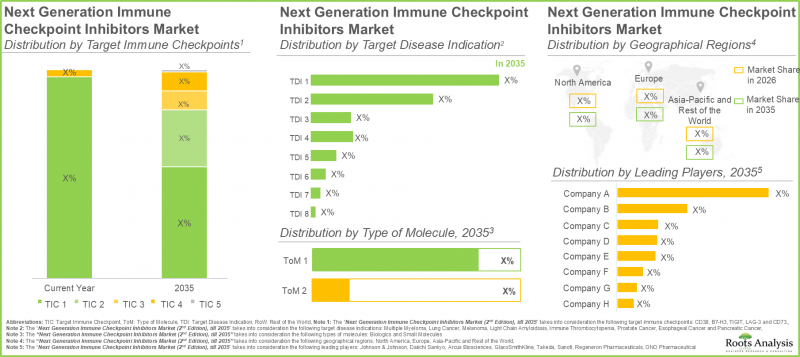
The next-generation immune checkpoint inhibitors market is broadly distributed across multiple targets, including CD38, B7-H3, TIGIT, LAG-3, and CD73. By 2035, the CD38 segment is expected to dominate the market, accounting for over 50% of the overall share. Meanwhile, the B7-H3 segment is projected to register the fastest growth during the forecast period. This growth is driven by the unique dual functionality of B7-H3, which can exert both stimulatory and immunosuppressive effects on the immune system, with clinical evidence indicating a predominance of immunosuppressive activity, particularly in glioblastoma. These attributes position B7-H3 as a highly promising target for ongoing and future clinical development.
Type of Molecule Analysis: Market Leadership and Growth Trends
Based on the type of molecule, the market is segmented into biologics and small molecules. Biologics are anticipated to capture the largest share, accounting for nearly 95% of the market by 2035, primarily due to their high target specificity, reduced dosing frequency, and lower incidence of off-target effects, which collectively enhance patient compliance. Conversely, small molecules are expected to witness a higher CAGR over the forecast period, supported by their ability to modulate multiple anti-tumor pathways simultaneously, along with advantages such as oral bioavailability and low immunogenicity. These factors contribute to greater clinical flexibility, improved patient convenience, and increasing commercial attractiveness.
Regional Analysis: Growth and Market Expansion
North America is projected to remain the dominant regional market, capturing over 60% of the global share by 2035, supported by its advanced healthcare infrastructure, strong research capabilities, and well-established regulatory framework that facilitates extensive clinical development. In contrast, Asia-Pacific and the Rest of the World are expected to experience the fastest growth during the forecast period. This growth is driven by a large and expanding cancer patient population, particularly in Southeast Asia, coupled with a rising disease burden and a rapidly evolving clinical research ecosystem. These factors are anticipated to significantly increase the demand for next-generation immune checkpoint inhibitor therapies across these regions.
Example Players in Next Generation Immune Checkpoint Inhibitors Market
- Arcus Biosciences
- Aurigene Oncology
- Genetech
- GlaxoSmithKline
- Johnson and Johnson
- Merck
- NovaBridge Biotherapeutics
- ONO Pharmaceuticals
- Regeneron Pharmaceuticals
- Sanofi
- Takeda
Next Generation Immune Checkpoint Inhibitors Market: Research Coverage
- Market Sizing and Opportunity Analysis: The report features an in-depth analysis of the next generation immune checkpoint inhibitors market, focusing on key market segments, including [A] target immune checkpoint, [B] target disease indication, [C] type of molecule [D] geographical regions, [E] leading players, [F] and sales forecast of therapies.
- Immune Checkpoint Inhibitors Market Landscape: A detailed assessment of the overall landscape of immune checkpoint inhibitors, along with information on several relevant parameters, such as [A] target immune checkpoint, [B] stage of development, [C] therapeutic modality, [D] route of administration, [E] target disease indication, [F] therapeutic area, [G] year of establishment, [H] company size and [I] location of headquarters.
- Next Generation Immune Checkpoint Inhibitors Market Landscape: A detailed assessment of the overall landscape of immune checkpoint inhibitors market landscape, along with information on several relevant parameters, such as [A] target immune checkpoint, [B] stage of development, [C] therapeutic modality, [D] route of administration, [E] target disease indication, [F] therapeutic area, [G] year of establishment, [H] company size and [I] location of headquarters.
- Target Competitiveness Analysis: An insightful competitiveness analysis of next generation immune checkpoint targets, based on various relevant parameters, such as [A] number of therapies, [B] number of unique target indications, [C] pipeline maturity, [D] highest phase of development, [E] number of clinical trials, [F] number of unique big pharma and start-ups / small sized companies involved.
- Clinical Trial Analysis: An in-depth analysis of completed and ongoing clinical trials investigating next generation immune checkpoint inhibitor therapies, based on several relevant parameters, such as [A] trial registration year, [B] trial status, [C] trial phase, [D] patients enrolled, [E] trial study design, [F] type of sponsor, [G] patient gender, [H] most active industry and non-industry players (in terms of number of trials) and [I] geographical distribution.
- Company Profiles: In-depth profiles of key companies based in North America, Europe and Asia-Pacific based on several parameters such as [A] year of establishment, [B] location of headquarters, [C] drug portfolio, [D] recent developments and [E] an informed future outlook.
- Market Impact Analysis: An in-depth analysis of the factors that can impact the growth of the market. It also features identification and analysis of key drivers, potential restraints, emerging opportunities, and existing challenges in this domain.
Key Questions Answered in this Report
- Which are the leading companies in the next generation immune checkpoint market?
- Which region dominates the next generation immune checkpoint market?
- What are the key trends observed in the next generation immune checkpoint market?
- What factors are likely to influence the evolution of this market?
- What are the primary challenges faced by next generation immune checkpoint developers?
- What is the current and future market size?
- What is the CAGR of this market?
- How is the current and future market opportunity likely to be distributed across key market segments?
Reasons to Buy this Report
- The report provides a comprehensive market analysis, offering detailed revenue projections of the overall market and its specific sub-segments. This information is valuable to both established market leaders and emerging entrants.
- The report offers stakeholders a comprehensive overview of the market, including key drivers, barriers, opportunities, and challenges. This information empowers stakeholders to stay abreast of market trends and make data-driven decisions to capitalize on growth prospects.
- The report can aid businesses in identifying future opportunities in any sector. It also helps in understanding if those opportunities are worth pursuing.
- The report helps in identifying customer demand by understanding the needs, preferences, and behavior of the target audience in order to tailor products or services effectively.
- The report equips new entrants with requisite information regarding a particular market to help them build successful business strategies.
- The report allows for more effective communication with the audience and in building strong business relations.
Additional Benefits
- Complementary PPT Insights Pack
- Complimentary Excel Data Packs for all Analytical Modules in the Report
- 15% Free Content Customization
- Detailed Report Walkthrough Session with Research Team
- Free Updated report if the report is 6-12 months old or older
TABLE OF CONTENTS
1. PREFACE
- 1.1. Introduction
- 1.2. Market Share Insights
- 1.3. Key Market Insights
- 1.4. Report Coverage
- 1.5. Key Questions Answered
- 1.6. Chapter Outlines
2. RESEARCH METHODOLOGY
- 2.1. Chapter Overview
- 2.2. Research Assumptions
- 2.2.1. Market Landscape and Market Trends
- 2.2.2. Market Forecast and Opportunity Analysis
- 2.2.3. Comparative Analysis
- 2.3. Database Building
- 2.3.1. Data Collection
- 2.3.2. Data Validation
- 2.3.3. Data Analysis
- 2.4. Project Methodology
- 2.4.1. Secondary Research
- 2.4.1.1. Annual Reports
- 2.4.1.2. Academic Research Papers
- 2.4.1.3. Company Websites
- 2.4.1.4. Investor Presentations
- 2.4.1.5. Regulatory Filings
- 2.4.1.6. White Papers
- 2.4.1.7. Industry Publications
- 2.4.1.8. Conferences and Seminars
- 2.4.1.9. Government Portals
- 2.4.1.10. Media and Press Releases
- 2.4.1.11. Newsletters
- 2.4.1.12. Industry Databases
- 2.4.1.13. Roots Proprietary Databases
- 2.4.1.14. Paid Databases and Sources
- 2.4.1.15. Social Media Portals
- 2.4.1.16. Other Secondary Sources
- 2.4.2. Primary Research
- 2.4.2.1. Types of Primary Research
- 2.4.2.1.1. Qualitative Research
- 2.4.2.1.2. Quantitative Research
- 2.4.2.1.3. Hybrid Approach
- 2.4.2.2. Advantages of Primary Research
- 2.4.2.3. Techniques for Primary Research
- 2.4.2.3.1. Interviews
- 2.4.2.3.2. Surveys
- 2.4.2.3.3. Focus Groups
- 2.4.2.3.4. Observational Research
- 2.4.2.3.5. Social Media Interactions
- 2.4.2.4. Key Opinion Leaders Considered in Primary Research
- 2.4.2.4.1. Company Executives (CXOs)
- 2.4.2.4.2. Board of Directors
- 2.4.2.4.3. Company Presidents and Vice Presidents
- 2.4.2.4.4. Research and Development Heads
- 2.4.2.4.5. Technical Experts
- 2.4.2.4.6. Subject Matter Experts
- 2.4.2.4.7. Scientists
- 2.4.2.4.8. Doctors and Other Healthcare Developers
- 2.4.2.5. Ethics and Integrity
- 2.4.2.5.1. Research Ethics
- 2.4.2.5.2. Data Integrity
- 2.4.2.1. Types of Primary Research
- 2.4.3. Analytical Tools and Databases
- 2.4.1. Secondary Research
- 2.5. Robust Quality Control
3. ECONOMIC AND OTHER PROJECT-SPECIFIC CONSIDERATIONS
- 3.1. Chapter Overview
- 3.2. Forecast Methodology
- 3.2.1. Top-down Approach
- 3.2.2. Bottom-up Approach
- 3.2.3. Hybrid Approach
- 3.3. Market Assessment Framework
- 3.3.1. Total Addressable Market (TAM)
- 3.3.2. Serviceable Addressable Market (SAM)
- 3.3.3. Serviceable Obtainable Market (SOM)
- 3.3.4. Currently Acquired Market (CAM)
- 3.4. Forecasting Tools and Techniques
- 3.4.1. Qualitative Forecasting
- 3.4.2. Correlation
- 3.4.3. Regression
- 3.4.4. Extrapolation
- 3.4.5. Convergence
- 3.4.6. Sensitivity Analysis
- 3.4.7. Scenario Planning
- 3.4.8. Data Visualization
- 3.4.9. Time Series Analysis
- 3.4.10. Forecast Error Analysis
- 3.5. Key Considerations
- 3.5.1. Demographics
- 3.5.2. Government Regulations
- 3.5.3. Reimbursement Scenarios
- 3.5.4. Market Access
- 3.5.5. Supply Chain
- 3.5.6. Industry Consolidation
- 3.5.7. Pandemic / Unforeseen Disruptions Impact
- 3.6. Limitations
4. MACRO-ECONOMIC INDICATORS
- 4.1. Chapter Overview
- 4.2. Market Dynamics
- 4.2.1. Time Period
- 4.2.1.1. Historical Trends
- 4.2.1.2. Current and Forecasted Estimates
- 4.2.2. Currency Coverage
- 4.2.2.1. Major Currencies Affecting the Market
- 4.2.2.2. Factors Affecting Currency Fluctuations
- 4.2.2.3. Impact of Currency Fluctuations on the Industry
- 4.2.3. Foreign Currency Exchange Rate
- 4.2.3.1. Impact of Foreign Exchange Rate Volatility on the Market
- 4.2.3.2. Strategies for Mitigating Foreign Exchange Risk
- 4.2.4. Recession
- 4.2.4.1. Assessment of Current Economic Conditions and Potential Impact on the Market
- 4.2.4.2. Historical Analysis of Past Recessions and Lessons Learnt
- 4.2.5. Inflation
- 4.2.5.1. Measurement and Analysis of Inflationary Pressures in the Economy
- 4.2.5.2. Potential Impact of Inflation on the Market Evolution
- 4.2.6. Interest Rates
- 4.2.6.1. Interest Rates and Their Impact on the Market
- 4.2.6.2. Strategies for Managing Interest Rate Risk
- 4.2.7. Commodity Flow Analysis
- 4.2.7.1. Type of Commodity
- 4.2.7.2. Origins and Destinations
- 4.2.7.3. Value and Weights
- 4.2.7.4. Modes of Transportation
- 4.2.8. Global Trade Dynamics
- 4.2.8.1. Import Scenario
- 4.2.8.2. Export Scenario
- 4.2.8.3. Trade Policies
- 4.2.8.4. Strategies for Mitigating the Risks Associated with Trade Barriers
- 4.2.8.5. Impact of Trade Barriers on the Market
- 4.2.9. War Impact Analysis
- 4.2.9.1. Russian-Ukraine War
- 4.2.9.2. Israel-Hamas War
- 4.2.10. COVID Impact / Related Factors
- 4.2.10.1. Global Economic Impact
- 4.2.10.2. Industry-specific Impact
- 4.2.10.3. Government Response and Stimulus Measures
- 4.2.10.4. Future Outlook and Adaptation Strategies
- 4.2.11. Other Indicators
- 4.2.11.1. Fiscal Policy
- 4.2.11.2. Consumer Spending
- 4.2.11.3. Gross Domestic Product (GDP)
- 4.2.11.4. Employment
- 4.2.11.5. Taxes
- 4.2.11.6. Stock Market Performance
- 4.2.11.7. Cross-Border Dynamics
- 4.2.1. Time Period
- 4.3. Conclusion
5. EXECUTIVE SUMMARY
- 5.1. Immune Checkpoint Inhibitors: Market Landscape
- 5.2. Immune Checkpoint Inhibitors: Market Trends
- 5.3. Immune Checkpoint Inhibitors: Market Forecast and Opportunity Analysis
6. INTRODUCTION
- 6.1. Chapter Overview
- 6.2. Introduction to Cancer Immunotherapy
- 6.3. Fundamentals of Cancer Immunotherapy
- 6.4. Immune Checkpoint Inhibitors
- 6.5. First Generation Immune Checkpoint Modulators
- 6.6. Next Generation Immune Checkpoint Modulators
- 6.6.1. Types of Next Generation Modulators
- 6.7. Challenges Related to Immune Checkpoint Inhibitors
- 6.8. Future Perspective
7. MARKET LANDSCAPE: IMMUNE CHECKPOINT INHIBITORS
- 7.1. Chapter Overview
- 7.2. Immune Checkpoint Inhibitors: Overall Market Landscape
- 7.2.1. Analysis by Stage of Development
- 7.2.2. Analysis by Target Immune Checkpoint
- 7.2.3. Analysis by Therapeutic Modality
- 7.2.4. Analysis by Route of Administration
- 7.2.5. Analysis by Target Disease Indication
- 7.2.6. Analysis by Therapeutic Area
- 7.2.7. Analysis by Popular Oncological Indications and Target Immune Checkpoints
- 7.2.8. Analysis by Popular Non-Oncological Indications and Target Immune Checkpoints
- 7.3. Immune Checkpoint Inhibitors: Developer Landscape
- 7.3.1. Analysis by Year of Establishment
- 7.3.2. Analysis by Company Size
- 7.3.3. Analysis by Location of Headquarters
- 7.3.4. Analysis by Company Size and Location of Headquarters
- 7.3.5. Most Active Players: Analysis by Number of Immune Checkpoint Inhibitors Developed
- 7.3.6. Prominent First Generation Targets: Distribution by Number of Developers
8. MARKET LANDSCAPE: NEXT GENERATION IMMUNE CHECKPOINT INHIBITORS
- 8.1. Chapter Overview
- 8.2. Next Generation Immune Checkpoint Inhibitors: Overall Market Landscape
- 8.2.1. Analysis by Stage of Development
- 8.2.2. Analysis by Target Immune Checkpoint
- 8.2.3. Analysis by Therapeutic Modality
- 8.2.4. Analysis by Route of Administration
- 8.2.5. Analysis by Target Disease Indication
- 8.2.6. Analysis by Therapeutic Area
- 8.2.7. Analysis by Popular Oncological Indications and Popular Target Immune Checkpoint
- 8.2.8. Analysis by Popular Non-Oncological Indications and Target Immune Checkpoint
- 8.3. Next Generation Immune Checkpoint Inhibitors: Developer Landscape
- 8.3.1. Analysis by Year of Establishment
- 8.3.2. Analysis by Company Size
- 8.3.3. Analysis by Location of Headquarters
- 8.3.4. Analysis by Company Size and Location of Headquarters
- 8.3.5. Most Active Players: Analysis by Number of Immune Checkpoint Inhibitors Developed
- 8.3.6. Prominent Next Generation Targets: Distribution by Number of Developers
9. TARGET COMPETITIVENESS ANALYSIS
- 9.1. Chapter Overview
- 9.2. Scope and Methodology
- 9.3. Key Parameters
- 9.4. Target Competitiveness Analysis: Key Targets for Next Generation Immune Checkpoint Inhibitors
- 9.4.1. Target Competitiveness Analysis: 3D Bubble Analysis
- 9.4.2. Target Competitiveness Analysis: Spider Web Analysis
10. CLINICAL TRIAL ANALYSIS
- 10.1. Chapter Overview
- 10.2. Scope and Methodology
- 10.3. Immune Checkpoint Inhibitors: Clinical Trial Analysis
- 10.3.1. Analysis by Trial Registration Year
- 10.3.2. Analysis by Trial Status
- 10.3.3. Analysis by Trial Registration Year and Trial Status
- 10.3.4. Analysis by Trial Registration Year and Patients Enrolled
- 10.3.5. Analysis by Trial Status and Patients Enrolled
- 10.3.6. Analysis by Trial Phase
- 10.3.7. Analysis by Patients Enrolled and Trial Phase
- 10.3.8. Analysis by Study Design
- 10.3.9. Analysis by Type of Sponsor
- 10.3.10. Analysis by Patient Gender
- 10.3.11. Most Active Industry Players: Analysis by Number of Trials
- 10.3.12. Most Active Non-Industry Players: Analysis by Number of Trials
- 10.3.13. Analysis by Geography
- 10.3.13.1. Analysis by Trial Status, Trial Phase and Geography
- 10.3.13.2. Analysis by Trial Status and Geography
- 10.3.14. Geographical Distribution of Trials and Number of Patients Enrolled
11. COMPANY PROFILES: NEXT GENERATION IMMUNE CHECKPOINT INHIBITOR DEVELOPERS
- 11.1. Chapter Overview
- 11.2. Immune Checkpoint Inhibitors Offered by Drug Developers Based in North America
- 11.2.1. Arcus
- 11.2.1.1. Company Overview
- 11.2.1.2. Next Generation Immune Checkpoint Therapeutics Portfolio
- 11.2.1.2.1. Domvanalimab
- 11.2.1.2.2. Quemliclustat
- 11.2.1.3. Recent Developments and Future Outlook
- 11.2.2. Genentech
- 11.2.2.1. Company Overview
- 11.2.2.2. Next Generation Immune Checkpoint Therapeutics Portfolio
- 11.2.2.2.1. Tiragolumab
- 11.2.2.3. Recent Developments and Future Outlook
- 11.2.3. Johnson & Johnson
- 11.2.3.1. Company Overview
- 11.2.3.2. Next Generation Immune Checkpoint Therapeutics Portfolio
- 11.2.3.2.1. Daratumumab
- 11.2.3.3. Recent Developments and Future Outlook
- 11.2.4. Merck
- 11.2.4.1. Company Overview
- 11.2.4.2. Next Generation Immune Checkpoint Therapeutics Portfolio
- 11.2.4.2.1. Ifinatamab Deruxtecan
- 11.2.4.3. Recent Developments and Future Outlook
- 11.2.5. NovaBridge Biosciences
- 11.2.5.1. Company Overview
- 11.2.5.2. Next Generation Immune Checkpoint Therapeutics Portfolio
- 11.2.5.2.1. Uliledlimab
- 11.2.5.3. Recent Developments and Future Outlook
- 11.2.6. Regeneron Pharmaceuticals
- 11.2.6.1. Company Overview
- 11.2.6.2. Next Generation Immune Checkpoint Therapeutics Portfolio
- 11.2.6.2.1. FIANLIMAB
- 11.2.6.3. Recent Developments and Future Outlook
- 11.2.1. Arcus
- 11.3. Immune Checkpoint Inhibitors Offered by Drug Developers Based in Europe
- 11.3.1. GlaxoSmithKline
- 11.3.1.1. Company Overview
- 11.3.1.2. Next Generation Immune Checkpoint Therapeutics Portfolio
- 11.3.1.2.1. GSK5764227
- 11.3.1.2.2. GSK5733584
- 11.3.1.3. Recent Developments and Future Outlook
- 11.3.2. Sanofi
- 11.3.2.1. Company Overview
- 11.3.2.2. Next Generation Immune Checkpoint Therapeutics Portfolio
- 11.3.2.2.1. Sarclisa
- 11.3.2.3. Recent Developments and Future Outlook
- 11.3.1. GlaxoSmithKline
- 11.4. Immune Checkpoint Inhibitors Offered by Drug Developers Based in Asia-Pacific
- 11.4.1. Aurigene Oncology
- 11.4.1.1. Company Overview
- 11.4.1.2. Next Generation Immune Checkpoint Therapeutics Portfolio
- 11.4.1.2.1. Cenopodlin
- 11.4.1.3. Recent Developments and Future Outlook
- 11.4.2. Ono Pharmaceutical
- 11.4.2.1. Company Overview
- 11.4.2.2. Next Generation Immune Checkpoint Therapeutics Portfolio
- 11.4.2.2.1. ONO-4482
- 11.4.2.3. Recent Developments and Future Outlook
- 11.4.3. Takeda Pharmaceutical
- 11.4.3.1. Company Overview
- 11.4.3.2. Next Generation Immune Checkpoint Therapeutics Portfolio
- 11.4.3.2.1. Mezagitamab
- 11.4.3.3. Recent Developments and Future Outlook
- 11.4.1. Aurigene Oncology
12. MARKET IMPACT ANALYSIS
- 12.1. Chapter Overview
- 12.2. Market Drivers
- 12.3. Market Restraints
- 12.4. Market Opportunities
- 12.5. Market Challenges
- 12.6. Conclusion
13. GLOBAL NEXT GENERATION IMMUNE CHECKPOINT INHIBITORS MARKET
- 13.1. Chapter Overview
- 13.2. Key Assumptions and Methodology
- 13.3. Global Next Generation Immune Checkpoint Inhibitors Market, Historical Trends (Since 2022) and Forecasted Estimates (Till 2035)
- 13.4. Multivariate Scenario Analysis
- 13.4.1. Conservative Scenario
- 13.4.2. Optimistic Scenario
- 13.5. Key Market Segmentations
14. NEXT GENERATION IMMUNE CHECKPOINT INHIBITORS MARKET, BY TARGET IMMUNE CHECKPOINT
- 14.1. Chapter Overview
- 14.2. Key Assumptions and Methodology
- 14.3. Next Generation Immune Checkpoint Inhibitors Market: Distribution by Target Immune Checkpoint
- 14.3.1. Next Generation Immune Checkpoint Inhibitors Market for CD38, Historical Trends (Since 2022) and Forecasted Estimates (Till 2035)
- 14.3.2. Next Generation Immune Checkpoint Inhibitors Market for B7-H3, Forecasted Estimates (till 2035)
- 14.3.3. Next Generation Immune Checkpoint Inhibitors Market for TIGIT, Forecasted Estimates (till 2035)
- 14.3.4. Next Generation Immune Checkpoint Inhibitors Market for LAG-3, Historical Trends (Since 2022) and Forecasted Estimates (Till 2035)
- 14.3.5. Next Generation Immune Checkpoint Inhibitors Market for CD73, Forecasted Estimates (till 2035)
- 14.4. Data Triangulation and Validation
15. NEXT GENERATION IMMUNE CHECKPOINT INHIBITORS MARKET, BY TARGET DISEASE INDICATIONS
- 15.1. Chapter Overview
- 15.2. Key Assumptions and Methodology
- 15.3. Next Generation Immune Checkpoint Inhibitors Market: Distribution by Target Disease Indications
- 15.3.1. Next Generation Immune Checkpoint Inhibitors Market for Multiple Myeloma, Historical Trends (Since 2022) and Forecasted Estimates (Till 2035)
- 15.3.2. Next Generation Immune Checkpoint Inhibitors Market for Lung Cancer, Forecasted Estimates (Till 2035)
- 15.3.3. Next Generation Immune Checkpoint Inhibitors Market for Immune Thrombocytopenia, Forecasted Estimates (Till 2035)
- 15.3.4. Next Generation Immune Checkpoint Inhibitors Market for Melanoma, Historical Trends (Since 2022) and Forecasted Estimates (Till 2035)
- 15.3.4. Next Generation Immune Checkpoint Inhibitors Market for Prostate Cancer, Forecasted Estimates (Till 2035)
- 15.3.6. Next Generation Immune Checkpoint Inhibitors Market for Esophageal Cancer, Forecasted Estimates (Till 2035)
- 15.3.7. Next Generation Immune Checkpoint Inhibitors Market for Light Chain Amyloidosis, Historical Trends (Since 2022) and Forecasted Estimates (Till 2035)
- 15.3.8. Next Generation Immune Checkpoint Inhibitors Market for Pancreatic Cancer, Forecasted Estimates (Till 2035)
- 15.4. Data Triangulation and Validation
16. NEXT GENERATION IMMUNE CHECKPOINT INHIBITORS MARKET, BY TYPE OF MOLECULE
- 16.1. Chapter Overview
- 16.2. Key Assumptions and Methodology
- 16.3. Next Generation Immune Checkpoint Inhibitors Market: Distribution by Type of Molecule
- 16.3.1. Next Generation Immune Checkpoint Inhibitors Market for Biologics, Historical Trends (Since 2022) and Forecasted Estimates (Till 2035)
- 16.3.2. Next Generation Immune Checkpoint Inhibitors Market for Small Molecules, Historical Trends (Since 2022) and Forecasted Estimates (Till 2035)
- 16.4. Data Triangulation and Validation
17. NEXT GENERATION IMMUNE CHECKPOINT INHIBITORS MARKET, BY GEOGRAPHICAL REGIONS
- 17.1. Chapter Overview
- 17.2. Assumptions and Methodology
- 17.3. Next Generation Immune Checkpoint Inhibitors Market: Distribution by Geographical Regions
- 17.3.1. Next Generation Immune Checkpoint Inhibitors Market in North America, Historical Trends (Since 2022) and Forecasted Estimates (Till 2035)
- 17.3.1.1. Next Generation Immune Checkpoint Inhibitors Market in the US, Historical Trends (Since 2022) and Forecasted Estimates (Till 2035)
- 17.3.1.2. Next Generation Immune Checkpoint Inhibitors Market in Canada, Historical Trends (Since 2022) and Forecasted Estimates (Till 2035)
- 17.3.2. Next Generation Immune Checkpoint Inhibitors Market in Europe, Historical Trends (Since 2022) and Forecasted Estimates (Till 2035)
- 17.3.2.1. Next Generation Immune Checkpoint Inhibitors Market in EU5, Historical Trends (Since 2022) and Forecasted Estimates (Till 2035)
- 17.3.2.2. Next Generation Immune Checkpoint Inhibitors Market in the Rest of Europe, Historical Trends (Since 2022) and Forecasted Estimates (Till 2035)
- 17.3.3. Next Generation Immune Checkpoint Inhibitors Market in Asia-Pacific and Rest of the World, Historical Trends (Since 2022) and Forecasted Estimates (Till 2035)
- 17.3.3.1. Next Generation Immune Checkpoint Inhibitors Market in China, Historical Trends (Since 2022) and Forecasted Estimates (Till 2035)
- 17.3.3.2. Next Generation Immune Checkpoint Inhibitors Market in Japan, Historical Trends (Since 2022) and Forecasted Estimates (Till 2035)
- 17.3.3.3. Next Generation Immune Checkpoint Inhibitors Market in Brazil, Historical Trends (Since 2022) and Forecasted Estimates (Till 2035)
- 17.3.3.4. Next Generation Immune Checkpoint Inhibitors Market in Australia, Historical Trends (Since 2022) and Forecasted Estimates (Till 2035)
- 17.3.3.5. Next Generation Immune Checkpoint Inhibitors Market in South Korea, Historical Trends (Since 2022) and Forecasted Estimates (Till 2035)
- 17.3.3.6. Next Generation Immune Checkpoint Inhibitors Market in India, Historical Trends (Since 2022) and Forecasted Estimates (Till 2035)
- 17.3.3.7. Next Generation Immune Checkpoint Inhibitors Market in Argentina, Historical Trends (Since 2022) and Forecasted Estimates (Till 2035)
- 17.3.3.8. Next Generation Immune Checkpoint Inhibitors Market in Israel, Historical Trends (Since 2022) and Forecasted Estimates (Till 2035)
- 17.3.3.9. Next Generation Immune Checkpoint Inhibitors Market in Saudi Arabia, Historical Trends (Since 2022) and Forecasted Estimates (Till 2035)
- 17.3.1. Next Generation Immune Checkpoint Inhibitors Market in North America, Historical Trends (Since 2022) and Forecasted Estimates (Till 2035)
- 17.4. Data Triangulation and Validation
18. NEXT GENERATION IMMUNE CHECKPOINT INHIBITORS MARKET, BY LEADING PLAYERS
- 18.1. Chapter Overview
- 18.2. Key Assumptions and Methodology
- 18.3. Next Generation Immune Checkpoint Inhibitors Market: Distribution by Leading Players
- 18.3.1. Next Generation Immune Checkpoint Inhibitors Market for Arcus Biosciences, Historical Trends (Since 2022) and Forecasted Estimates (Till 2035)
- 18.3.2. Next Generation Immune Checkpoint Inhibitors Market for Daiichi Sankyo, Historical Trends (Since 2022) and Forecasted Estimates (Till 2035)
- 18.3.3. Next Generation Immune Checkpoint Inhibitors Market for GlaxoSmithKline, Historical Trends (Since 2022) and Forecasted Estimates (Till 2035)
- 18.3.4. Next Generation Immune Checkpoint Inhibitors Market for Johnson and Johnson, Historical Trends (Since 2022) and Forecasted Estimates (Till 2035)
- 18.3.5. Next Generation Immune Checkpoint Inhibitors Market for ONO Pharmaceuticals, Historical Trends (Since 2022) and Forecasted Estimates (Till 2035)
- 18.3.6. Next Generation Immune Checkpoint Inhibitors Market for Regeneron Pharmaceuticals, Historical Trends (Since 2022) and Forecasted Estimates (Till 2035)
- 18.3.7. Next Generation Immune Checkpoint Inhibitors Market for Sanofi, Historical Trends (Since 2022) and Forecasted Estimates (Till 2035)
- 18.3.8. Next Generation Immune Checkpoint Inhibitors Market for Takeda, Historical Trends (Since 2022) and Forecasted Estimates (Till 2035)
- 18.4. Data Triangulation and Validation
19. NEXT GENERATION IMMUNE CHECKPOINT INHIBITORS MARKET: SALES FORECAST OF THERAPIES
- 19.1. Chapter Overview
- 19.2. Key Assumptions and Methodology
- 19.3. Next Generation Immune Checkpoint Inhibitors Market: Sales Forecast of Therapies
- 19.3.1. Darzalex: Sales Forecast (USD Million)
- 19.3.2. Sarclisa: Sales Forecast (USD Million)
- 19.3.3. ONO-4482: Sales Forecast (USD Million)
- 19.3.4. Ifinatamab Deruxtecan / MK-2400: Sales Forecast (USD Million)
- 19.3.5. GSK5764227: Sales Forecast (USD Million)
- 19.3.6. Mezagitamab (TAK-079): Sales Forecast (USD Million)
- 19.3.7. Fianlimab: Sales Forecast (USD Million)
- 19.3.8. Quemliclustat: Sales Forecast (USD Million)
- 19.3.9. Domvanalimab: Sales Forecast (USD Million)
- 19.4. Data Triangulation and Validation
20. CONCLUDING REMARKS
21. EXECUTIVE INSIGHTS
- 21.1. Chapter Overview
- 21.2. Percheron Therapeutics
- 21.2.1 Company Snapshot
- 21.2.2. Interview Transcript: James Garner (Chief Executive Officer)
- 21.3. Merck
- 21.3.1 Company Snapshot
- 21.3.2. Interview Transcript: Rob Davis (Chief Executive Officer)
22. APPENDIX I: TABULATED DATA
23. APPENDIX II: LIST OF COMPANIES AND ORGANIZATION
List of Tables
- Table 6.1 Types of Immunotherapies and Affiliated Mechanisms of Action
- Table 6.2 First Generation Immune Checkpoint Therapies
- Table 7.1 Immune Checkpoint Inhibitors: Information on Developer, Drug Name, Target, Generation of Immune Checkpoint Inhibitor and Stage of Development
- Table 7.2 Immune Checkpoint Inhibitors: Information on Drug Name, Type of Molecule and Route of Administration
- Table 7.3 Immune Checkpoint Inhibitors: Information on Target Indication, Therapeutic Area and Type of Therapy
- Table 7.4 Immune Checkpoint Inhibitors: Information on Drug Designations
- Table 7.5 Immune Checkpoint Inhibitors Developers: Information on Year of Establishment, Location of Headquarters (Country / Region) and Company Size
- Table 8.1 Next Generation Immune Checkpoint Inhibitors: Information on Developer, Drug Name, Target, Generation of Immune Checkpoint Inhibitor and Stage of Development
- Table 8.2 Next Generation Immune Checkpoint Inhibitors: Information on Drug Name, Type of Molecule and Route of Administration
- Table 8.3 Next Generation Immune Checkpoint Inhibitors: Information on Target Indication, Therapeutic Area and Type of Therapy
- Table 8.4 Next Generation Immune Checkpoint Inhibitors: Information on Drug Designations
- Table 8.5 Next Generation Immune Checkpoint Inhibitors Developers: Information on Year of Establishment, Location of Headquarters (Country / Region) and Company Size
- Table 8.5 Next Generation Immune Checkpoint Inhibitors Developers: Information on Year of Establishment, Location of Headquarters (Country / Region) and Company Size
- Table 11.1 Next Generation Immune Checkpoint Inhibitors: List of Drug Developers Profiled
- Table 11.2 Arcus Biosciences: Company Overview
- Table 11.3 Drug Profile: Domvanalimab
- Table 11.4 Drug Profile: Quemliclustat
- Table 11.5 Arcus Biosciences: Recent Developments and Future Outlook
- Table 11.6 Genentech: Company Overview
- Table 11.7 Drug Profile: Tiragolumab
- Table 11.8 Johnson & Johnson: Company Overview
- Table 11.9 Drug Profile: Daratumumab
- Table 11.10 Johnson & Johnson: Recent Developments and Future Outlook
- Table 11.11 Merck: Company Overview
- Table 11.12 Drug Profile: Ifinatamab Deruxtecan
- Table 11.13 Merck: Recent Developments and Future Outlook
- Table 11.14 NovaBridge Biosciences: Company Overview
- Table 11.15 Drug Profile: Uliledlimab
- Table 11.16 NovaBridge Biosciences: Recent Developments and Future Outlook
- Table 11.17 Regeneron Pharmaceuticals: Company Overview
- Table 11.18 Drug Profile: FIANLIMAB
- Table 11.19 Regeneron Pharmaceuticals: Recent Developments and Future Outlook
- Table11.20 Glaxosmithkline: Company Overview
- Table11.21 Drug Profile: GSK5764227
- Table11.22 Drug Profile: GSK5733584
- Table11.23 Glaxosmithkline: Recent Developments and Future Outlook
- Table11.24 Sanofi: Company Overview
- Table11.25 Drug Profile: Sarclisa
- Table11.26 Sanofi: Recent Developments and Future Outlook
- Table11.27 Aurigene Oncology: Company Overview
- Table11.28 Drug Profile: Cenopodlin
- Table11.29 Ono Pharmaceutical: Company Overview
- Table11.30 Drug Profile: ONO-4482
- Table11.31 Takeda Pharmaceutical: Company Overview
- Table11.32 Drug Profile: Mezagitamab
- Table 13.1 Next Generation Immune Checkpoint Inhibitors: List of Forecasted Therapies
- Table 22.1 Immune Checkpoint Inhibitors: Distribution by Generation of Target Immune Checkpoint
- Table 22.2 Immune Checkpoint Inhibitors: Distribution by Stage of Development
- Table 22.3 Immune Checkpoint Inhibitors: Analysis Type of Molecule
- Table 22.4 Immune Checkpoint Inhibitors: Distribution by Route of Administration
- Table 22.5 Immune Checkpoint Inhibitors: Distribution by Therapeutic Area
- Table 22.6 Immune Checkpoint Inhibitors: Analysis of Prominent Oncological Indications
- Table 22.7 Immune Checkpoint Inhibitors: Distribution by Prominent Non-Oncological Indications
- Table 22.8 Immune Checkpoint Inhibitors: Distribution by Type of Therapy
- Table 22.9 Immune Checkpoint Inhibitors: Distribution by Drug Designations
- Table 22.10 Immune Checkpoint Inhibitor Developers: Distribution by Year of Establishment
- Table 22.11 Immune Checkpoint Inhibitor Developers: Distribution by Company Size
- Table 22.12 Immune Checkpoint Inhibitor Developers: Distribution by Location of Headquarters (Region)
- Table 22.13 Immune Checkpoint Inhibitor Developers: Distribution by Location of Headquarters (Country)
- Table 22.14 Most Active Players: Distribution by Number of Immune Checkpoint Inhibitor Therapies
- Table 22.15 Most Active Players: Distribution by Prominent Targets
- Table 22.16 Next Generation Immune Checkpoint Inhibitors: Distribution by Target Immune Checkpoint
- Table 22.17 Next Generation Immune Checkpoint Inhibitors: Analysis Stage of Development
- Table 22.18 Next Generation Immune Checkpoint Inhibitors: Distribution by Type of Molecule
- Table 22.19 Next Generation Immune Checkpoint Inhibitors: Distribution by Route of Administration
- Table 22.20 Next Generation Immune Checkpoint Inhibitors: Distribution by Therapeutic Area
- Table 22.21 Next Generation Immune Checkpoint Inhibitors: Distribution by Prominent Oncological Indications
- Table 22.22 Next Generation Immune Checkpoint Inhibitors: Distribution by Prominent Non-Oncological Indications
- Table 22.23 Next Generation Immune Checkpoint Inhibitors: Distribution by Type of Therapy
- Table 22.24 Next Generation Immune Checkpoint Inhibitors: Distribution by Drug Designations
- Table 22.25 Next Generation Immune Checkpoint Inhibitor Developers: Distribution by Year of Establishment
- Table 22.26 Next Generation Immune Checkpoint Inhibitor Developers: Distribution by Company Size
- Table 22.27 Next Generation Immune Checkpoint Inhibitor Developers; Distribution by Location of Headquarters (Region)
- Table 22.28 Next Generation Immune Checkpoint Inhibitor Developers: Distribution by Location of Headquarters (Country)
- Table 22.29 Most Active Players: Distribution by Number of Next Generation Immune Checkpoint Inhibitor Therapies
- Table 22.30 Prominent Next Generation Targets: Distribution by Number of Developers
- Table 22.31 Clinical Trial Analysis: Distribution by Trial Registration Year, Since Pre-2021
- Table 22.32 Clinical Trial Analysis: Distribution by Trial Registration Year and Enrolled Patient Population, Since Pre-2021
- Table 22.33 Clinical Trial Analysis: Distribution by Trial Status
- Table 22.34 Clinical Trial Analysis: Distribution by Trial Registration Year and Trial Status
- Table 22.35 Clinical Trial Analysis: Distribution by Trial Phase
- Table 22.36 Clinical Trial Analysis: Distribution of Enrolled Patient Population by Trial Phase
- Table 22.37 Clinical Trial Analysis: Distribution by Patient Gender
- Table 22.38 Clinical Trial Analysis: Distribution by Therapeutic Area
- Table 22.39 Clinical Trial Analysis: Distribution by Type of Allocation
- Table 22.40 Clinical Trial Analysis: Distribution by Type of Intervention Model
- Table 22.41 Clinical Trial Analysis: Distribution by Type of Masking
- Table 22.42 Clinical Trial Analysis: Distribution by Primary Purpose
- Table 22.43 Clinical Trial Analysis: Distribution by Type of Sponsor / Collaborator
- Table 22.44 Most Active Industry Players: Distribution by Number of Registered Trials
- Table 22.45 Most Active Non-Industry Players: Distribution by Number of Registered Trials
- Table 22.46 Clinical Trial Analysis: Distribution of Clinical Trials by Trial Status and Geography
- Table 22.47 Clinical Trial Analysis: Distribution of Enrolled Patient Population by Trial Status and Geography
- Table 23.48 Global Next Generation Immune Checkpoint Inhibitors Market, Historical Trends (Since 2022) and Forecasted Estimates (till 2035) (USD Million)
- Table 23.49 Global Next Generation Immune Checkpoint Inhibitors Market, Forecasted Estimates (till 2035): Conservative Scenario (USD Million)
- Table 22.50 Global Next Generation Immune Checkpoint Inhibitors Market, Forecasted Estimates (till 2035): Optimistic Scenario (USD Million)
- Table 22.51 Next Generation Immune Checkpoint Inhibitors Market: Distribution by Target Immune Checkpoint (USD Million)
- Table 22.52 Next Generation Immune Checkpoint Inhibitors Market for CD38, Historical Trends (Since 2022) and Forecasted Estimates (till 2035), Conservative, Base and Optimistic Scenarios (USD Million)
- Table 22.53 Next Generation Immune Checkpoint Inhibitors Market for B7-H3, Forecasted Estimates (till 2035), Conservative, Base and Optimistic Scenarios (USD Million)
- Table 22.54 Next Generation Immune Checkpoint Inhibitors Market for TIGIT, Forecasted Estimates (till 2035), Conservative, Base and Optimistic Scenarios (USD Million)
- Table 22.55 Next Generation Immune Checkpoint Inhibitors Market for LAG-3, Historical Trends (Since 2022) and Forecasted Estimates (till 2035), Conservative, Base and Optimistic Scenarios (USD Million)
- Table 22.56 Next Generation Immune Checkpoint Inhibitors Market for CD73, Forecasted Estimates (till 2035), Conservative, Base and Optimistic Scenarios (USD Million)
- Table 22.57 Next Generation Immune Checkpoint Inhibitors Market: Distribution by Target Disease Indication (USD Million)
- Table 22.58 Next Generation Immune Checkpoint Inhibitors Market for Multiple Myeloma, Historical Trends (Since 2022) and Forecasted Estimates (till 2035), Conservative, Base and Optimistic Scenarios (USD Million)
- Table 22.59 Next Generation Immune Checkpoint Inhibitors Market for Lung Cancer, Forecasted Estimates (till 2035), Conservative, Base and Optimistic Scenarios (USD Million)
- Table 22.60 Next Generation Immune Checkpoint Inhibitors Market for Immune Thrombocytopenia, Forecasted Estimates (till 2035), Conservative, Base and Optimistic Scenarios (USD Million)
- Table 22.61 Next Generation Immune Checkpoint Inhibitors Market for Melanoma, Historical Trends (Since 2022) and Forecasted Estimates (till 2035), Conservative, Base and Optimistic Scenarios (USD Million)
- Table 22.62 Next Generation Immune Checkpoint Inhibitors Market for Prostate Cancer, Forecasted Estimates (till 2035), Conservative, Base and Optimistic Scenarios (USD Million)
- Table 22.63 Next Generation Immune Checkpoint Inhibitors Market for Esophageal Cancer, Forecasted Estimates (till 2035), Conservative, Base and Optimistic Scenarios (USD Million)
- Table 22.64 Next Generation Immune Checkpoint Inhibitors Market for Light Chain Amyloidosis, Historical Trends (Since 2022) and Forecasted Estimates (till 2035), Conservative, Base and Optimistic Scenarios (USD Million)
- Table 22.65 Next Generation Immune Checkpoint Inhibitors Market for Pancreatic Cancer, Forecasted Estimates (till 2035), Conservative, Base and Optimistic Scenarios (USD Million)
- Table 22.66 Next Generation Immune Checkpoint Inhibitors Market: Distribution by Type of Molecule (USD Million)
- Table 22.67 Next Generation Immune Checkpoint Inhibitors Market for Biologics, Historical Trends (Since 2022) and Forecasted Estimates (till 2035), Conservative, Base and Optimistic Scenarios (USD Million)
- Table 22.68 Next Generation Immune Checkpoint Inhibitors Market for Small Molecules, Historical Trends (Since 2022) and Forecasted Estimates (till 2035), Conservative, Base and Optimistic Scenarios (USD Million)
- Table 22.69 Next Generation Immune Checkpoint Inhibitors Market: Distribution by Geographical Regions (USD Million)
- Table 22.70 Next Generation Immune Checkpoint Inhibitors Market for North America, Historical Trends (Since 2022) and Forecasted Estimates (till 2035), Conservative, Base and Optimistic Scenarios (USD Million)
- Table 22.71 Next Generation Immune Checkpoint Inhibitors Market for the US, Historical Trends (Since 2022) and Forecasted Estimates (till 2035), Conservative, Base and Optimistic Scenarios (USD Million)
- Table 22.72 Next Generation Immune Checkpoint Inhibitors Market for Canada, Historical Trends (Since 2022) and Forecasted Estimates (till 2035), Conservative, Base and Optimistic Scenarios (USD Million)
- Table 22.71 Next Generation Immune Checkpoint Inhibitors Market for Europe, Historical Trends (Since 2022) and Forecasted Estimates (till 2035), Conservative, Base and Optimistic Scenarios (USD Million)
- Table 22.73 Next Generation Immune Checkpoint Inhibitors Market for EU5, Historical Trends (Since 2022) and Forecasted Estimates (till 2035), Conservative, Base and Optimistic Scenarios (USD Million)
- Table 22.74 Next Generation Immune Checkpoint Inhibitors Market for Rest of Europe, Historical Trends (Since 2022) and Forecasted Estimates (till 2035), Conservative, Base and Optimistic Scenarios (USD Million)
- Table 22.75 Next Generation Immune Checkpoint Inhibitors Market for Asia-Pacific and Rest of the World, Historical Trends (Since 2022) and Forecasted Estimates (till 2035), Conservative, Base and Optimistic Scenarios (USD Million)
- Table 22.76 Next Generation Immune Checkpoint Inhibitors Market for China, Historical Trends (Since 2022) and Forecasted Estimates (till 2035), Conservative, Base and Optimistic Scenarios (USD Million)
- Table 22.77 Next Generation Immune Checkpoint Inhibitors Market for Japan, Historical Trends (Since 2022) and Forecasted Estimates (till 2035), Conservative, Base and Optimistic Scenarios (USD Million)
- Table 22.78 Next Generation Immune Checkpoint Inhibitors Market for Brazil, Historical Trends (Since 2022) and Forecasted Estimates (till 2035), Conservative, Base and Optimistic Scenarios (USD Million)
- Table 22.79 Next Generation Immune Checkpoint Inhibitors Market for Australia, Historical Trends (Since 2022) and Forecasted Estimates (till 2035), Conservative, Base and Optimistic Scenarios (USD Million)
- Table 22.80 Next Generation Immune Checkpoint Inhibitors Market for South Korea, Historical Trends (Since 2022) and Forecasted Estimates (till 2035), Conservative, Base and Optimistic Scenarios (USD Million)
- Table 22.81 Next Generation Immune Checkpoint Inhibitors Market for India, Historical Trends (Since 2022) and Forecasted Estimates (till 2035), Conservative, Base and Optimistic Scenarios (USD Million)
- Table 22.82 Next Generation Immune Checkpoint Inhibitors Market for Argentina, Historical Trends (Since 2022) and Forecasted Estimates (till 2035), Conservative, Base and Optimistic Scenarios (USD Million)
- Table 22.83 Next Generation Immune Checkpoint Inhibitors Market for Israel, Historical Trends (Since 2022) and Forecasted Estimates (till 2035), Conservative, Base and Optimistic Scenarios (USD Million)
- Table 22.84 Next Generation Immune Checkpoint Inhibitors Market for Saudi Arabia, Historical Trends (Since 2022) and Forecasted Estimates (till 2035), Conservative, Base and Optimistic Scenarios (USD Million)
- Table 22.85 Next Generation Immune Checkpoint Inhibitors Market: Distribution by Leading Players (USD Million)
- Table 22.86 Next Generation Immune Checkpoint Inhibitors Market for Johnson and Johnson, Historical Trends (Since 2022) and Forecasted Estimates (till 2035), Conservative, Base and Optimistic Scenarios (USD Million)
- Table 22.87 Next Generation Immune Checkpoint Inhibitors Market for Daichii Sankyo, Estimates (till 2035), Conservative, Base and Optimistic Scenarios (USD Million)
- Table 22.88 Next Generation Immune Checkpoint Inhibitors Market for Arcus Biosciences, Forecasted Estimates (till 2035), Conservative, Base and Optimistic Scenarios (USD Million)
- Table 22.89 Next Generation Immune Checkpoint Inhibitors Market for GlaxoSmithKline, Forecasted Estimates (till 2035), Conservative, Base and Optimistic Scenarios (USD Million)
- Table 22.90 Next Generation Immune Checkpoint Inhibitors Market for Takeda, Forecasted Estimates (till 2035), Conservative, Base and Optimistic Scenarios (USD Million)
- Table 22.91 Next Generation Immune Checkpoint Inhibitors Market for Sanofi, Historical Trends (Since 2022) and Forecasted Estimates (till 2035), Conservative, Base and Optimistic Scenarios (USD Million)
- Table 22.92 Next Generation Immune Checkpoint Inhibitors Market for Regeneron Pharmaceuticals, Forecasted Estimates (till 2035), Conservative, Base and Optimistic Scenarios (USD Million)
- Table 22.93 Next Generation Immune Checkpoint Inhibitors Market for ONO Pharmaceuticals, Historical Trends (Since 2022) and Forecasted Estimates (till 2035), Conservative, Base and Optimistic Scenarios (USD Million)
- Table 22.94 Next Generation Immune Checkpoint Inhibitors Market: Sales Forecast for Therapies, 2022, 2026 and 2035 (USD Million)
- Table 22.95 Next Generation Immune Checkpoint Inhibitors Market for Darzalex, Historical Trends (Since 2022) and Forecasted Estimates (till 2035), Conservative, Base and Optimistic Scenarios (USD Million)
- Table 22.96 Next Generation Immune Checkpoint Inhibitors Market for Sarclisa, Historical Trends (Since 2022) and Forecasted Estimates (till 2035), Conservative, Base and Optimistic Scenarios (USD Million)
- Table 22.97 Next Generation Immune Checkpoint Inhibitors Market for ONO-4882, Historical Trends (Since 2022) and Forecasted Estimates (till 2035), Conservative, Base and Optimistic Scenarios (USD Million)
- Table 22.98 Next Generation Immune Checkpoint Inhibitors Market for Ifinatamab Deruxtecan / MK-2400, Forecasted Estimates (till 2035), Conservative, Base and Optimistic Scenarios (USD Million)
- Table 22.99 Next Generation Immune Checkpoint Inhibitors Market for GSK5764227, Forecasted Estimates (till 2035), Conservative, Base and Optimistic Scenarios (USD Million)
- Table 22.100 Next Generation Immune Checkpoint Inhibitors Market for Mezagitamab (TAK-079), Estimates (till 2035), Conservative, Base and Optimistic Scenarios (USD Million)
- Table 22.101 Next Generation Immune Checkpoint Inhibitors Market for Fianlimab, Forecasted Estimates (till 2035), Conservative, Base and Optimistic Scenarios (USD Million)
- Table 22.102 Next Generation Immune Checkpoint Inhibitors Market for Quemliclustat, Forecasted Estimates (till 2035), Conservative, Base and Optimistic Scenarios (USD Million)
- Table 22.103 Next Generation Immune Checkpoint Inhibitors Market for Domvanalimab, Forecasted Estimates (till 2035), Conservative, Base and Optimistic Scenarios (USD Million)
List of Figures
- Figure 2.1 Research Methodology: Project Methodology
- Figure 2.2 Research Methodology: Data Sources for Secondary Research
- Figure 2.3 Research Methodology: Robust Quality Control
- Figure 3.1 Market Dynamics: Forecast Methodology
- Figure 3.2 Market Dynamics: Market Assessment Framework
- Figure 4.1 Lessons Learnt from Past Recessions
- Figure 5.1 Executive Summary: Market Landscape
- Figure 5.2 Executive Summary: Market Trends
- Figure 5.3 Executive Summary: Market Forecast and Opportunity Analysis
- Figure 6.1 Global Age-Standardized Incidence Rates for Cancer in Top 5 Countries, 2025
- Figure 6.2 Mechanisms of Immunotherapies
- Figure 6.3 Immune Checkpoint Therapies
- Figure 7.1 Immune Checkpoint Inhibitors: Distribution by Generation of Target Immune Checkpoint
- Figure 7.2 Immune Checkpoint Inhibitors: Distribution by Stage of Development
- Figure 7.3 Immune Checkpoint Inhibitors: Distribution by Type of Molecule
- Figure 7.4 Immune Checkpoint Inhibitors: Distribution by Route of Administration
- Figure 7.5 Immune Checkpoint Inhibitors: Distribution by Therapeutic Area
- Figure 7.6 Immune Checkpoint Inhibitors: Distribution by Prominent Oncological Indications
- Figure 7.7 Immune Checkpoint Inhibitors: Distribution by Prominent Non-Oncological Indications
- Figure 7.8 Immune Checkpoint Inhibitors: Distribution by Type of Therapy
- Figure 7.9 Immune Checkpoint Inhibitors: Distribution by Drug Designations
- Figure 7.10 Immune Checkpoint Inhibitor Developers: Distribution by Year of Establishment
- Figure 7.11 Immune Checkpoint Inhibitor Developers: Distribution by Company Size
- Figure 7.12 Immune Checkpoint Inhibitor Developers: Distribution by Location of Headquarters (Region)
- Figure 7.13 Immune Checkpoint Inhibitor Developers: Distribution by Location of Headquarters (Country)
- Figure 7.14 Most Active Players: Distribution by Number of Immune Checkpoint Inhibitor Therapies Developed
- Figure 7.15 Prominent Targets: Distribution by Number of Developers
- Figure 8.1 Next Generation Immune Checkpoint Inhibitors: Distribution by Target Immune Checkpoint
- Figure 8.2 Next Generation Immune Checkpoint Inhibitors: Distribution by Stage of Development
- Figure 8.3 Next Generation Immune Checkpoint Inhibitors: Distribution by Type of Molecule
- Figure 8.4 Next Generation Immune Checkpoint Inhibitors: Distribution by Route of Administration
- Figure 8.5 Next Generation Immune Checkpoint Inhibitors: Distribution by Therapeutic Area
- Figure 8.6 Next Generation Immune Checkpoint Inhibitors: Distribution by Prominent Oncological Indications
- Figure 8.7 Next Generation Immune Checkpoint Inhibitors: Distribution by Prominent Non-Oncological Indications
- Figure 8.8 Next Generation Immune Checkpoint Inhibitors: Distribution by Type of Therapy
- Figure 8.9 Next Generation Immune Checkpoint Inhibitors: Distribution Drug Designations
- Figure 8.10 Next Generation Immune Checkpoint Inhibitor Developers: Distribution by Year of Establishment
- Figure 8.11 Next Generation Immune Checkpoint Inhibitor Developers: Distribution by Company Size
- Figure 8.12 Next Generation Immune Checkpoint Inhibitor Developers: Distribution by Location of Headquarters (Region)
- Figure 8.13 Next Generation Immune Checkpoint Inhibitor Developers: Distribution by Location of Headquarters (Country)
- Figure 8.14 Most Active Players: Distribution by Number of Next Generation Immune Checkpoint Inhibitor Therapies Developed
- Figure 8.15 Prominent Next Generation Targets: Distribution by Number of Developers
- Figure 9.1 Target Competitiveness Analysis: 3D Bubble Analysis for Next Generation Immune Checkpoint Inhibitor Targets
- Figure 9.2 Next Generation Immune Checkpoint Therapies: Spider Web Analysis
- Figure 10.1 Clinical Trial Analysis: Distribution by Trial Registration Year, Since Pre-2021
- Figure 10.2 Clinical Trial Analysis: Distribution by Trial Registration Year and Enrolled Patient Population, Since Pre-2021
- Figure 10.3 Clinical Trial Analysis: Distribution by Trial Status
- Figure 10.4 Clinical Trial Analysis: Distribution by Trial Registration Year and Trial Status
- Figure 10.5 Clinical Trial Analysis: Distribution by Trial Phase
- Figure 10.6 Clinical Trial Analysis: Distribution of Enrolled Patient Population by Trial Phase
- Figure 10.7 Clinical Trial Analysis: Distribution by Patient Gender
- Figure 10.8 Clinical Trial Analysis: Distribution by Therapeutic Area
- Figure 10.9 Clinical Trial Analysis: Distribution by Type of Allocation
- Figure 10.10 Clinical Trial Analysis: Distribution by Type of Intervention Model
- Figure 10.11 Clinical Trial Analysis: Distribution by Type of Masking
- Figure 10.12 Clinical Trial Analysis: Distribution by Trial Purpose
- Figure 10.13 Clinical Trial Analysis: Distribution by Type of Sponsor / Collaborator
- Figure 10.14 Most Active Industry Players: Distribution by Number of Registered Trials
- Figure 10.15 Most Active Non-Industry Players: Distribution by Number of Registered Trials
- Figure 10.16 Clinical Trial Analysis: Distribution of Clinical Trials by Geography
- Figure 10.17 Clinical Trial Analysis: Distribution of Clinical Trials by Trial Status and Geography
- Figure 10.18 Clinical Trial Analysis: Distribution of Enrolled Patient Population by Trial Status and Geography
- Figure 13.1 Global Next Generation Immune Checkpoint Inhibitors Market, Historical Trends (Since 2022) and Forecasted Estimates (till 2035) (USD Million)
- Figure 13.2 Global Next Generation Immune Checkpoint Inhibitors Market, Forecasted Estimates (till 2035): Conservative Scenario (USD Million)
- Figure 13.3 Global Next Generation Immune Checkpoint Inhibitors Market, Forecasted Estimates (till 2035): Optimistic Scenario (USD Million)
- Figure 14.1 Next Generation Immune Checkpoint Inhibitors Market: Distribution by Target Immune Checkpoint
- Figure 14.2 Next Generation Immune Checkpoint Inhibitors Market for CD38: Historical Trends (Since 2022) and Forecasted Estimates (till 2035) (USD Million)
- Figure 14.3 Next Generation Immune Checkpoint Inhibitors Market for B7-H3: Forecasted Estimates (till 2035) (USD Million)
- Figure 14.4 Next Generation Immune Checkpoint Inhibitors Market for TIGIT: Forecasted Estimates (till 2035) (USD Million)
- Figure 14.5 Next Generation Immune Checkpoint Inhibitors Market for LAG-3: Historical Trends (Since 2022) and Forecasted Estimates (till 2035) (USD Million)
- Figure 14.6 Next Generation Immune Checkpoint Inhibitors Market for CD73: Forecasted Estimates (till 2035) (USD Million)
- Figure 15.1 Next Generation Immune Checkpoint Inhibitors Market: Distribution by Target Disease Indication
- Figure 15.2 Next Generation Immune Checkpoint Inhibitors Market for Multiple Myeloma: Historical Trends (Since 2022) and Forecasted Estimates (till 2035) (USD Million)
- Figure 15.3 Next Generation Immune Checkpoint Inhibitors Market for Lung Cancer: Forecasted Estimates (till 2035) (USD Million)
- Figure 15.4 Next Generation Immune Checkpoint Inhibitors Market for Immune Thrombocytopenia: Forecasted Estimates (till 2035) (USD Million)
- Figure 15.5 Next Generation Immune Checkpoint Inhibitors Market for Melanoma: Historical Trends (Since 2022) and Forecasted Estimates (till 2035) (USD Million)
- Figure 15.6 Next Generation Immune Checkpoint Inhibitors Market for Prostate Cancer: Forecasted Estimates (till 2035) (USD Million)
- Figure 15.7 Next Generation Immune Checkpoint Inhibitors Market for Esophageal Cancer: Forecasted Estimates (till 2035) (USD Million)
- Figure 15.8 Next Generation Immune Checkpoint Inhibitors Market for Light Chain Amyloidosis: Historical Trends (Since 2022) and Forecasted Estimates (till 2035) (USD Million)
- Figure 15.9 Next Generation Immune Checkpoint Inhibitors Market for Pancreatic Cancer: Forecasted Estimates (till 2035) (USD Million)
- Figure 16.1 Next Generation Immune Checkpoint Inhibitors Market: Distribution by Type of Molecule
- Figure 16.2 Next Generation Immune Checkpoint Inhibitors Market for Biologics: Historical Trends (Since 2022) and Forecasted Estimates (till 2035) (USD Million)
- Figure 16.3 Next Generation Immune Checkpoint Inhibitors Market for Small Molecules: Historical Trends (Since 2022) and Forecasted Estimates (till 2035) (USD Million)
- Figure 17.1 Next Generation Immune Checkpoint Inhibitors Market: Distribution by Geographical Regions
- Figure 17.2 Next Generation Immune Checkpoint Inhibitors Market in North America: Historical Trends (Since 2022) and Forecasted Estimates (till 2035) (USD Million)
- Figure 17.3 Next Generation Immune Checkpoint Inhibitors Market in United States: Historical Trends (Since 2022) and Forecasted Estimates (till 2035) (USD Million)
- Figure 17.4 Next Generation Immune Checkpoint Inhibitors Market in Canada: Historical Trends (Since 2022) and Forecasted Estimates (till 2035) (USD Million)
- Figure 17.5 Next Generation Immune Checkpoint Inhibitors Market in Europe: Historical Trends (Since 2022) and Forecasted Estimates (till 2035) (USD Million)
- Figure 17.6 Next Generation Immune Checkpoint Inhibitors Market in EU5: Historical Trends (Since 2022) and Forecasted Estimates (till 2035) (USD Million)
- Figure 17.7 Next Generation Immune Checkpoint Inhibitors Market in Rest of Europe: Historical Trends (Since 2022) and Forecasted Estimates (till 2035) (USD Million)
- Figure 17.8 Next Generation Immune Checkpoint Inhibitors Market in Asia-Pacific and Rest of the World: Historical trends (Since 2022) and Forecasted Estimates (till 2035) (USD Million)
- Figure 17.9 Next Generation Immune Checkpoint Inhibitors Market in China: Historical Trends (Since 2022) and Forecasted Estimates (till 2035) (USD Million)
- Figure 17.10 Next Generation Immune Checkpoint Inhibitors Market in Japan: Historical Trends (Since 2022) and Forecasted Estimates (till 2035) (USD Million)
- Figure 17.11 Next Generation Immune Checkpoint Inhibitors Market in Brazil: Historical Trends (Since 2022) and Forecasted Estimates (till 2035) (USD Million)
- Figure 17.12 Next Generation Immune Checkpoint Inhibitors Market in Australia: Historical Trends (Since 2022) and Forecasted Estimates (till 2035) (USD Million)
- Figure 17.13 Next Generation Immune Checkpoint Inhibitors Market in South Korea: Historical Trends (Since 2022) and Forecasted Estimates (till 2035) (USD Million)
- Figure 17.14 Next Generation Immune Checkpoint Inhibitors Market in India: Historical Trends (Since 2022) and Forecasted Estimates (till 2035) (USD Million)
- Figure 17.15 Next Generation Immune Checkpoint Inhibitors Market in Aregntina: Historical Trends (Since 2022) and Forecasted Estimates (till 2035) (USD Million)
- Figure 17.16 Next Generation Immune Checkpoint Inhibitors Market in Israel: Historical Trends (Since 2022) and Forecasted Estimates (till 2035) (USD Million)
- Figure 17.17 Next Generation Immune Checkpoint Inhibitors Market in Saudi Arabia: Historical Trends (Since 2022) and Forecasted Estimates (till 2035) (USD Million)
- Figure 18.1 Next Generation Immune Checkpoint Inhibitors Market: Distribution by Sales Forecast of Leading Players
- Figure 18.2 Next Generation Immune Checkpoint Inhibitors Market: Johnson and Johnson Sales Forecast, 2022-2035 (USD Million)
- Figure 18.3 Next Generation Immune Checkpoint Inhibitors Market: Daiichi Sankyo Sales Forecast, till 2035 (USD Million)
- Figure 18.4 Next Generation Immune Checkpoint Inhibitors Market: Arcus Biosciences Sales Forecast, till 2035 (USD Million)
- Figure 18.5 Next Generation Immune Checkpoint Inhibitors Market: GlaxoSmithKline Sales Forecast, till 2035 (USD Million)
- Figure 18.6 Next Generation Immune Checkpoint Inhibitors Market: Takeda Sales Forecast, till 2035 (USD Million)
- Figure 18.7 Next Generation Immune Checkpoint Inhibitors Market: Sanofi Sales Forecast, 2022-2035 (USD Million)
- Figure 18.8 Next Generation Immune Checkpoint Inhibitors Market: Regeneron Pharmaceuticals Sales Forecast, till 2035 (USD Million)
- Figure 18.9 Next Generation Immune Checkpoint Inhibitors Market: ONO PHARMACEUTICAL Sales Forecast, 2022-2035 (USD Million)
- Figure 19.1 Next Generation Immune Checkpoint Inhibitors Market: Darzalex Sales Forecast, 2022-2035 (USD Million)
- Figure 19.2 Next Generation Immune Checkpoint Inhibitors Market: Sarclisa Sales Forecast, 2022-2035 (USD Million)
- Figure 19.3 Next Generation Immune Checkpoint Inhibitors Market: ONO-4482 Sales Forecast, 2022-2035 (USD Million)
- Figure 19.4 Next Generation Immune Checkpoint Inhibitors Market: Ifinatamab Deruxtecan / MK-2400 Sales Forecast, till 2035 (USD Million)
- Figure 19.5 Next Generation Immune Checkpoint Inhibitors Market: GSK5764227 Sales Forecast, till 2035 (USD Million)
- Figure 19.6 Next Generation Immune Checkpoint Inhibitors Market: Mezagitamab (TAK-079) Sales Forecast, till 2035 (USD Million)
- Figure 19.7 Next Generation Immune Checkpoint Inhibitors Market: Domvanalimab Sales Forecast, till 2035 (USD Million)
- Figure 19.8 Next Generation Immune Checkpoint Inhibitors Market: Fianlimab Sales Forecast, till 2035 (USD Million)
- Figure 19.9 Next Generation Immune Checkpoint Inhibitors Market: Quemliclustat Sakes Forecast, till 2035 (USD Million)
- Figure 20.1 Concluding Remarks: Immune Checkpoint Inhibitors Market Landscape
- Figure 20.2 Concluding Remarks: Next Generation Immune Checkpoint Inhibitors Market Landscape
- Figure 20.3 Concluding Remarks: Clinical Trial Analysis
- Figure 20.4 Concluding Remarks: Market Sizing and Opportunity Analysis
 免疫查核點抑制劑市場報告:按類型、分銷管道、應用和地區分類(2026-2034 年)
 全球免疫查核點抑制劑市場規模、佔有率、趨勢和成長分析報告(2026-2034年)
 免疫查核點抑制劑市場:按適應症、作用機制、給藥途徑和最終用戶分類的全球市場預測,2026-2032年PD-1/PD-L1查核點抑制劑市場按產品、治療線、適應症、最終用戶和分銷管道分類,全球預測,2026-2032 年
 免疫查核點抑制劑市場:依藥物類別、癌症類型、通路和地區分類
 免疫查核點抑制劑市場機會、成長要素、產業趨勢分析及2026年至2035年預測。
 免疫查核點抑制劑市場規模、佔有率和成長分析(按類型、應用、分銷管道和地區分類)-2026-2033年產業預測
 免疫檢查點抑制劑市場-產業趨勢及全球預測(至2030年)-依關鍵免疫檢查點標靶、標靶適應症、作用機轉、治療方式、治療方法及主要地區劃分
 內源性幹細胞動員、全身組織再生和器官間修復途徑-技術趨勢、研發管線和市場展望(2025-2045)
 免疫查核點抑制劑市場分析及預測(至 2034 年):類型、產品、應用、最終用戶、技術、服務、成分、製程、設備