


 |
市場調查報告書
商品編碼
2015367
全球城市空中交通(UAM)市場(至2040年):產業趨勢與預測Urban Air Mobility Market, Till 2040: Industry Trends and Global Forecasts |
||||||
城市空中交通(UAM)市場展望
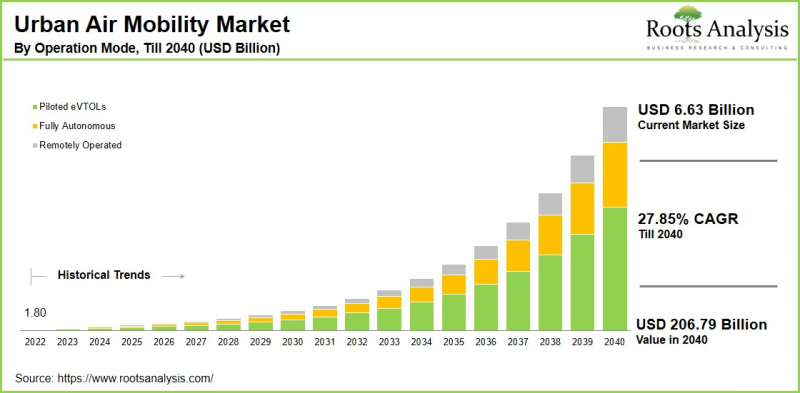
預計到 2040 年,全球城市空中交通 (UAM) 市場規模將達到 2,067.9 億美元,高於目前的 66.3 億美元,到 2040 年複合年成長率將達到 27.85%。
城市空中交通(UAM)是指一種新一代交通基礎設施,它能夠在人口稠密地區實現高度自動化的空中運輸,以滿足乘客和貨物的運輸需求。這個概念主要依賴電動垂直起降(eVTOL)飛機,這些飛機旨在安全地在傳統地面基礎設施之上運行。透過利用垂直空域作為額外的交通運輸層,UAM 旨在補充現有的交通系統,並在城市範圍內實現高效的空中交通。
城市空中交通 (UAM) 的潛在應用十分廣泛,從旨在緩解都市區堵塞的通勤空中計程車,到對準時性要求極高的物流快速貨物運輸,不一而足。其他應用情境還包括緊急醫療運輸、器官運輸、公共監控和災害應變行動。快速的都市化和日益嚴重的交通堵塞,以及自主飛行系統、智慧空中交通管理和電池性能提升等技術的進步,都在推動著 UAM 生態系統的發展。此外,持續的監管發展和儲能領域的創新有望進一步加速 UAM 在未來城市交通生態系統中可擴展的整合。
為高階主管提供策略見解
城市空中交通 (UAM) 市場的主要成長促進因素
城市空中交通 (UAM) 市場的成長主要受都市區擁塞加劇以及對更快、更有效率交通解決方案日益成長的需求所驅動。主要城市的快速都市化和長期交通堵塞促使人們對電動垂直起降 (eVTOL) 飛行器產生了濃厚的興趣。 eVTOL 飛行器開闢了直達空中航線,使人們能夠在城市內部和短距離內快速出行,同時避免了地面基礎設施的限制。同時,電力推進系統、高能量密度電池和人工智慧驅動的自主飛行能力等方面的技術進步,顯著提高了 eVTOL 平台的可行性和成本效益。
此外,來自私人投資者和政府機構的積極投資正在加速研發活動、垂直起降(VTOL)基礎設施建設以及重點地區的試驗計畫。這些因素正在推動城市空中交通(UAM)生態系統的快速發展和商業化。
城市空中交通(UAM)市場:產業內各公司的競爭格局
城市空中交通 (UAM) 市場的特點是許多創新企業積極推廣電動垂直起降飛行器 (eVTOL) 技術,並支援空中運輸解決方案的商業化。 Joby Aviation 憑藉其先進的飛機設計和旨在獲得監管部門核准並建立可擴展的城市空中計程車網路的戰略夥伴關係,已成為該主要企業。
Volocopter專注於自主多旋翼機技術,旨在實現與城市環境的無縫融合,尤其注重低噪音運行以及配套的垂直起降場和空中港基礎設施的開發。另一方面,Archer Aviation則透過快速原型開發和與領先航空企業的合作來增強自身競爭力。這些公司正透過持續的技術創新、策略合作以及前瞻性的舉措,共同塑造城市空中交通(UAM)領域的競爭格局,加速大規模商業部署。
安全城市空中交通(UAM)部署的法規結構
城市空中交通(UAM)服務的發展得益於全球航空當局主導的不斷完善的法規結構和先進的空域管理措施。歐盟航空安全局(EASA)推出了U-Space監管方案,該方案透過數位化服務支援高密度無人機和電動垂直起降飛行器(eVTOL)的運作。
本報告研究了全球城市空中交通(UAM)市場,提供了市場規模估算、機會分析、競爭格局和公司概況等資訊。
目錄
第1章:計劃概述
第2章:調查方法
第3章 市場動態
第4章 宏觀經濟指標
第5章執行摘要
第6章:引言
第7章 監管情景
第8章:主要企業綜合資料庫
第9章 競爭情勢
第10章:閒置頻段分析
第11章:企業競爭力分析
第12章:Start-Ups生態系分析
第13章:公司簡介
- 章節概要
- Airbus
- Archer Aviation
- BETA Technologies
- Ehang Holdings
- Elroy Air
- Eve Air Mobility
- Joby Aviation
- Lilium
- Pipistrel
- Vertical Aerospace
- Volocopter
- Wisk Aero
第14章:分析大趨勢
第15章:未滿足需求的分析
第16章:專利分析
第17章 最新進展
第18章:全球城市空中交通(UAM)市場
第19章 市場機會:依組件分類
第20章 市場機會:依車輛類型分類
第21章 市場機會:依平台架構分類
第22章 市場機會:依經營方式分類
第23章 市場機會:按驅動類型分類
第24章 市場機會:依最大起飛重量分類
第25章 市場機會:透過駕駛里程
第26章 市場機會:依基礎設施分類
第27章 市場機會:依最終用戶分類
第28章 北美城市空中交通(UAM)的市場機會
第29章 歐洲城市空中交通(UAM)的市場機會
第30章:亞太地區城市空中交通(UAM)的市場機會
第31章 拉丁美洲城市空中交通(UAM)的市場機會
第32章 中東和非洲城市空中交通(UAM)的市場機會
第33章 市場集中度分析:依主要企業分類
第34章 鄰近市場分析
第35章:關鍵成功策略
第36章:波特五力分析
第37章 SWOT分析
第38章:價值鏈分析
第39章:魯茨的戰略建議
第40章:來自初步調查的見解
第41章:報告結論
第42章:表格形式數據
第43章 公司與組織列表
Urban Air Mobility Market Outlook
As per Roots Analysis, the global urban air mobility market size is estimated to grow from USD 6.63 billion in current year to USD 206.79 billion by 2040, at a CAGR of 27.85% during the forecast period, till 2040.
Urban Air Mobility (UAM) refers to a next-generation transportation framework that enables on-demand and highly automated aerial transport of passengers and cargo within densely populated environments. This concept primarily relies on electric vertical takeoff and landing (eVTOL) aircraft, which are designed to operate safely above conventional ground infrastructure. By leveraging vertical airspace as an additional mobility layer, UAM aims to complement existing transportation systems, thereby facilitating efficient, city-scale aerial travel.
The potential applications of UAM are diverse, ranging from passenger commuting through air taxis to reduce urban congestion, to rapid cargo delivery for time-sensitive logistics. Additional use cases include emergency medical evacuations, organ transport, public safety monitoring, and disaster response operations. The growth of the UAM ecosystem is being driven by accelerating urbanization and rising traffic congestion, alongside technological advancements such as autonomous flight systems, intelligent air traffic management, and improved battery performance. In addition, ongoing regulatory developments and innovations in energy storage are expected to further support the scalable integration of UAM within future urban mobility ecosystems.
Strategic Insights for Senior Leaders
Key Drivers Propelling Growth of Urban Air Mobility Market
The growth of the urban air mobility market is being driven by increasing urban congestion and the rising demand for faster and more efficient transportation solutions. Rapid urbanization and persistent traffic bottlenecks in major cities have accelerated interest in electric vertical takeoff and landing (eVTOL) aircraft. This enables direct aerial routes for swift intra-city and short-haul travel while bypassing limitations associated with ground-based infrastructure. At the same time, technological advancements in electric propulsion systems, high-energy-density batteries, and artificial intelligence-driven autonomous flight capabilities are significantly improving the feasibility, and cost-effectiveness of eVTOL platforms.
In addition, strong investments from private investors and government bodies have further accelerated research and development activities, vertiport infrastructure deployment, and pilot programs across key regions. Collectively, these factors are contributing to the rapid evolution and commercialization of the urban air mobility ecosystem.
Urban Air Mobility Market: Competitive Landscape of Companies in this Industry
The urban air mobility (UAM) market is characterized by the presence of several innovative companies that are actively advancing eVTOL technologies and supporting the commercialization of aerial mobility solutions. Joby Aviation has emerged as a leading player with its advanced aircraft designs and strategic partnerships aimed at securing regulatory approvals and establishing scalable urban air taxi networks.
Volocopter is focused on autonomous multicopter technology designed for seamless integration into urban environments, with particular emphasis on low-noise operations and the development of supporting vertiport and skyport infrastructure. Meanwhile, Archer Aviation is strengthening its competitive position through rapid prototyping and collaborations with major airlines. Collectively, these companies are shaping the competitive UAM landscape through continuous technological innovation, strategic collaborations, and proactive engagement to accelerate large-scale commercial deployment.
Regulatory Frameworks for Safe Urban Air Mobility Deployment
The development of urban air mobility (UAM) services is being supported by evolving regulatory frameworks and advanced airspace management initiatives led by global aviation authorities. The European Union Aviation Safety Agency (EASA) has introduced the U-Space regulatory package to enable high-density drone and eVTOL operations through digital services.
In the United States, the Federal Aviation Administration (FAA) has outlined a UAM Concept of Operations that supports safe integration of aerial mobility services into the National Airspace System. Meanwhile, AI-driven urban traffic management systems are being developed to coordinate low-altitude airspace using real-time data on weather, traffic, and restricted zones to optimize routes and avoid conflicts. At the international level, the International Civil Aviation Organization (ICAO) is promoting standardized frameworks to ensure regulatory harmonization and interoperability across regions. In addition, regulatory efforts focus on vertiport infrastructure and performance-based standards addressing safety, noise mitigation, cybersecurity, and scalability to support large-scale UAM deployment in urban environments.
Regional Analysis: North America Lead the Urban Air Mobility Market
According to our analysis, in the current year, the urban air mobility market in North America captures the largest share. This can be attributed to a well-established aerospace ecosystem supported by prominent manufacturers such as Boeing and Joby Aviation, along with substantial research and development investments driven by public-private partnerships. In addition, proactive regulatory engagement by the Federal Aviation Administration has accelerated certification processes and pilot programs for emerging aerial mobility technologies. The region also benefits from significant urban congestion in major metropolitan areas, which is increasing the demand for alternative transportation solutions such as air taxis.
Key Challenges in Urban Air Mobility Market
The widespread adoption of urban air mobility (UAM) services is influenced by several operational, regulatory, and market-related challenges. Public acceptance remains a critical factor, particularly concerning safety challenges associated with flights over densely populated urban areas. Issues related to noise pollution, privacy, and apprehension toward autonomous flight technologies can limit public confidence. This highlights the need for transparent communication, robust safety standards, and clearly defined regulatory frameworks to build trust among communities.
In addition, the development of essential ground infrastructure, such as vertiports, presents significant challenges in densely populated cities due to limited land availability, strict zoning regulations, and the requirement to mitigate environmental and noise impacts. Ensuring seamless integration of vertiports with existing transportation networks is also essential to enable efficient multimodal connectivity and enhance user convenience.
Urban Air Mobility Market: Key Market Segmentation
Market Share by Component
- Hardware
- Services
- Software
Market Share by Vehicle Type
- Air Ambulance & Medical Emergency Vehicles
- Air Metro
- Air Shuttle
- Air Taxis
- Cargo Air Vehicles
- Last-mile Delivery Vehicles
- Personal Air Vehicles
Market Share by Platform Architecture
- Fixed Wing
- Hybrid
- Rotory Wing
Market Share by Operation Mode
- Fully Autonomous
- Piloted eVTOLs
- Remotely Operated
Market Share by Propulsion Type
- Electric
- Hybrid-Electric
- Hydrogen Fuel Cell
- Others
Market Share by Maximum Take-off Weight
- <100 kg
- 100-300 kg
- >300 kg
Market Share by Range
- Intercity (50-200 km)
- Intracity (<50 km)
- Long Range (>200 km)
Market Share by Infrastructure
- Air Traffic Control System
- Charging Stations
- Maintenance
- Repair & Overhaul
- Vertiports
- Others
Market Share by End User
- E-Commerce Companies
- Hospitals
- Ridesharing Companies
- Medical Agencies
- Private Operators
- Scheduled Operators
Market Share by Geographical Regions
- North America
- US
- Canada
- Mexico
- Rest of North America
- Europe
- Austria
- Belgium
- Denmark
- France
- Germany
- Ireland
- Italy
- Netherlands
- Norway
- Russia
- Spain
- Sweden
- Switzerland
- UK
- Rest of Europe
- Asia-Pacific
- Australia
- China
- India
- Japan
- New-Zealand
- Singapore
- South Korea
- Rest of Asia-Pacific
- Latin America
- Brazil
- Chile
- Colombia
- Venezuela
- Rest of Latin America
- Middle East and Africa (MEA)
- Egypt
- Iran
- Iraq
- Israel
- Kuwait
- Saudi Arabia
- UAE
- Rest of MEA
Example Players in Urban Air Mobility Market
- Airbus
- Archer Aviation
- BETA Technologies
- Ehang Holdings
- Elroy Air
- Eve Air Mobility
- Joby Aviation
- Lilium
- Pipistrel
- Vertical Aerospace
- Volocopter
- Wisk Aero
Urban Air Mobility Market: Report Coverage
The report on the urban air mobility market features insights on various sections, including:
- Market Sizing and Opportunity Analysis: An in-depth analysis of the urban air mobility market, focusing on key market segments, including [A] component, [B] vehicle type, [C] platform architecture, [D] operation mode, [E] propulsion type, [F] maximum take-off weight, [G] range, [H] infrastructure, [I] end user, [J] geographical regions, and [K] key players.
- Competitive Landscape: A comprehensive analysis of the companies engaged in the urban air mobility market, based on several relevant parameters, such as [A] year of establishment, [B] company size, [C] location of headquarters and [D] ownership structure.
- Company Profiles: Elaborate profiles of prominent players engaged in the urban air mobility market, providing details on [A] location of headquarters, [B] company size, [C] company mission, [D] company footprint, [E] management team, [F] contact details, [G] financial information, [H] operating business segments, [I] product / technology portfolio, [J] recent developments, and an informed future outlook.
- Megatrends: An evaluation of ongoing megatrends in the urban air mobility industry.
- Patent Analysis: An insightful analysis of patents filed / granted in the urban air mobility domain, based on relevant parameters, including [A] type of patent, [B] patent publication year, [C] patent age and [D] leading players.
- Recent Developments: An overview of the recent developments made in the urban air mobility market, along with analysis based on relevant parameters, including [A] year of initiative, [B] type of initiative, [C] geographical distribution and [D] most active players.
- Porter's Five Forces Analysis: An analysis of five competitive forces prevailing in the urban air mobility market, including threats of new entrants, bargaining power of buyers, bargaining power of suppliers, threats of substitute products and rivalry among existing competitors.
- SWOT Analysis: An insightful SWOT framework, highlighting the strengths, weaknesses, opportunities and threats in the domain. Additionally, it provides Harvey ball analysis, highlighting the relative impact of each SWOT parameter.
Key Questions Answered in this Report
- What is the current and future market size?
- Who are the leading companies in this market?
- What are the growth drivers that are likely to influence the evolution of this market?
- What are the key partnership and funding trends shaping this industry?
- Which region is likely to grow at higher CAGR till 2040?
- How is the current and future market opportunity likely to be distributed across key market segments?
Reasons to Buy this Report
- Detailed Market Analysis: The report provides a comprehensive market analysis, offering detailed revenue projections of the overall market and its specific sub-segments. This information is valuable to both established market leaders and emerging entrants.
- In-depth Analysis of Trends: Stakeholders can leverage the report to gain a deeper understanding of the competitive dynamics within the market. Each report maps ecosystem activity across partnerships, funding, and patent landscapes to reveal growth hotspots and white spaces in the industry.
- Opinion of Industry Experts: The report features extensive interviews and surveys with key opinion leaders and industry experts to validate market trends mentioned in the report.
- Decision-ready Deliverables: The report offers stakeholders with strategic frameworks (Porter's Five Forces, value chain, SWOT), and complimentary Excel / slide packs with customization support.
Additional Benefits
- Complimentary Dynamic Excel Dashboards for Analytical Modules
- Exclusive 15% Free Content Customization
- Personalized Interactive Report Walkthrough with Our Expert Research Team
- Free Report Updates for Versions Older than 6-12 Months
TABLE OF CONTENTS
1. PROJECT OVERVIEW
- 1.1. Context
- 1.2. Project Objectives
2. RESEARCH METHODOLOGY
- 2.1. Chapter Overview
- 2.2. Research Assumptions
- 2.3. Database Building
- 2.3.1. Data Collection
- 2.3.2. Data Validation
- 2.3.3. Data Analysis
- 2.4. Project Methodology
- 2.4.1. Secondary Research
- 2.4.1.1. Annual Reports
- 2.4.1.2. Academic Research Papers
- 2.4.1.3. Company Websites
- 2.4.1.4. Investor Presentations
- 2.4.1.5. Regulatory Filings
- 2.4.1.6. White Papers
- 2.4.1.7. Industry Publications
- 2.4.1.8. Conferences and Seminars
- 2.4.1.9. Government Portals
- 2.4.1.10. Media and Press Releases
- 2.4.1.11. Newsletters
- 2.4.1.12. Industry Databases
- 2.4.1.13. Roots Proprietary Databases
- 2.4.1.14. Paid Databases and Sources
- 2.4.1.15. Social Media Portals
- 2.4.1.16. Other Secondary Sources
- 2.4.2. Primary Research
- 2.4.2.1. Introduction
- 2.4.2.2. Types
- 2.4.2.2.1. Qualitative
- 2.4.2.2.2. Quantitative
- 2.4.2.3. Advantages
- 2.4.2.4. Techniques
- 2.4.2.4.1. Interviews
- 2.4.2.4.2. Surveys
- 2.4.2.4.3. Focus Groups
- 2.4.2.4.4. Observational Research
- 2.4.2.4.5. Social Media Interactions
- 2.4.2.5. Stakeholders
- 2.4.2.5.1. Company Executives (CXOs)
- 2.4.2.5.2. Board of Directors
- 2.4.2.5.3. Company Presidents and Vice Presidents
- 2.4.2.5.4. Key Opinion Leaders
- 2.4.2.5.5. Research and Development Heads
- 2.4.2.5.6. Technical Experts
- 2.4.2.5.7. Subject Matter Experts
- 2.4.2.5.8. Scientists
- 2.4.2.5.9. Doctors and Other Healthcare Providers
- 2.4.2.6. Ethics and Integrity
- 2.4.2.6.1. Research Ethics
- 2.4.2.6.2. Data Integrity
- 2.4.3. Analytical Tools and Databases
- 2.4.1. Secondary Research
3. MARKET DYNAMICS
- 3.1. Forecast Methodology
- 3.1.1. Top-Down Approach
- 3.1.2. Bottom-Up Approach
- 3.1.3. Hybrid Approach
- 3.2. Market Assessment Framework
- 3.2.1. Total Addressable Market (TAM)
- 3.2.2. Serviceable Addressable Market (SAM)
- 3.2.3. Serviceable Obtainable Market (SOM)
- 3.2.4. Currently Acquired Market (CAM)
- 3.3. Forecasting Tools and Techniques
- 3.3.1. Qualitative Forecasting
- 3.3.2. Correlation
- 3.3.3. Regression
- 3.3.4. Time Series Analysis
- 3.3.5. Extrapolation
- 3.3.6. Convergence
- 3.3.7. Forecast Error Analysis
- 3.3.8. Data Visualization
- 3.3.9. Scenario Planning
- 3.3.10. Sensitivity Analysis
- 3.4. Key Considerations
- 3.4.1. Demographics
- 3.4.2. Market Access
- 3.4.3. Reimbursement Scenarios
- 3.4.4. Industry Consolidation
- 3.5. Robust Quality Control
- 3.6. Key Market Segmentations
- 3.7. Limitations
4. MACRO-ECONOMIC INDICATORS
- 4.1. Chapter Overview
- 4.2. Market Dynamics
- 4.2.1. Time Period
- 4.2.1.1. Historical Trends
- 4.2.1.2. Current and Forecasted Estimates
- 4.2.2. Currency Coverage
- 4.2.2.1. Overview of Major Currencies Affecting the Market
- 4.2.2.2. Impact of Currency Fluctuations on the Industry
- 4.2.3. Foreign Exchange Impact
- 4.2.3.1. Evaluation of Foreign Exchange Rates and Their Impact on Market
- 4.2.3.2. Strategies for Mitigating Foreign Exchange Risk
- 4.2.4. Recession
- 4.2.4.1. Historical Analysis of Past Recessions and Lessons Learnt
- 4.2.4.2. Assessment of Current Economic Conditions and Potential Impact on the Market
- 4.2.5. Inflation
- 4.2.5.1. Measurement and Analysis of Inflationary Pressures in the Economy
- 4.2.5.2. Potential Impact of Inflation on the Market Evolution
- 4.2.6. Interest Rates
- 4.2.6.1. Overview of Interest Rates and Their Impact on the Market
- 4.2.6.2. Strategies for Managing Interest Rate Risk
- 4.2.7. Commodity Flow Analysis
- 4.2.7.1. Type of Commodity
- 4.2.7.2. Origins and Destinations
- 4.2.7.3. Values and Weights
- 4.2.7.4. Modes of Transportation
- 4.2.8. Global Trade Dynamics
- 4.2.8.1. Import Scenario
- 4.2.8.2. Export Scenario
- 4.2.9. War Impact Analysis
- 4.2.9.1. Russian-Ukraine War
- 4.2.9.2. Israel-Hamas War
- 4.2.10. COVID Impact / Related Factors
- 4.2.10.1. Global Economic Impact
- 4.2.10.2. Industry-specific Impact
- 4.2.10.3. Government Response and Stimulus Measures
- 4.2.10.4. Future Outlook and Adaptation Strategies
- 4.2.11. Other Indicators
- 4.2.11.1. Fiscal Policy
- 4.2.11.2. Consumer Spending
- 4.2.11.3. Gross Domestic Product (GDP)
- 4.2.11.4. Employment
- 4.2.11.5. Taxes
- 4.2.11.6. R&D Innovation
- 4.2.11.7. Stock Market Performance
- 4.2.11.8. Supply Chain
- 4.2.11.9. Cross-Border Dynamics
- 4.2.1. Time Period
- 4.3. Concluding Remarks
5. EXECUTIVE SUMMARY
6. INTRODUCTION
- 6.1. Overview of Urban Air Mobility
- 6.2. Technology of Urban Air Mobility
- 6.3. Advantages of Urban Air Mobility
- 6.4. Challenges Associated with Urban Air Mobility
- 6.5. Future Perspective
7. REGULATORY SCENARIO
8. COMPREHENSIVE DATABASE OF LEADING PLAYERS
9. COMPETITIVE LANDSCAPE
- 9.1. Chapter Overview
- 9.2. Urban Air Mobility Market: Overall Landscape
- 9.2.1. Analysis by Year of Establishment
- 9.2.2. Analysis by Company Size
- 9.2.3. Analysis by Location of Headquarters
- 9.2.4. Analysis by Type of Company
- 9.2.5. Analysis by Type of Interface
- 9.2.6. Analysis by Technology Stack
- 9.3. Key Findings
10. WHITE SPACE ANALYSIS
11. COMPANY COMPETITIVENESS ANALYSIS
12. STARTUP ECOSYSTEM ANALYSIS
- 12.1. Urban Air Mobility Market: Startup Ecosystem Analysis
- 12.1.1. Analysis by Year of Establishment
- 12.1.2. Analysis by Company Size
- 12.1.3. Analysis by Location of Headquarters
- 12.1.4. Analysis by Ownership Type
- 12.1.5. Analysis by Type of Interface
- 12.1.6. Analysis by Technology Stack
- 12.2. Key Findings
13. COMPANY PROFILES
- 13.1. Chapter Overview
- 13.2. Airbus*
- 13.2.1. Company Overview
- 13.2.2. Company Mission
- 13.2.3. Company Footprint
- 13.2.4. Management Team
- 13.2.5. Contact Details
- 13.2.6. Financial Performance
- 13.2.7. Operating Business Segments
- 13.2.8. Service / Product Portfolio (project specific)
- 13.2.9. MOAT Analysis
- 13.2.10. Recent Developments and Future Outlook
- Similar details are presented for other companies (listed below), based on information in the public domain
- 13.3. Archer Aviation
- 13.4. BETA Technologies
- 13.5. Ehang Holdings
- 13.6. Elroy Air
- 13.7. Eve Air Mobility
- 13.8. Joby Aviation
- 13.9. Lilium
- 13.10. Pipistrel
- 13.11. Vertical Aerospace
- 13.12. Volocopter
- 13.13. Wisk Aero
14. MEGA TRENDS ANALYSIS
15. UNMET NEED ANALYSIS
16. PATENT ANALYSIS
17. RECENT DEVELOPMENTS
- 17.1. Chapter Overview
- 17.2. Recent Funding
- 17.3. Recent Partnerships
- 17.4. Other Recent Initiatives
18. GLOBAL URBAN AIR MOBILITY MARKET
- 18.1. Chapter Overview
- 18.2. Key Assumptions and Methodology
- 18.3. Trends Disruption Impacting Market
- 18.4. Demand Side Trends
- 18.5. Supply Side Trends
- 18.6. Global Urban Air Mobility Market: Historical Trends (Since 2022) and Forecasted Estimates (Till 2040)
- 18.7. Multivariate Scenario Analysis
- 18.7.1. Conservative Scenario
- 18.7.2. Optimistic Scenario
- 18.8. Investment Feasibility Index
- 18.9. Key Market Segmentations
19. MARKET OPPORTUNITIES BASED ON COMPONENT
- 19.1. Chapter Overview
- 19.2. Key Assumptions and Methodology
- 19.3. Revenue Shift Analysis
- 19.4. Market Movement Analysis
- 19.5. Penetration-Growth (P-G) Matrix
- 19.6. Urban Air Mobility Market for Hardware: Historical Trends (Since 2022) and Forecasted Estimates (Till 2040)
- 19.7. Urban Air Mobility Market for Services: Historical Trends (Since 2022) and Forecasted Estimates (Till 2040)
- 19.8. Urban Air Mobility Market for Software: Historical Trends (Since 2022) and Forecasted Estimates (Till 2040)
- 19.9. Data Triangulation and Validation
- 19.9.1. Secondary Sources
- 19.9.2. Primary Sources
- 19.9.3. Statistical Modeling
20. MARKET OPPORTUNITIES BASED ON VEHICLE TYPE
- 20.1. Chapter Overview
- 20.2. Key Assumptions and Methodology
- 20.3. Revenue Shift Analysis
- 20.4. Market Movement Analysis
- 20.5. Penetration-Growth (P-G) Matrix
- 20.6. Urban Air Mobility Market for Air Ambulance & Medical Emergency Vehicles: Historical Trends (Since 2022) and Forecasted Estimates (Till 2040)
- 20.7. Urban Air Mobility Market for Air Metro: Historical Trends (Since 2022) and Forecasted Estimates (Till 2040)
- 20.8. Urban Air Mobility Market for Air Shuttle: Historical Trends (Since 2022) and Forecasted Estimates (Till 2040)
- 20.9. Urban Air Mobility Market for Air Taxis: Historical Trends (Since 2022) and Forecasted Estimates (Till 2040)
- 20.10. Urban Air Mobility Market for Cargo Air Vehicles: Historical Trends (Since 2022) and Forecasted Estimates (Till 2040)
- 20.11. Urban Air Mobility Market for Last-mile Delivery Vehicles: Historical Trends (Since 2022) and Forecasted Estimates (Till 2040)
- 20.12. Urban Air Mobility Market for Personal Air Vehicles: Historical Trends (Since 2022) and Forecasted Estimates (Till 2040)
- 20.13. Data Triangulation and Validation
- 20.13.1. Secondary Sources
- 20.13.2. Primary Sources
- 20.13.3. Statistical Modeling
21. MARKET OPPORTUNITIES BASED ON PLATFORM ARCHITECTURE
- 21.1. Chapter Overview
- 21.2. Key Assumptions and Methodology
- 21.3. Revenue Shift Analysis
- 21.4. Market Movement Analysis
- 21.5. Penetration-Growth (P-G) Matrix
- 21.6. Urban Air Mobility Market for Fixed Wing: Historical Trends (Since 2022) and Forecasted Estimates (Till 2040)
- 21.7. Urban Air Mobility Market for Hybrid: Historical Trends (Since 2022) and Forecasted Estimates (Till 2040)
- 21.8. Urban Air Mobility Market for Rotory Wing: Historical Trends (Since 2022) and Forecasted Estimates (Till 2040)
- 21.9. Data Triangulation and Validation
- 21.9.1. Secondary Sources
- 21.9.2. Primary Sources
- 21.9.3. Statistical Modeling
22. MARKET OPPORTUNITIES BASED ON OPERATION MODE
- 22.1. Chapter Overview
- 22.2. Key Assumptions and Methodology
- 22.3. Revenue Shift Analysis
- 22.4. Market Movement Analysis
- 22.5. Penetration-Growth (P-G) Matrix
- 22.6. Urban Air Mobility Market for Fully Autonomous: Historical Trends (Since 2022) and Forecasted Estimates (Till 2040)
- 22.7. Urban Air Mobility Market for Piloted eVTOLs: Historical Trends (Since 2022) and Forecasted Estimates (Till 2040)
- 22.8. Urban Air Mobility Market for Remotely Operated: Historical Trends (Since 2022) and Forecasted Estimates (Till 2040)
- 22.9. Data Triangulation and Validation
- 22.9.1. Secondary Sources
- 22.9.2. Primary Sources
- 22.9.3. Statistical Modeling
23. MARKET OPPORTUNITIES BASED ON PROPULSION TYPE
- 23.1. Chapter Overview
- 23.2. Key Assumptions and Methodology
- 23.3. Revenue Shift Analysis
- 23.4. Market Movement Analysis
- 23.5. Penetration-Growth (P-G) Matrix
- 23.6. Urban Air Mobility Market for Electric: Historical Trends (Since 2022) and Forecasted Estimates (Till 2040)
- 23.7. Urban Air Mobility Market for Hybrid-Electric: Historical Trends (Since 2022) and Forecasted Estimates (Till 2040)
- 23.8. Urban Air Mobility Market for Hydrogen Fuel Cell: Historical Trends (Since 2022) and Forecasted Estimates (Till 2040)
- 23.9. Urban Air Mobility Market for Others: Historical Trends (Since 2022) and Forecasted Estimates (Till 2040)
- 23.10. Data Triangulation and Validation
- 23.10.1. Secondary Sources
- 23.10.2. Primary Sources
- 23.10.3. Statistical Modeling
24. MARKET OPPORTUNITIES BASED ON MAXIMUM TAKE-OFF WEIGHT
- 24.1. Chapter Overview
- 24.2. Key Assumptions and Methodology
- 24.3. Revenue Shift Analysis
- 24.4. Market Movement Analysis
- 24.5. Penetration-Growth (P-G) Matrix
- 24.6. Urban Air Mobility Market for <100 kg: Historical Trends (Since 2022) and Forecasted Estimates (Till 2040)
- 24.7. Urban Air Mobility Market for 100-300 kg: Historical Trends (Since 2022) and Forecasted Estimates (Till 2040)
- 24.8. Urban Air Mobility Market for >300 kg: Historical Trends (Since 2022) and Forecasted Estimates (Till 2040)
- 24.9. Data Triangulation and Validation
- 24.9.1. Secondary Sources
- 24.9.2. Primary Sources
- 24.9.3. Statistical Modeling
25. MARKET OPPORTUNITIES BASED ON RANGE
- 25.1. Chapter Overview
- 25.2. Key Assumptions and Methodology
- 25.3. Revenue Shift Analysis
- 25.4. Market Movement Analysis
- 25.5. Penetration-Growth (P-G) Matrix
- 25.6. Urban Air Mobility Market for Intercity (50-200 km): Historical Trends (Since 2022) and Forecasted Estimates (Till 2040)
- 25.7. Urban Air Mobility Market for Intracity (<50 km): Historical Trends (Since 2022) and Forecasted Estimates (Till 2040)
- 25.8. Urban Air Mobility Market for Long Range (>200 km): Historical Trends (Since 2022) and Forecasted Estimates (Till 2040)
- 25.9. Data Triangulation and Validation
- 25.9.1. Secondary Sources
- 25.9.2. Primary Sources
- 25.9.3. Statistical Modeling
26. MARKET OPPORTUNITIES BASED ON INFRASTRUCTURE
- 26.1. Chapter Overview
- 26.2. Key Assumptions and Methodology
- 26.3. Revenue Shift Analysis
- 26.4. Market Movement Analysis
- 26.5. Penetration-Growth (P-G) Matrix
- 26.6. Urban Air Mobility Market for Air Traffic Control System: Historical Trends (Since 2022) and Forecasted Estimates (Till 2040)
- 26.7. Urban Air Mobility Market for Charging Stations: Historical Trends (Since 2022) and Forecasted Estimates (Till 2040)
- 26.8. Urban Air Mobility Market for Maintenance: Historical Trends (Since 2022) and Forecasted Estimates (Till 2040)
- 26.9. Urban Air Mobility Market for Repair & Overhaul: Historical Trends (Since 2022) and Forecasted Estimates (Till 2040)
- 26.10. Urban Air Mobility Market for Vertiports: Historical Trends (Since 2022) and Forecasted Estimates (Till 2040)
- 26.11. Urban Air Mobility Market for Others: Historical Trends (Since 2022) and Forecasted Estimates (Till 2040)
- 26.12. Data Triangulation and Validation
- 26.12.1. Secondary Sources
- 26.12.2. Primary Sources
- 26.12.3. Statistical Modeling
27. MARKET OPPORTUNITIES BASED ON END USER
- 27.1. Chapter Overview
- 27.2. Key Assumptions and Methodology
- 27.3. Revenue Shift Analysis
- 27.4. Market Movement Analysis
- 27.5. Penetration-Growth (P-G) Matrix
- 27.6. Urban Air Mobility Market for E-Commerce Companies: Historical Trends (Since 2022) and Forecasted Estimates (Till 2040)
- 27.7. Urban Air Mobility Market for Hospitals: Historical Trends (Since 2022) and Forecasted Estimates (Till 2040)
- 27.8. Urban Air Mobility Market for Ridesharing Companies: Historical Trends (Since 2022) and Forecasted Estimates (Till 2040)
- 27.9. Urban Air Mobility Market for Medical Agencies: Historical Trends (Since 2022) and Forecasted Estimates (Till 2040)
- 27.10. Urban Air Mobility Market for Private Operators: Historical Trends (Since 2022) and Forecasted Estimates (Till 2040)
- 27.11. Urban Air Mobility Market for Scheduled Operators: Historical Trends (Since 2022) and Forecasted Estimates (Till 2040)
- 27.12. Data Triangulation and Validation
- 27.12.1. Secondary Sources
- 27.12.2. Primary Sources
- 27.12.3. Statistical Modeling
28. MARKET OPPORTUNITIES FOR URBAN AIR MOBILITY IN NORTH AMERICA
- 28.1. Chapter Overview
- 28.2. Key Assumptions and Methodology
- 28.3. Revenue Shift Analysis
- 28.4. Market Movement Analysis
- 28.5. Penetration-Growth (P-G) Matrix
- 28.6. Urban Air Mobility Market in North America: Historical Trends (Since 2022) and Forecasted Estimates (Till 2040)
- 28.6.1. Urban Air Mobility Market in the US: Historical Trends (Since 2022) and Forecasted Estimates (Till 2040)
- 28.6.2. Urban Air Mobility Market in Canada: Historical Trends (Since 2022) and Forecasted Estimates (Till 2040)
- 28.6.3. Urban Air Mobility Market in Mexico: Historical Trends (Since 2022) and Forecasted Estimates (Till 2040)
- 28.6.4. Urban Air Mobility Market in Rest of North America: Historical Trends (Since 2022) and Forecasted Estimates (Till 2040)
- 28.7. Data Triangulation and Validation
29. MARKET OPPORTUNITIES FOR URBAN AIR MOBILITY IN EUROPE
- 29.1. Chapter Overview
- 29.2. Key Assumptions and Methodology
- 29.3. Revenue Shift Analysis
- 29.4. Market Movement Analysis
- 29.5. Penetration-Growth (P-G) Matrix
- 29.6. Urban Air Mobility Market in Europe: Historical Trends (Since 2022) and Forecasted Estimates (Till 2040)
- 29.6.1. Urban Air Mobility Market in Austria: Historical Trends (Since 2022) and Forecasted Estimates (Till 2040)
- 29.6.2. Urban Air Mobility Market in Belgium: Historical Trends (Since 2022) and Forecasted Estimates (Till 2040)
- 29.6.3. Urban Air Mobility Market in Denmark: Historical Trends (Since 2022) and Forecasted Estimates (Till 2040)
- 29.6.4. Urban Air Mobility Market in France: Historical Trends (Since 2022) and Forecasted Estimates (Till 2040)
- 29.6.5. Urban Air Mobility Market in Germany: Historical Trends (Since 2022) and Forecasted Estimates (Till 2040)
- 29.6.6. Urban Air Mobility Market in Ireland: Historical Trends (Since 2022) and Forecasted Estimates (Till 2040)
- 29.6.7. Urban Air Mobility Market in Italy: Historical Trends (Since 2022) and Forecasted Estimates (Till 2040)
- 29.6.8. Urban Air Mobility Market in the Netherlands: Historical Trends (Since 2022) and Forecasted Estimates (Till 2040)
- 29.6.9. Urban Air Mobility Market in Norway: Historical Trends (Since 2022) and Forecasted Estimates (Till 2040)
- 29.6.10. Urban Air Mobility Market in Russia: Historical Trends (Since 2022) and Forecasted Estimates (Till 2040)
- 29.6.11. Urban Air Mobility Market in Spain: Historical Trends (Since 2022) and Forecasted Estimates (Till 2040)
- 29.6.12. Urban Air Mobility Market in Sweden: Historical Trends (Since 2022) and Forecasted Estimates (Till 2040)
- 29.6.13. Urban Air Mobility Market in Switzerland: Historical Trends (Since 2022) and Forecasted Estimates (Till 2040)
- 29.6.14. Urban Air Mobility Market in the UK: Historical Trends (Since 2022) and Forecasted Estimates (Till 2040)
- 29.6.15. Urban Air Mobility Market in Rest of Europe: Historical Trends (Since 2022) and Forecasted Estimates (Till 2040)
- 29.7. Data Triangulation and Validation
30. MARKET OPPORTUNITIES FOR URBAN AIR MOBILITY IN ASIA-PACIFIC
- 30.1. Chapter Overview
- 30.2. Key Assumptions and Methodology
- 30.3. Revenue Shift Analysis
- 30.4. Market Movement Analysis
- 30.5. Penetration-Growth (P-G) Matrix
- 30.6. Urban Air Mobility Market in Asia-Pacific: Historical Trends (Since 2022) and Forecasted Estimates (Till 2040)
- 30.6.1. Urban Air Mobility Market in China: Historical Trends (Since 2022) and Forecasted Estimates (Till 2040)
- 30.6.2. Urban Air Mobility Market in India: Historical Trends (Since 2022) and Forecasted Estimates (Till 2040)
- 30.6.3. Urban Air Mobility Market in Japan: Historical Trends (Since 2022) and Forecasted Estimates (Till 2040)
- 30.6.4. Urban Air Mobility Market in Singapore: Historical Trends (Since 2022) and Forecasted Estimates (Till 2040)
- 30.6.5. Urban Air Mobility Market in South Korea: Historical Trends (Since 2022) and Forecasted Estimates (Till 2040)
- 30.6.6. Urban Air Mobility Market in Rest of Asia-Pacific: Historical Trends (Since 2022) and Forecasted Estimates (Till 2040)
- 30.7. Data Triangulation and Validation
31. MARKET OPPORTUNITIES FOR URBAN AIR MOBILITY IN LATIN AMERICA
- 31.1. Chapter Overview
- 31.2. Key Assumptions and Methodology
- 31.3. Revenue Shift Analysis
- 31.4. Market Movement Analysis
- 31.5. Penetration-Growth (P-G) Matrix
- 31.6. Urban Air Mobility Market in Latin America: Historical Trends (Since 2022) and Forecasted Estimates (Till 2040)
- 31.6.1. Urban Air Mobility Market in Argentina: Historical Trends (Since 2022) and Forecasted Estimates (Till 2040)
- 31.6.2. Urban Air Mobility Market in Brazil: Historical Trends (Since 2022) and Forecasted Estimates (Till 2040)
- 31.6.3. Urban Air Mobility Market in Chile: Historical Trends (Since 2022) and Forecasted Estimates (Till 2040)
- 31.6.4. Urban Air Mobility Market in Colombia Historical Trends (Since 2022) and Forecasted Estimates (Till 2040)
- 31.6.5. Urban Air Mobility Market in Venezuela: Historical Trends (Since 2022) and Forecasted Estimates (Till 2040)
- 31.6.6. Urban Air Mobility Market in Rest of Latin America: Historical Trends (Since 2022) and Forecasted Estimates (Till 2040)
- 31.7. Data Triangulation and Validation
32. MARKET OPPORTUNITIES FOR URBAN AIR MOBILITY IN MIDDLE EAST AND AFRICA (MEA)
- 32.1. Chapter Overview
- 32.2. Key Assumptions and Methodology
- 32.3. Revenue Shift Analysis
- 32.4. Market Movement Analysis
- 32.5. Penetration-Growth (P-G) Matrix
- 32.6. Urban Air Mobility Market in Middle East and Africa (MEA): Historical Trends (Since 2022) and Forecasted Estimates (Till 2040)
- 32.6.1. Urban Air Mobility Market in Egypt: Forecasted Estimates (Till 205)
- 32.6.2. Urban Air Mobility Market in Iran: Historical Trends (Since 2022) and Forecasted Estimates (Till 2040)
- 32.6.3. Urban Air Mobility Market in Iraq: Historical Trends (Since 2022) and Forecasted Estimates (Till 2040)
- 32.6.4. Urban Air Mobility Market in Israel: Historical Trends (Since 2022) and Forecasted Estimates (Till 2040)
- 32.6.5. Urban Air Mobility Market in Kuwait: Historical Trends (Since 2022) and Forecasted Estimates (Till 2040)
- 32.6.6. Urban Air Mobility Market in Saudi Arabia: Historical Trends (Since 2022) and Forecasted Estimates (Till 2040)
- 32.6.7. Urban Air Mobility Market in United Arab Emirates (UAE): Historical Trends (Since 2022) and Forecasted Estimates (Till 2040)
- 32.6.8. Urban Air Mobility Market in Rest of MEA: Historical Trends (Since 2022) and Forecasted Estimates (Till 2040)
- 32.7. Data Triangulation and Validation
33. MARKET CONCENTRATION ANALYSIS: DISTRIBUTION BY LEADING PLAYERS
34. ADJACENT MARKET ANALYSIS
35. KEY WINNING STRATEGIES
36. PORTER'S FIVE FORCES ANALYSIS
37. SWOT ANALYSIS
38. VALUE CHAIN ANALYSIS
39. ROOTS STRATEGIC RECOMMENDATIONS
- 39.1. Chapter Overview
- 39.2. Key Business-related Strategies
- 39.2.1. Research & Development
- 39.2.2. Product Manufacturing
- 39.2.3. Commercialization / Go-to-Market
- 39.2.4. Sales and Marketing
- 39.3. Key Operations-related Strategies
- 39.3.1. Risk Management
- 39.3.2. Workforce
- 39.3.3. Finance
- 39.3.4. Others
40. INSIGHTS FROM PRIMARY RESEARCH
41. REPORT CONCLUSION
42. TABULATED DATA
43. LIST OF COMPANIES AND ORGANIZATIONS
 城市空中運輸市場-2026-2032年全球市場預測
 先進空中交通市場規模、佔有率和成長分析:按飛機類型、推進技術、應用、基礎設施配置和地區分類-2026-2033年產業預測
 城市空中交通市場:商業機會、成長要素、產業趨勢分析及2026-2035年預測
 垂直起降場市場規模、佔有率和成長分析:按基礎設施類型、組件、應用、最終用戶、部署模式、電源和地區分類-2026-2033年產業預測垂直起降場市場商業機會、成長要素、產業趨勢分析及 2026-2035 年預測。
 2026年全球城市航空運輸市場報告2026年全球垂直起降機場市場報告垂直起降場市場:按類型、基礎設施、位置、技術整合和應用分類-2026-2032年全球市場預測
 城市空中運輸市場規模、佔有率、成長及全球產業分析:按類型、應用和地區分類的洞察,2026-2034 年預測
 城市空中交通市場-全球產業規模、佔有率、趨勢、機會與預測:按車輛類型、應用、地區和競爭格局分類,2021-2031年